
Key takeaways
ICT reviews Nasdaq 100 futures using three arrays, the first presented fair value gap after nine thirty a.m.
Read the full summary
ICT reviews Nasdaq 100 futures using three arrays, the first presented fair value gap after nine thirty a.m. Eastern, the first such gap with displacement that clears a referenced high or low, and the first presented reflection fair value gap, defined as the first immediate opposing imbalance derived from the original gap rather than a later displacement gap. If the original gap is a BISI, the reflection is the first subsequent SIBI, while a first SIBI has no significance under his rule if the original gap was not a BISI. After the Labor Day session closed early at one p.m. Eastern, ICT reduced the platform display of six contracts to one because post-holiday volume can produce uncertain price action. He leaned short while candle bodies remained below the wick midpoint called consequent encroachment, used the wick high as the stop reference, and said a close above the SIBI midpoint would instead favor a return to the nine thirty opening price. His modest exit targeted the consequent encroachment of a suspension block within the seven to nine a.m. premarket range, while 29,593.25 marked the regular-hours opening range gap midpoint and price later reached 29,468 after clearing the premarket, London, and overnight lows. He recommends fixed session windows, prewritten if-then rules, reduced size under uncertainty, topic journals, TradingView Bar Replay for forward marking, Pine Script only after definitions are consistent, and the unofficial open-source LuxAlgo Smart Money Concepts indicator for plotting fair value gaps and related structures. The chart annotations, fills, levels, and results are ICT’s unverified claims and not investment advice.
How we researched this article
BestProps used document-based research from primary firm sources, checked September 24, 2026. The complete source list, scope, limitations, and commercial-state record appear near the end of this article.
In NQ Futures Review & 1st Presented Reflection FVG, ICT walks through a Nasdaq-100 futures session he calls a post-holiday review, using it to separate three of his price-delivery arrays: the first presented fair value gap, the first presented fair value gap with displacement, and the opposing formation he names the reflection fair value gap. He also explains why he traded the session with a single contract.
This is a transcript-grounded account of ICT’s own interpretation. The captions record what he says and when he says it; they cannot independently verify the chart markings, the order fills, the stated levels, or the later path of price. Nothing here is investment advice, and a reported trade is not evidence of repeatable profitability.
Three ICT Presented FVG Arrays
ICT opens on the previous Friday’s chart and points to a gap he had already annotated during an earlier part of the series. He labels it a first presented fair value gap and then draws the distinction that the lesson turns on: a first presented fair value gap is one array, and a first presented fair value gap containing displacement is a separate array (0:57, 1:17).
His working definition of displacement in this lesson is narrow. It is not merely a large candle; it is movement that is part of a run which takes out a referenced high or low (1:26). He notes that the gap he is pointing at does not qualify, because the candles involved failed to clear the specific highs and lows he is using as references.
- First presented fair value gap The first qualifying imbalance in his sequence, identified after 9:30 a.m. Eastern (4:46).
- First presented fair value gap with displacement The first such gap that forms as part of a run clearing a referenced high or low. He says this is the one he places more emphasis on, and specifically the first one after 9:30 a.m. Eastern (2:01).
- First presented reflection fair value gap The first later imbalance whose direction is the immediate opposite of the original first presented gap.
He also says the plain first presented gap does not lose its importance just because a displacement gap exists elsewhere in the sequence. He describes it as remaining crucial to how he read the day, with the first opposing imbalance marked from it (3:33).
How ICT Defines the Reflection FVG
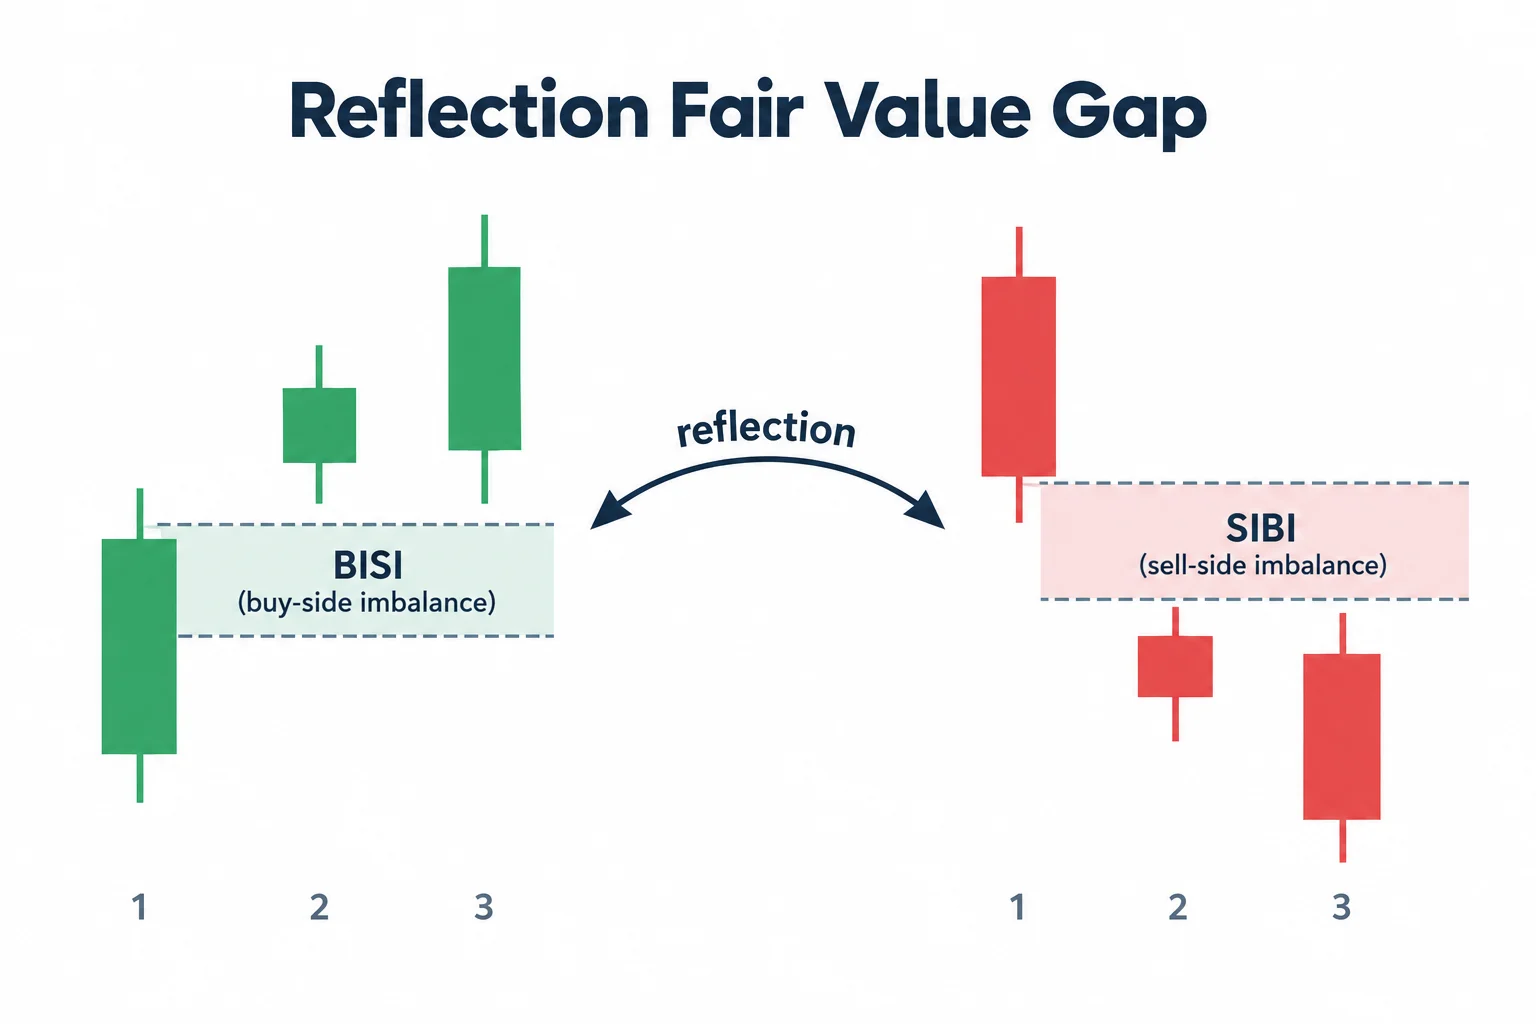
The reflection label depends entirely on how the original gap is classified. ICT describes the first presented gap in his Friday example as a buy-side imbalance, sell-side inefficiency (the up-close inefficiency commonly shortened to BISI. Its opposite is a sell-side imbalance, buy-side inefficiency, or SIBI, created by a down-close inefficiency candle (2:38, 3:02).
Because that first presented gap was a BISI, his instruction is to go through price action after 9:30 a.m. Eastern and find the very first SIBI that forms. That opposing formation is what he calls the reflection fair value gap (2:57, 4:27). In the Friday example, the first SIBI appears roughly one minute after 10:00 a.m. Eastern, which he treats as additional context because it sits inside what he calls a macro time (4:59). He does not define “macro time” in this video, so that term still requires his other material.
Two conditions matter more than the name itself. First, classification is taken from the original first presented gap, not from a later displacement gap: if an ordinary fair value gap prints before a gap that contains displacement, he says to go back to the ordinary first-presented gap to decide what the reflection is (7:11). Second, he states that if the first presented gap is not a BISI, then the first SIBI that forms carries no significance for him (7:24). The reflection therefore is not “any opposing gap”; the sequence and the classification gate it.
He explains the naming with a mirror. A reflection is backwards, he says: what you see in the glass is the opposite of the object (6:41). He adds that the idea is strengthened when the opposing gap is what he calls a macro delivered inefficiency, as he says occurred on the Friday in question (7:40).
Carrying the First Presented FVG Into Later Sessions
From this point the review becomes a walk-forward. He describes Monday trading meandering and then returning into the extended reflection fair value gap, with an overshoot around 1:00 a.m. Eastern Tuesday that he dismisses as dead time (7:59). He also refers back to trading inside the Friday, August 28 first presented fair value gap during the overnight session, targeting relative equal highs rather than a higher high sitting further left (9:57).
The main session reading is laid out from the open. Price opens at 9:30, rallies, wicks through the extended first presented reflection fair value gap, then closes back below a line he had used as an Asian-session target. He says that close gave him conviction to watch the middle of that wick (the level he calls consequent encroachment) and that his stated condition was to lean short while no candle body closed above it (12:04, 12:34).
His preferred entry location, had he been trading full size, was inside that gap, at minimum in its lower half, because he considers the halfway point and below to be where bodies become informative (16:47). He describes taking a fill inside a bearish fair value gap that also carried a small volume imbalance at its high (15:22), and says he used the high of the wick as his stop reference (17:27). These are his reported actions on a chart, not verified executions: the captions cannot confirm prices, sizes, or fills.
Why ICT Reduced Size for the Reflection FVG Trade
The position-size decision is the second teaching point. ICT says the previous day was Labor Day Monday in the United States, that the holiday session closed early at 1:00 p.m. Eastern, and that the gap in participation leaves holiday volume that can make the first day back behave oddly even when it occasionally delivers cleanly (18:06). He says the platform had shown six contracts and that he deliberately worked with one, so that he was demonstrating the restraint he teaches rather than chasing the largest available move (18:43).
He reinforces the point at the end of the session review: the title of the lesson was how to engage price action after holiday volume, not how to extract the maximum trade, and he says he does not regret showing the reduced-size version (22:23). For a newer trader his framing is about avoiding large expectations on a session whose character is uncertain.
What ICT Says the Presented FVG Levels Showed
ICT attributes the session’s delivery to the array set he had already marked. On his account, price rolled through the Friday, September 4 first presented fair value gap with displacement, then traded up into its consequent encroachment and failed to reach the 9:30 opening price, which he calls weakness (18:53). He adds that after a strong displacement lower he did not want the whole range retraced, and that the body staying in the lower half of the lower half of the SIBI was, in his words, extremely weak (19:52).
He gives an if-then: had price closed above the midpoint he drew in the SIBI (the level he took from two reference points forming a 50% division), he expected a return to the 9:30 opening price, and because that did not happen he stayed with the short-side read (19:28). He identifies his exit area as the consequent encroachment of a premarket structure he calls the suspension block, which he places inside the 7:00 to 9:00 a.m. premarket session, and he separately names 29,593.25 as the consequent encroachment of the regular trading hours opening range gap (20:06, 20:49). Values he speaks aloud are quoted here as caption-rendered figures; treat them as his chart readings, not as independently confirmed prices.
Later in the review he points to a high shared by two candles, the low of the 7:00 to 9:00 range, and other levels, and argues that they confirm and validate every array the session formed to the downside, including the SIBI he used (27:26, 27:54). He also describes price breaking lower and clearing the 7:00 to 9:00 range low, the London low, and the lowest overnight level, with another lower low at 29,468 (21:47, 22:11).
ICT Reflection FVG Setups and Uncertainty
The exit philosophy is stated plainly. He says he chose what he calls a low-hanging fruit objective (the easiest reference to reach) and that he is content if price travels further after he is out. He describes the choice as a protocol against greed rather than a forecast (28:41, 29:06). His justification is epistemic: after a holiday, with pent-up positioning on both sides, he says he does not know and neither does anyone else how the session will behave, so the objective should be modest (29:16).
He is equally explicit about the sessions he does not want. Describing the later drift, he says days after holidays can be “funky” and that this was not a day he wanted to participate in heavily, because the conditions were not, in his judgement, conducive to what he calls low resistance liquidity runs (31:06).
ICT Presented FVG Lessons for Traders
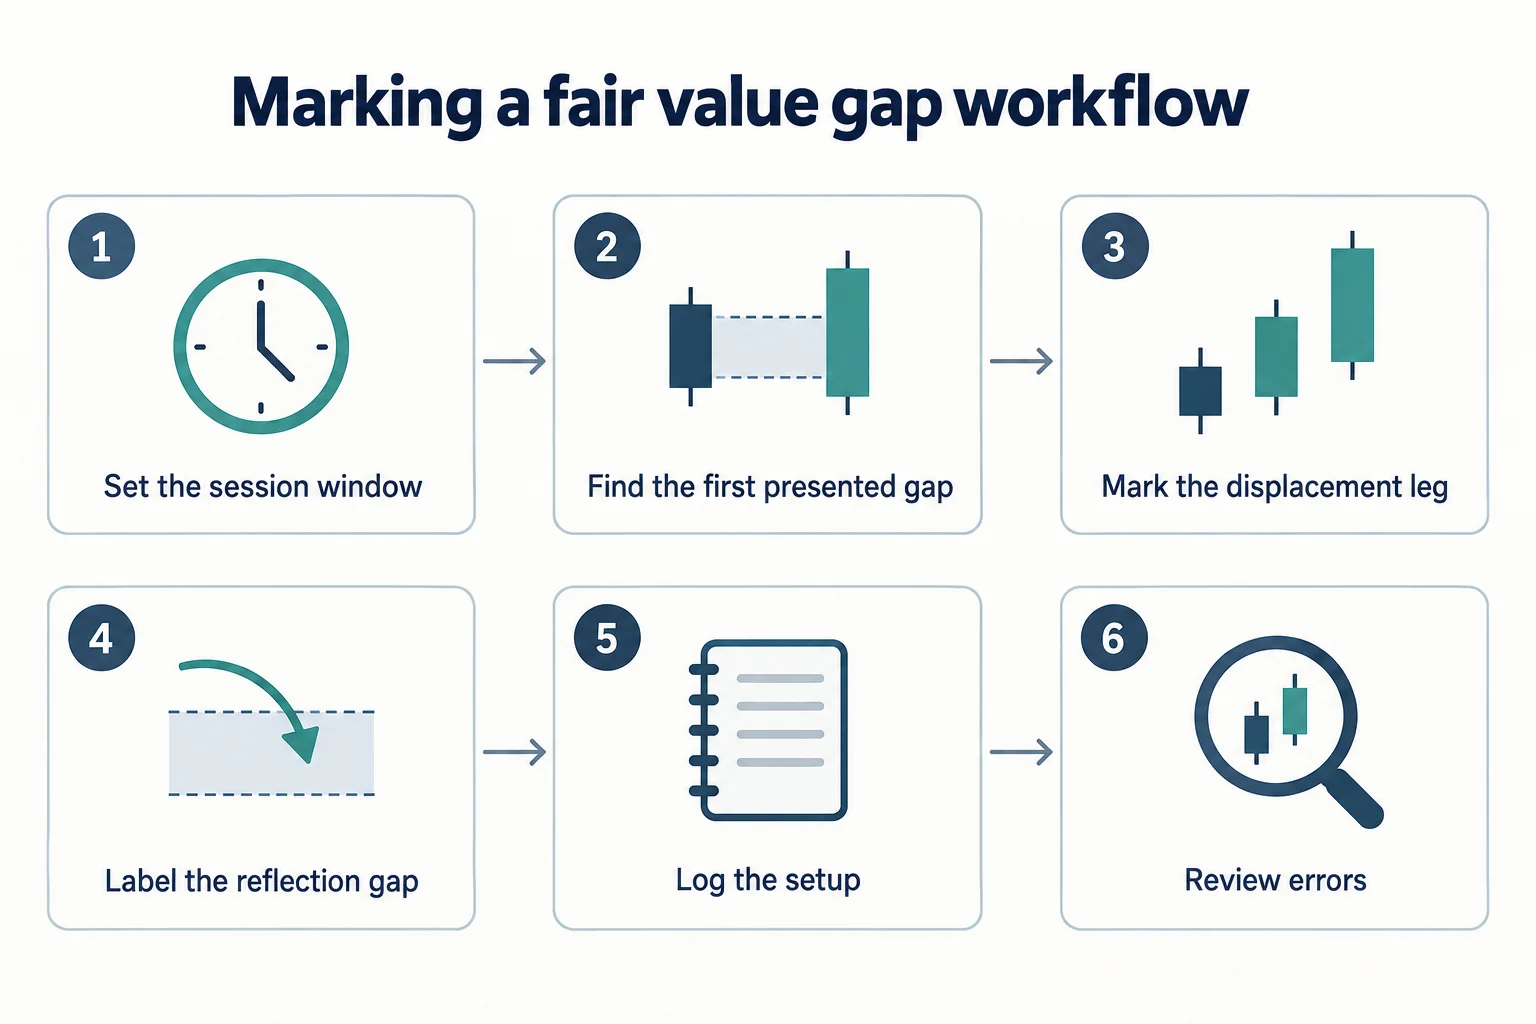
Stripped of the proprietary labels, several study practices in this review are transferable:
- Fix the session start you are using and say it out loud, because a different start can change which gap counts as first.
- Classify the original reference before looking for later ones; the label of the follow-up pattern is derived from it, not assigned independently.
- Separate a timing observation from a structural one, and note when a term is doing work you cannot yet define.
- Write the if-then condition in advance, so a no-trade outcome is still an evaluated outcome rather than a missed one.
- Carry premarket ranges and session highs and lows onto the layout you actually trade from.
- Reduce size when the session’s character is genuinely uncertain, rather than demanding the maximum move from an unclear tape.
- Keep a topical question journal. He recommends topic sections for fair value gaps, opening range gaps, the AM session and the premarket session, and answering questions later (31:43).
He also notes his own position in the material: he says the vocabulary is extensive because he authored it and that students do not need all of it (11:55), and that the work is not easy, in his words, the cost and the tuition (32:34). Readers should weigh that framing as the author’s own view of his framework rather than as a finding about its effectiveness.
Watch the Original ICT Reflection FVG Lesson
This article draws on the timestamped English captions of NQ Futures Review & 1st Presented Reflection FVG, listed in the BestProps source inventory with a date of September 8, 2026. The recording’s own references to the Labor Day holiday and to the prior Friday are consistent with that date. Captions are a source for the speaker’s words, not independent proof of his reported results, and the chart detail in the video remains the only place the annotations themselves can be inspected.
Watch the original lesson on YouTube
This video cannot be played inside another website. When the embedded player for this recording was opened and clicked in a headless Chrome session on 13 September 2026, the player reported “Playback on other websites has been disabled by the video owner” and offered only a “Watch on YouTube” prompt, with no duration or playback progress reported. That is why this article uses a watch card instead of an empty embed; the recording is available directly on YouTube.
Watch NQ Futures Review & 1st Presented Reflection FVG on YouTube ↗
ICT FVG Tools and Further Reading
These references help you mark and test a gap definition on a chart. None of them supplies ICT’s session or classification rule, which has to come from the lesson itself, and none should be treated as an endorsement of the approach described above.
Replay the FVG Before You Know the Outcome
TradingView’s Bar Replay guide describes opening the replay panel, selecting a starting point, and stepping the chart forward one bar at a time.[1] Stepping forward is a straightforward way to apply ICT’s rule honestly, because you have to decide whether a gap qualifies before the following candles exist. Keep the replay and any order tool separate: TradingView states that orders from Paper Trading and other brokers are executed on real-time data while the chart is in replay mode.[1]
Code FVG Rules Only After They Are Clear
TradingView describes Pine Script strategies as scripts that simulate trades on historical and realtime bars for backtesting and forward testing, with a broker emulator filling a strategy’s orders from the available chart data by default.[2] That is a testing system, not a market participant. A coded version of “first presented gap after 9:30” or “first opposing gap” is only as good as the definition you feed it, and simulated fills do not reproduce queue position, partial fills, or slippage on a fast open. Code the rule only after your discretionary marking is consistent, then compare the code’s labels with your own.
An Unofficial ICT FVG Indicator Example
Smart Money Concepts (SMC) by LuxAlgo is an open-source chart-marking indicator that plots order blocks, market-structure labels, premium and discount zones, and fair value gaps as boxes highlighting imbalance areas.[3] This is an independent third-party tool, not an official ICT product, and BestProps has not performance-tested it. Its description also states that these concepts, with or without the indicator, do not guarantee a trader is trading with institutional liquidity and that there is no supporting data regarding the validity of the teachings.[3] A plotted box is not evidence that the label matches the lesson you are studying.
If you trade futures, size for the possibility that the pattern you have labelled is wrong. ICT’s own reduced-size decision in this session is a concrete illustration of that discipline, and it is the part of the video that transfers most directly outside his terminology.