
Key takeaways
In Trading NFP Thursday High Resistance Liquidity Runs, ICT narrates a bearish idea during a non-farm-payroll week: he starts one short contract near the session’s intraday high, places the stop just beyond the high of the new week opening gap, and names relative equal lows as the draw on price.
Read the full summary
In Trading NFP Thursday High Resistance Liquidity Runs, ICT narrates a bearish idea during a non-farm-payroll week: he starts one short contract near the session’s intraday high, places the stop just beyond the high of the new week opening gap, and names relative equal lows as the draw on price. He wants a small imbalance to confirm as an inversion fair value gap — a close below its low, then no candle bodies accepted in its upper half — before he adds or lowers risk. As the move develops he takes partials at a nearer objective rather than demanding the largest target, reports dollar figures for the position (attributed here, not verified), and holds a remaining runner while repeatedly checking that retracements leave no bodies in the upper halves of the imbalances he is watching. He also states that he normally teaches new students to stay out of non-farm-payroll week after 11:00 a.m. Eastern on Wednesday, and explains why he traded anyway. The captions support his stated reasoning and reported activity; they do not establish fills, instrument, net result or the outcome after the recording stops.
How we researched this article
BestProps used document-based research from primary firm sources, checked September 13, 2026. The complete source list, scope, limitations, and commercial-state record appear near the end of this article.
This is a session walkthrough rather than a strategy lesson, and it should be read that way. The only source used here is the video’s automatically generated caption track, so this article paraphrases what the speaker says and reports. Quoted price levels come from those captions and may contain recognition errors. Nothing here is investment advice, and no trade described is a recommendation to copy.
The setup he describes at the open
Within the first seconds ICT says he is looking to go short and wants to give price a chance to trade into the low of a new week opening gap before entering (0:06). His initial stop goes just north of that gap’s high (0:26), so the whole idea is invalidated by price reclaiming the gap he is selling from.
He describes the catalyst as a scheduled employment release that landed at 8:30 and says the market is reacting to what he calls a “bogus number”. He states plainly that he does not trust the employment data or the administration that publishes it, and that he is trading the reaction rather than the figures themselves (0:33). That is his opinion about the data, not a finding established by the recording, and it is worth separating from the mechanical parts of the setup that follow.
His draw on price is a set of relative equal lows. Pointing at candle bodies that sit roughly flush with one another, he says those aligned lows are where sell-side liquidity rests and where he wants price to travel (1:04). He describes selling at the intraday high and adding if price makes one more push up (1:25). The confirmation he wants at that stage is for a small gap to behave like an inversion fair value gap (1:32), and he notes the first position is a single contract (1:50). He also marks the regular trading hours opening range gap around the 9:30 open as another reference (2:05).
Why he says he normally avoids payroll-week Thursday and Friday
At 3:58 ICT explains that he is trading on a day he had said he would not, after a student asked whether his own rule still applied. The rule as he states it: new students should not be participating in trading during non-farm-payroll weeks after 11:00 a.m. Eastern on Wednesday, because Thursday and Friday of those weeks are the most difficult sessions, with what he calls a high degree of manipulation (4:08).
His practical guidance is deliberately pessimistic. If a trader does participate, he says to expect unusual adversity and not to be surprised by it, and he concedes that he can misread these sessions himself. He attributes the difficulty to what he describes as manual intervention and the active participation of market makers — his words are “the real market makers, not dealers” (4:46). Those causal claims are his interpretation, not something the captions can demonstrate, and the demonstration that follows is presented as an exception to his own teaching rather than a reason to trade every employment release.
Confirmation, and what he does with risk
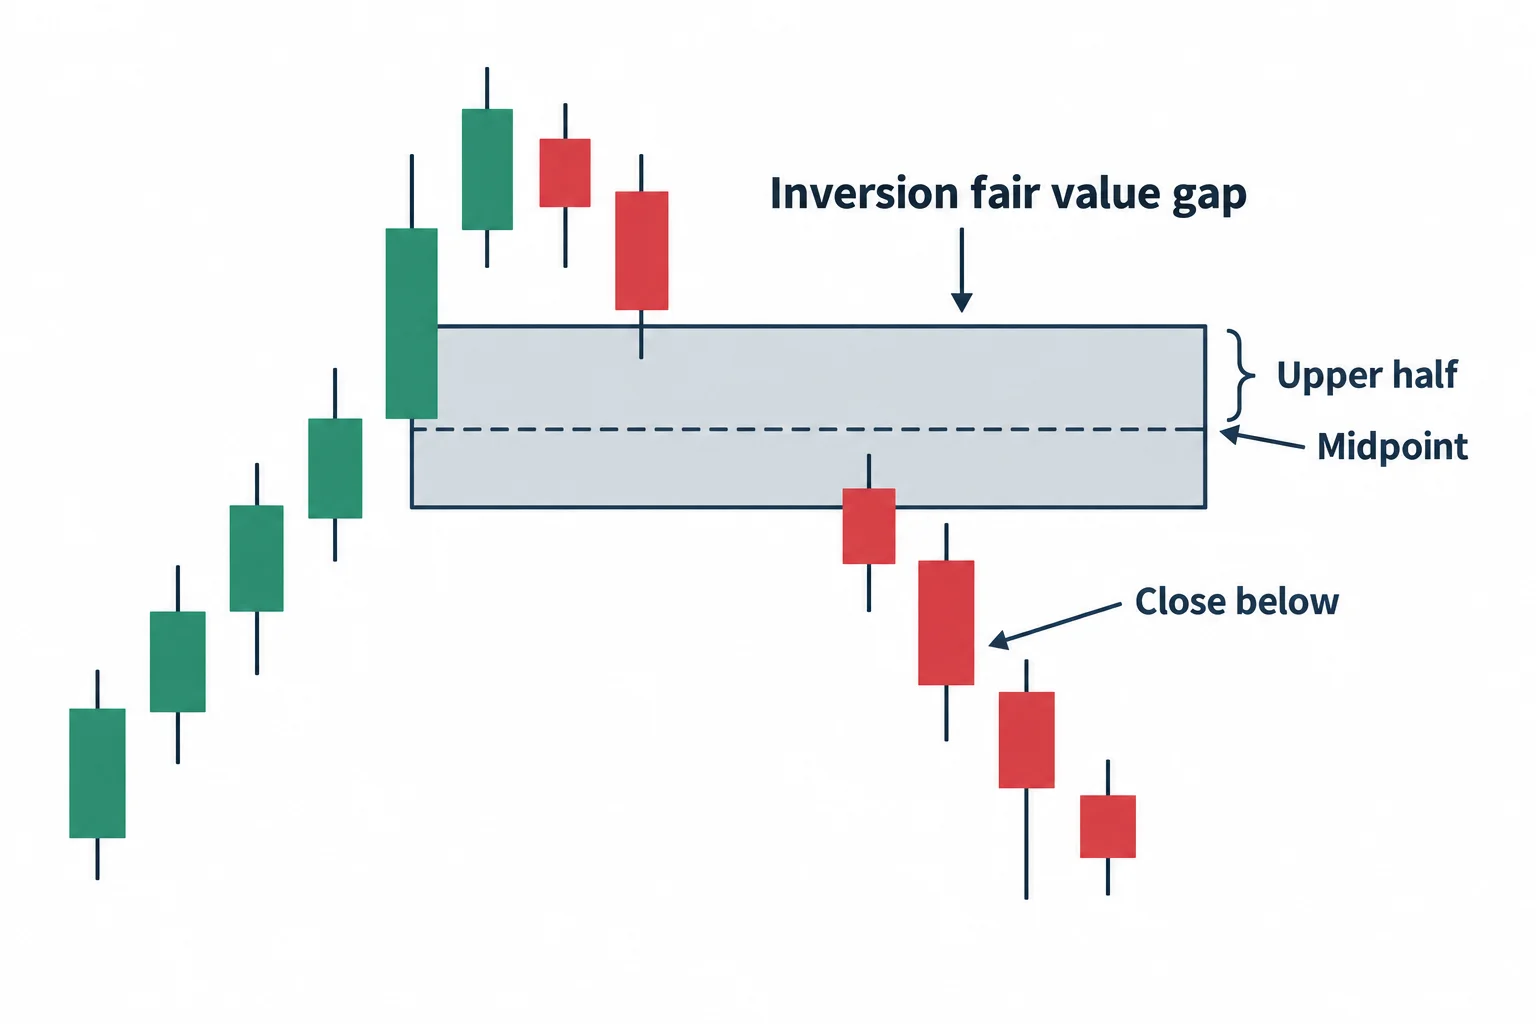
After the initial entry he admits he had not shown where the stop sat and scrolls the chart so viewers can see it, then moves it down to just above the recent high and says he is reducing risk (5:12). He then says he will let it develop and will not build the position any larger (5:28).
The confirmation rule is stated precisely. He wants price to work down and close below the low of the imbalance — a close below 29,292.25, as the captions render it — which he says validates the gap as an inversion fair value gap. After that close, he does not want any candle bodies buried in the upper half of the zone (6:46). Further below, he says a close under the level lets him lower the stop again to a level he states as 29,340 (7:47).
He also takes time to insist the demonstration is live rather than a replay: the cursor is visible, candles count down to their close, and each fluctuation inside a candle prints as it happens — behaviour, he says, that replay does not reproduce (8:10). That is his description of the feed; the captions cannot independently confirm it.
The levels he watches as price works lower
Two geometric references recur. He notes price spiking into what he calls a quadrant level and reacting off it (9:53), and says he wants the close below the imbalance to be decisive — clearing what he calls an octant level rather than closing barely beneath it (10:15). When that lower close arrives he drops the stop to the level he had named (10:50).
From there he layers in older references: half of a fair value gap he dates to Wednesday, August 26, a regular trading hours opening range gap he describes as running between the levels the captions show as 29,249.50 and 29,194.25, a later fair value gap he dates to August 24 around 29,110, and a shaded daily-chart volume imbalance he says he had given in the previous night’s session (11:23, 14:29, 15:12). What he wants through that stretch is the absence of acceptance rather than a specific candle pattern: no bodies left in the upper half of the inefficiency, and no discount sensitivity inside the opening range gap on the way down.
Managing the position: partials, then a runner
His management commentary is the most transferable part of the recording. Once the stop is reduced he states the worst case in dollar terms — a figure of $135, delivered as the amount he would keep going into the Labor Day weekend (11:12). Holding three contracts, he then says he will convert one objective into an exit, buy two contracts back at a nearby low and leave the third as a runner (11:40).
He contrasts the two targets openly. He mentions that holding all three contracts to the further objective could, by his arithmetic, have been worth a much larger figure — he says $15,495 — but says he prefers the lowest-hanging fruit and does not require price to reach the bigger number (12:21). Those dollar amounts are his own statements about his own account; nothing in the captions verifies the positions, the fills or the balance, and the figures should not be read as performance evidence.
The framework he applies while holding
ICT frames the move as an unfolding market maker sell model. He says he sold into what he calls a smart money reversal, added on a lower-risk entry, and now expects first-stage distribution to give way to second-stage redistribution, which he describes as the longest part of the decline (16:27, 19:52). He calls the aligned lows below the market engineered liquidity, and says such levels are built to be trusted before they are eventually broken, his own reading of the tape rather than a documented finding (17:20).
Those labels describe his explanatory model. The captions do not show who placed orders, whether any level was deliberately engineered, or which participants were positioned where. The verifiable content is procedural: he keeps the stop anchored to a structural reference rather than tightening it to the nearest candle, he allows price room to retrace while the narrative holds, and he re-checks the same acceptance questions after each bounce (21:52, 22:12).
Late in the recording he adds to the short once more, stating that if he is wrong the add costs him $535 (25:30). He also notes that retail positioning appears to want higher prices, which he reads as the opposite of what he believes the larger participants are positioned for, and repeats a downside reference of 29,178 at minimum (26:17). He then steps away from the desk and the recording ends with the position still open (27:13).
The “high resistance liquidity run” label and the recording
The lesson is published under the label high resistance liquidity run, alongside its NFP-week Thursday framing. The figure below illustrates how that term is commonly drawn — a path to a liquidity reference that has to negotiate several barrier areas — and is a schematic, not the recording’s chart. The recording itself never uses the phrase high resistance liquidity run, never defines the HRLR or LRLR abbreviations, and never compares the two; what it describes instead is a specific path with specific obstacles: a new week opening gap to sell from, the opening range gap and older fair value gaps sitting underneath, aligned relative equal lows holding sell-side liquidity, and repeated opportunities for retracement. If you are studying the HRLR label from other material, treat the label as terminology layered on top of this session rather than as something the speaker names or tests here.
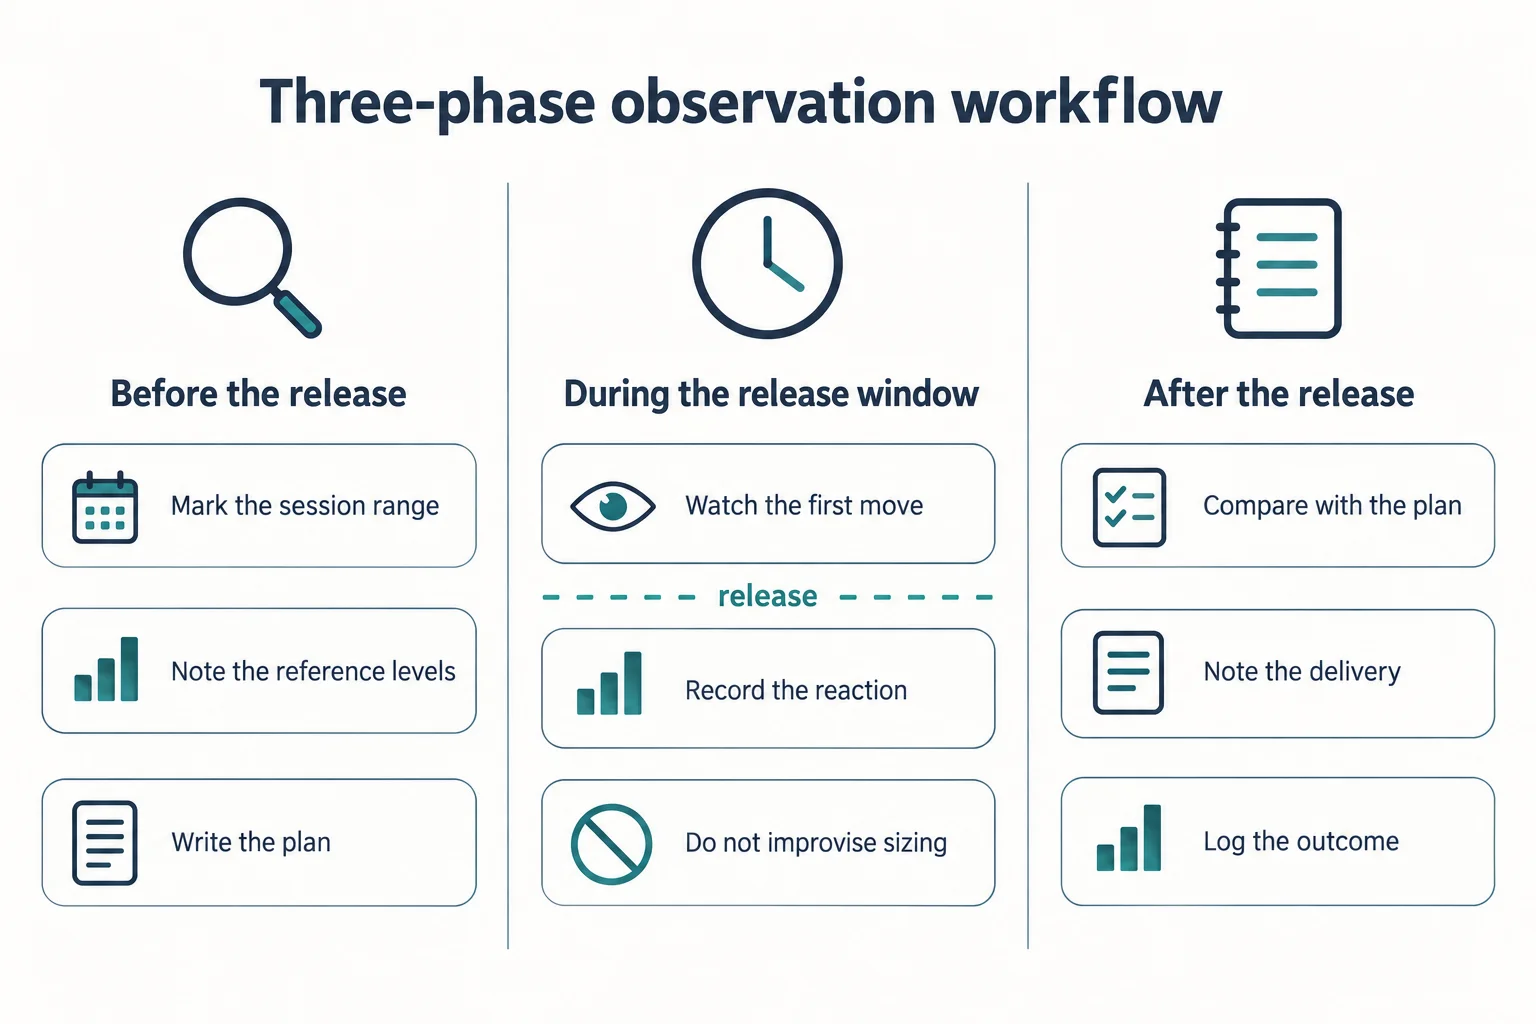
What the recording does and does not establish
Supported by the captions: the setup he describes, the levels he names, his stop and partial decisions, his stated reasons for trading a session he normally avoids, and his instruction that Thursday and Friday of payroll weeks are the hardest days of that week. Also supported: the fact that he was working with three contracts at one point, that he discussed a runner, and that he reported dollar outcomes.
Not established: the instrument or contract month — the recording never names it, and the caption levels sit in the 29,000s — and therefore nothing about how these levels map to any specific product. Not established either: whether the sells were live or simulated, whether the named fills occurred, whether the dollar figures reflect the account, or what happened to the runner after the recording stopped. The captions cannot show why price moved, and ICT’s account of manipulation and engineered liquidity remains his interpretation. Finally, one session cannot demonstrate that a payroll-week Thursday behaves in any particular way; the lesson is a walkthrough of how one trader organised the session, not a tested statistical result.
FAQ
Does the video teach the high resistance liquidity run concept?
Not by that name. The recording discusses structural obstacles to a liquidity objective — an opening range gap, older fair value gaps, a daily volume imbalance and aligned relative equal lows — but it never uses the term high resistance liquidity run and never defines HRLR or LRLR. Those labels come from the lesson’s published title and from ICT terminology generally.
Did the short work?
The transcript cannot settle that. Price did trade lower after the entry, and he narrates partial exits, a reduced stop and an added position, but the recording ends with the runner still open and no statement of a final result. No fills, statements or account records are shown.
What is his rule about trading payroll-week Thursday?
As he states it, new students should not trade in non-farm-payroll weeks after 11:00 a.m. Eastern on Wednesday, because Thursday and Friday of those weeks are the most difficult. He says he expects greater adversity on those days, that he can be wrong on them himself, and that the session shown is an exception made after a student’s question rather than a change of guidance.
Were the dollar figures verified by any statement or record?
No. He states figures for the position at different points, including a worst case if the stop was hit and a larger hypothetical if all three contracts had been held. These are his own reported numbers and the transcript cannot confirm them.
Related ICT video: Trading NFP Thursday High Resistance Liquidity Runs
The mapped source lesson is Trading NFP Thursday High Resistance Liquidity Runs from The Inner Circle Trader. This BestProps article is source-grounded educational commentary on that recording and the reasoning presented in it; it is not an official ICT lesson, not a verbatim transcript, and not evidence that any level described was reached or any position profitable.
Watch the original lesson on YouTube
This video cannot be played inside another website: the embed shows “Playback on other websites has been disabled by the video owner.” That response was read from the player itself, so no player is embedded here. You can watch the full lesson directly on YouTube.
Watch Trading NFP Thursday High Resistance Liquidity Runs on YouTube ↗
Primary sources for release timing, the session, and other scheduled events
The lesson turns on a scheduled employment release and on the sessions either side of a holiday weekend. These references come from the agencies and exchanges that publish that information, and they should be checked before any event week is planned.
Confirm the release time from the agency that publishes it
The Bureau of Labor Statistics schedules the Employment Situation release for the reference month August 2026 on Friday, September 4, 2026 at 8:30 a.m. ET, and the published report states that total nonfarm payroll employment increased by 162,000 in August while the unemployment rate was unchanged at 4.1 percent[1]. The September 2026 report is scheduled for Friday, October 2, 2026, also at 8:30 a.m. ET.
The inventory dates this video September 3, 2026 — the Thursday of that payroll week — and the captions have the speaker reacting to employment data released at 8:30, which is consistent with the payrolls week that ended with the September 4 report, though the captions never state the weekday or name the release. Use the agency’s own schedule rather than a secondary countdown, and read a released figure as published data rather than as a directional signal.
Check whether the session was shortened or closed
Nasdaq Trader publishes the 2026 U.S. equity and options market holiday schedule, listing the Labor Day closure on September 7, 2026 as well as closures such as Thanksgiving Day on November 26, 2026 and 1:00 p.m. early closes on November 27 and December 24, 2026[2]. The speaker refers to going into the Labor Day weekend, so the surrounding sessions were shortened.
An event week that also contains a holiday produces thinner sessions and different reference points, which changes how a level may behave. Nasdaq notes that it continues to send alerts on early-close days, and that this calendar covers the U.S. equity and options markets rather than every instrument.
Look past the payrolls print for other scheduled events
The Federal Reserve states that the FOMC holds eight regularly scheduled meetings during the year, and its 2026 calendar lists meetings including September 15-16, 2026[3].
An employment report is not the only scheduled event that can change how a chart delivers. If a rate decision or another release sits in the same week as the move you are studying, note both dates before attributing the outcome to a single cause.
Sources and primary documentation
- [1] U.S. Bureau of Labor Statistics: Employment Situation Summary (August 2026) and the BLS release schedule
- [2] Nasdaq Trader: U.S. equity and options markets holiday schedule 2026
- [3] Federal Reserve Board: FOMC meeting calendars and information
BestProps is not affiliated with the U.S. Bureau of Labor Statistics, Nasdaq or the Federal Reserve Board, and no source listed here endorses this article, the ICT methodology or any setup. High resistance and low resistance liquidity run are interpretive labels rather than official terminology, and nothing here demonstrates a profitable, repeatable or tested result. Release dates, exchange calendars and account rules change; verify them for the market you actually trade.