
Key takeaways
The Inner Circle Trader reviews NQ futures using a premarket dealing range from seven to nine a.m.
Read the full summary
The Inner Circle Trader reviews NQ futures using a premarket dealing range from seven to nine a.m. Eastern, shortened to eight thirty a.m. when a scheduled report is due then, with trending premarket action implying a block-like AM session and consolidation implying a likely directional move after nine a.m. The range midpoint divides premium at or above 50% from discount at or below 50%, fair value gaps matter only when anchored to key levels, and prior levels remain valid without expiration, with the last three sessions generally providing sufficient context. The new day opening gap is the difference between the five p.m. futures settlement and six p.m. restart, remains extended after an initial touch, and uses consequent encroachment as its midpoint. Friday’s analysis treats the seven to nine a.m. range as consolidation, identifies bearish order flow when wicks reach a gap midpoint but candle bodies cannot, qualifies an inversion fair value gap at the upper quadrant or 0.25 subdivision, and then tracks the first-hour dealing range from nine thirty to ten thirty a.m. ICT sequences Asia, London, New York premarket, AM, first hour, two-hour lunch, PM, and market on close while stressing conditional expectations rather than guarantees. In TradingView replay, bottom replay and paper-trading controls appear, a blue rewind-style replay label is visible, and the price axis lacks the candle-close countdown shown on his claimed live-feed execution charts. He demonstrates a simulated sell limit and take-profit, then issues a $1 million challenge to reproduce his advance calls, but the roughly 34-minute recording does not independently verify chart data, fills, account records, prior executions, profitability, or TradingView authentication.
How we researched this article
BestProps used document-based research from primary firm sources, checked September 24, 2026. The complete source list, scope, limitations, and commercial-state record appear near the end of this article.
The recording titled Friday Review On NQ & PreMarket Session Rules Revisited opens on a Saturday evening, ICT says it is 7:15 p.m. Eastern and the market is closed (0:04–0:17), and reviews the Thursday and Friday sessions of that week on the Nasdaq futures chart. For roughly the first 24 minutes he works through his time-based premarket framework and the corresponding price action; the final portion answers a viewer's request to show the difference between his execution recordings on a live feed and the same chart in TradingView replay mode.
This article is a source-led summary of what ICT says and shows in that video. The framework, the chart readings and the trade references are his interpretations and assertions. The transcript supports what he said and where he said it; it cannot independently confirm chart data, account records, order fills, or results, and nothing here should be read as a tested or profitable method.
Premarket Session Rules for the 7 to 9 Window
From 1:49 ICT restates the rule he has been teaching for weeks: measure the high and low formed between 7:00 and 9:00 a.m. Eastern Time, a two-hour window that he says produces the dealing range used to grade the session that follows. He then adds the exception, at 2:16 he says that when a scheduled report is due at 8:30 a.m., the window ends at 8:30 rather than 9:00. He notes he applied that shortened version around an earlier release and admits on the recording that he cannot remember whether it was CPI or PPI.
At 1:25 he also challenges doubters to find the 7:00–9:00 a.m. rule in any Wyckoff book, asserting the approach is his own. That is his claim about authorship and lineage, not a verified attribution.
Applying the window to Thursday, he identifies the range high on the 7:00 a.m. candle and the range low at 8:36 a.m. Eastern (2:53–3:05). Asked how the market is behaving inside that window, he answers that it is not consolidating but trending, and that price is allowed to protract (3:13).
He then states the conditional half of the rule at 4:28: when the 7:00–9:00 a.m. session is trending, he expects the AM session to be “a block” (up and down rather than directional). He immediately qualifies it, saying that does not mean he cannot trade it, and frames the caution as aimed at newer students rather than as an absolute prohibition.
Friday Session Rules for Consolidation and Sequence
The Friday half of the lesson begins near 11:59. Looking at Friday’s 7:00–9:00 a.m. action, he calls it a square, block-like profile and labels it consolidation in contrast to Thursday’s trend (13:00).
His stated sequencing rule follows at 13:11: if the previous session is in consolidation, the next session is expected to move; the session after that is expected to consolidate, while staying prepared for a trending 24-hour cycle. He names the order as Asia, London, then New York, and subdivides New York into the premarket, the AM session, the first-hour dealing range, a two-hour lunch, the PM session, and the market-on-close or last-hour period (13:50).
At 14:41 he states the point in the form this article follows it: consolidation between 7:00 and 9:00 on Friday tells him trending conditions are the likely outcome in the AM session after the 9:00 a.m. close. The word “likely” matters, he presents a conditional expectation drawn from a pattern he believes repeats, not a guarantee about a specific session.
Later in the review he applies the other side of the sequence. After the morning decline he describes price hammering back into consolidation and going nowhere, coining the term “nothing burger profile” for it (20:43), and says that because it was Friday the market consolidated for the rest of the day (21:52). Those are his chart readings. The transcript alone does not carry the bar data needed to check them.
ICT Session Rules for Premium and Discount
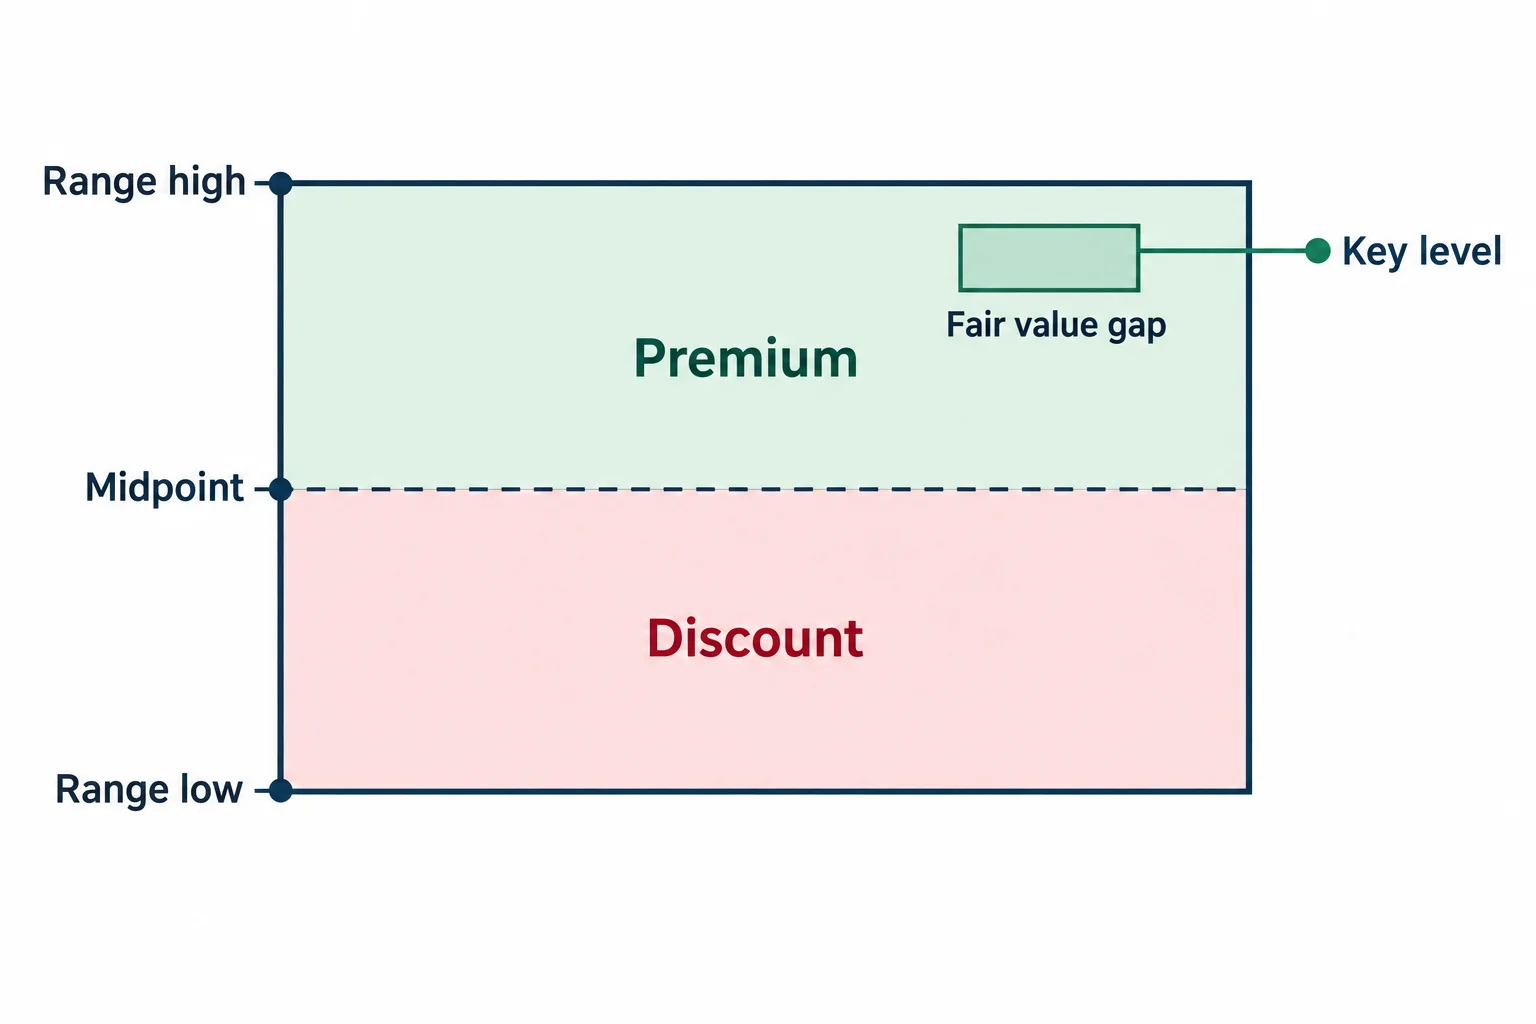
Before grading the range he addresses why some visible gaps are ignored. At 6:13 he points out that he is not discussing the fair value gaps on the screen, because in his words they are not salient, and states that a fair value gap has to be anchored to a key level. The following seconds show a gap he does treat as relevant, sitting in the premium side of the 7:00–9:00 range.
At 6:44 he restates the premium/discount split, keeping the mid-range level in a contrasting colour: at or above the 50% level up to the range high is premium; at or below that level is discount. He attaches the same “Wyckoff doesn’t teach that” claim to this definition.
One caption detail is worth flagging rather than repeating. At approximately 6:00 the automatic captions render a term as “city”; the words that follow in the same sentence are “sell side imbalance buy side inefficiency,” which points to ICT’s SIBI term. The caption is unreliable there, and the rest of this article does not depend on it.
Premarket Session Rules for the New Day Opening Gap
At 7:54 ICT defines the new day opening gap as the difference between the 5:00 p.m. Eastern futures settlement and the 6:00 p.m. restart. He says the level is drawn forward to the right and is not one-and-done: because price may trade to it once and still return, the line stays on the chart (8:48).
He then uses the Asian session as the example. From 10:14 he describes price trading to the gap's consequent encroachment (the gap midpoint) and rallying from it, and says that was a usable reference for anyone watching the midnight opening price rather than a reason to buy a zone. He is explicit at 11:04 that he does not buy and sell zones on the basis that supply and demand is present.
ICT Session Rules for Prior Levels
A question he poses himself at 9:15 is why Thursday's 7:00–9:00 a.m. levels still appear once Friday's trading has technically begun. His answer is that his levels have no expiration date, and that going back over the last three sessions supplies all the context he needs. He adds that a daily chart is not required for that (9:37). The practical consequence is that Friday's lines are not Friday-only lines; they include the prior premarket range and the overnight gap reference.
ICT Friday Review of Bodies Wicks and Bearish Signals
The order-flow portion of the lesson starts around 15:00. ICT marks a swing high and shows candle bodies that stop short of a gap's consequent encroachment while the wicks push above it, a run on relative equal highs, in his description (15:33). Asked whether that is bullish or bearish in the way he teaches order flow, he answers “bearish,” because the bodies cannot grasp the midpoint of the gap even though the wicks can reach it (16:05–16:29).
He then labels a later gap a potential inversion fair value gap (16:54) and explains the qualification at 17:44: the gap is valid for inversion, in his framework, because it sits at the upper quadrant, the 0.25 subdivision of the 7:00–9:00 dealing range. He expects price to rally into that gap and then break lower, and at 19:43 he describes the market trading down to the new day opening gap and later using it as a premium array before dropping.
He also refers back to the August 6 low. At 18:26 he says he had told viewers there was unfinished business at that low and invites them to check a post he made on X at the time. That claim about a prior public call is his own and was not independently verified for this article.
Premarket Session Rules for the First Hour
After the decline, he moves to the range formed from 9:30 to 10:30 a.m. Eastern. At 20:03 he marks the first-hour dealing range, tells viewers to draw it themselves and find its equilibrium, and describes watching for price to get above it and trade up into the new day opening gap. He points to the morning high as the reference for where stops would sit (20:32).
In his retelling, price then reversed back into the 9:30–10:30 range, bumped that high, and settled into the flat afternoon he had described earlier (21:42). He summarises the governing idea at 21:01 as the algorithm referring to time first (his assertion about mechanism, restated rather than demonstrated).
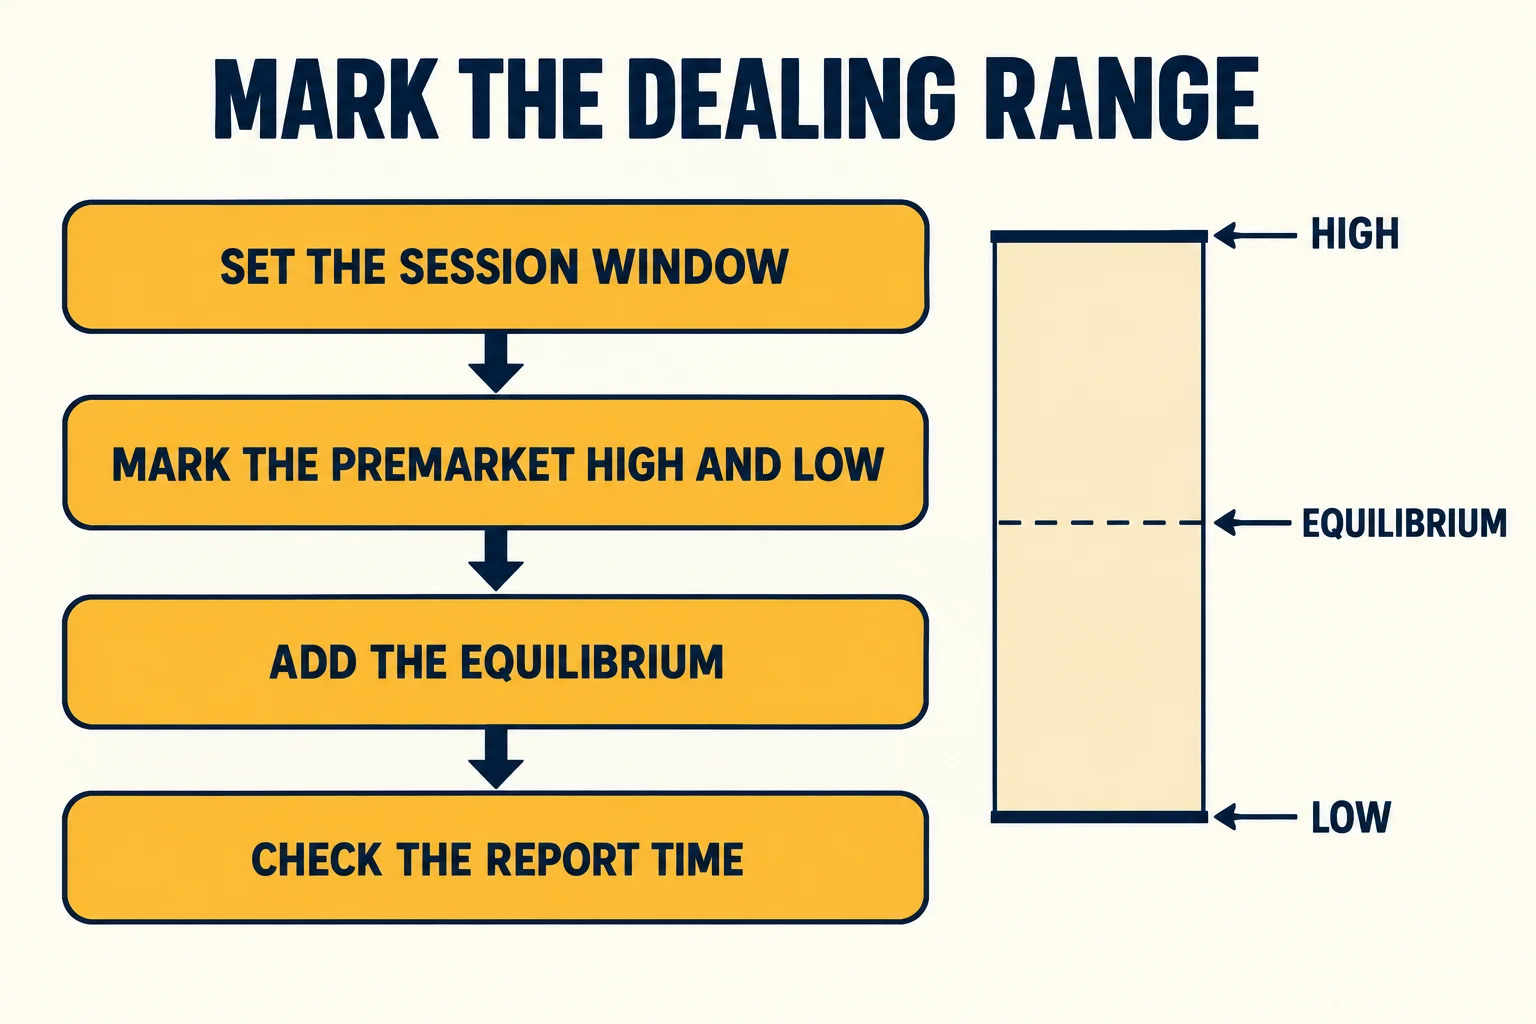
The review can be reduced to a study checklist:
- Mark the applicable 7:00–9:00 a.m. Eastern range, shortening the end to 8:30 when an 8:30 report is scheduled.
- Decide whether the window is trending or consolidating before drawing conclusions about the session after 9:00.
- Grade the range with its midpoint and subdivisions, and treat at-or-above the midpoint as premium and at-or-below as discount.
- Carry forward the prior three sessions’ ranges and the new day opening gap, extending them to the right rather than deleting them after first use.
- Anchor any fair value gap to a key level instead of treating every visible gap as significant.
- Compare the next session against the conditional expectation, and record the exceptions rather than treating the pattern as a forecast.
ICT Session Replay Versus the Live Feed
The opening of the video explains why this section exists. A viewer asked ICT to show the difference between what appears on screen when he records executions on a live market feed and the same chart in market replay, and he says he will cover it in the last few minutes (0:23–0:44).
From 24:31 he demonstrates the interface. On his normal layout, he says, the upper-left shows market status and time to close, and the bottom of the chart does not carry replay controls. Switching to replay, he selects a starting point, points to a label near the top that turns blue with a rewind-style double-arrow icon (hovering it reads “Replay mode, baby” (26:18)) and notes that in replay the price axis no longer shows a countdown to candle close, whereas his execution charts do (29:16).
He also uses replay deliberately to place a simulated sell limit and a take-profit, and lets the replay run to the exit while telling viewers the exercise is a joke aimed at critics and not a live trade (27:28). Paper-trading and replay controls appear at the bottom of the screen as they pop up (25:36), which is consistent with a simulated order rather than a broker fill.
His conclusion is an argument rather than a proof: he says the visible differences show his other recordings were made from a live feed, invites TradingView to come out and state publicly that what viewers are seeing is not market replay (29:39), and offers a million-dollar challenge to anyone who can call the same levels in advance without replay while posting a thread of tweets as the recording renders (32:07–33:37). What the video supports is a side-by-side comparison of the interface states in this recording. It is not independent authentication of earlier executions, fills, account records or performance, and no TradingView endorsement or partnership is stated or implied anywhere in the recording.
ICT Premarket Session Takeaways
The transferable part of the lesson is the process, not the outcome: choose a defined time window, classify what price did inside it, retain the prior-session references, and treat the next session as a conditional expectation to compare against rather than a prediction to trust. The replay-versus-live portion is best read the same way, as a claim about interface evidence, with the underlying account and fill records still unverified.
Watch the ICT Friday Premarket Session Review
The mapped source lesson is Friday Review On NQ & PreMarket Session Rules Revisited from The Inner Circle Trader. This BestProps article is independent educational commentary: it is not a transcript, not an official ICT lesson, and not evidence that any entry, stop, partial, exit or result discussed in the recording occurred.
Watch the original lesson on YouTube
This video cannot be played inside another website: the embed shows “Playback on other websites has been disabled by the video owner.” That response was read from the player itself, so no player is embedded here. You can watch the full lesson directly on YouTube.
Watch Friday Review On NQ & PreMarket Session Rules Revisited on YouTube ↗
ICT Session Sources and Replay Tools
Four references support this article: the source recording, the exchange page that defines the Globex clock, and two TradingView help pages covering the replay and paper-trading tools that appear in the final demonstration.
Check the ICT Recording and Disclosures
The upload titled “Friday Review On NQ & PreMarket Session Rules Revisited” is public, is credited to The Inner Circle Trader, and is the primary source for everything quoted above.[1] The uploaded file runs about 34 minutes and the captions carry the session content; the spoken material is the basis for the claims attributed in this article. What the recording cannot settle is who supplied the chart data, and what the fills were in any account the presenter uses.
Define the Premarket Session Clock
CME Group maintains a Holiday and Trading Hours page for CME Globex that lists trading-hour and holiday schedules in U.S. Central Time unless otherwise stated and notes that the schedules are subject to change.[2] That page is the reference for the 6:00 p.m. Eastern reopen that ICT’s new day opening gap depends on. “Pre-market”, “London” and “regular hours” are only meaningful against a named venue and time zone: a 7:00–9:00 a.m. New York box drawn on a chart left in another time zone will not contain the same candles, and a holiday or half-session changes both the window and the levels inside it.
Replay the Premarket Window Before Judging the Range
TradingView’s help page How do I turn Bar Replay on? documents opening the replay panel, choosing a starting point and advancing bar by bar.[3] Replaying a 7:00–9:00 a.m. window in sequence is the practical test of whether it was consolidating or trending, and whether the high, low and equilibrium levels were usable before the move rather than only in hindsight.
Separate ICT Simulation From Live Execution
TradingView’s paper trading documentation describes a simulator that practices buying and selling with simulated money.[4] It is included because the replay demonstration in the recording uses simulated order controls, and readers comparing replay output with execution recordings should be able to recognise the difference between a simulator and a broker fill.
ICT Sources and Tool Documentation
- [1] YouTube: Friday Review On NQ & PreMarket Session Rules Revisited, The Inner Circle Trader (source recording)
- [2] CME Group: Holiday and Trading Hours (CME Globex)
- [3] TradingView Help: How to turn Bar Replay on?
- [4] TradingView Help: Paper trading, main functionality
BestProps is not affiliated with CME Group, TradingView or The Inner Circle Trader, and no source listed here endorses this article or any setup. Dealing range, premium, discount, equilibrium, consequent encroachment, fair value gap and inversion fair value gap are used only as descriptive study terms, and nothing on this page demonstrates a tested, repeatable or profitable result.