
How we researched this article
BestProps used document-based research from primary firm sources, checked September 14, 2026. The complete source list, scope, limitations, and commercial-state record appear near the end of this article.
In ICT 2026 New York Lunch Algorithmic Theory March 11, 2026, the Inner Circle Trader lays out an idea he says he had not published before: review the previous day’s two-hour New York lunch window, find the point where liquidity was taken as a reversal began, and carry the price inefficiency that formed immediately before that liquidity event into the next trading session. When price returns to that area the following day, he treats the reaction as the basis for a short; he says to invert the logic for a long.
This page summarises that recording from its own audio transcript, with timestamp links so you can check every statement against the source. The transcript supports what the speaker said and how he says he traded. It cannot verify the chart markings, prices, orders, fills or results shown on screen, and it does not establish that the pattern works. ICT’s description of “algorithmic” price delivery is his interpretation of market behaviour, not a documented mechanism, and nothing here is investment advice.
The context he sets before the lesson
He opens by framing the day as a CPI day and by warning against positioning ahead of a scheduled release. His argument is that a data print can produce an initial move and then reverse, which he compares to an FOMC-style two-stage delivery, so waiting for price to develop can remove guesswork. He also names the failure case himself: in a strongly trending session the second stage never arrives and the day runs one way, and anyone not already positioned probably does not participate (00:21–01:18).
He describes the wider environment as range-bound, which he says made the post-CPI move easier to read once price had settled after 10:00 a.m. Eastern (01:13). Later in the recording he returns to that range idea and gives his own explanation for it, which is separate from the pattern and is treated as such below.
The New York lunch window he marks
He tells viewers to review the previous day’s lunch period, a study he says came out of his mentorship. On the chart he points to two vertical lines and calls New York lunch a two-hour window of time, with the lunch close at 1:30 p.m. Eastern; the opening range for the afternoon session then runs from 1:30 p.m. to 2:00 p.m. Eastern (01:41–02:17, 04:52–05:04). He marks the second vertical line at 1:30 p.m. Eastern and refers to a 10:00 a.m. Eastern line as well. The recording states that lunch lasts two hours and where it ends; it does not spell out the clock time the window opens, so treat any start time you see quoted elsewhere as an assumption until it is read off the chart itself.
Where the reference level comes from
His example begins on the prior session. He identifies relative equal highs that were exceeded in the afternoon shortly before the 1:30 p.m. lunch close and calls that a run on buy-side liquidity, adding that the timing is not random (02:17–02:37). Rather than marking the old high as ordinary resistance, he selects the inefficiency that formed immediately before the liquidity was taken.
In his words, that candle is a buy-side imbalance with sell-side inefficiency, and he notes a volume imbalance at its low. He checks it by comparing one candle’s close with the next candle’s open: the transcript gives $25,165.75 as the close, says an open of $25,166.00 or higher would justify annotating a volume imbalance, and gives $25,177.5 as another boundary on the same chart (03:02–04:13). These are the numbers as the automatic transcript renders them, and the chart is needed to confirm how each one is anchored.
Because price was in the middle of the lunch window, he argues that the natural next move was to go and seek liquidity rather than continue higher: he points to sell-side liquidity pools below, to a fair value gap, and to what he calls an inversion fair value gap — an imbalance that was treated one way before price traded through it and the opposite way afterwards. He also uses consequent encroachment, which he defines here as the midpoint of a marked range, and says a pair of gaps nesting together is what produced the following session’s sharp move (05:04–05:47, 12:29–12:43). The text you see above depends on an automatic transcript, which renders these terms inconsistently — “inversion fair value gap” appears in places as “inversion fair bag up”. Read them as one informal vocabulary for describing imbalance areas rather than as standardised market definitions.
The rule he states
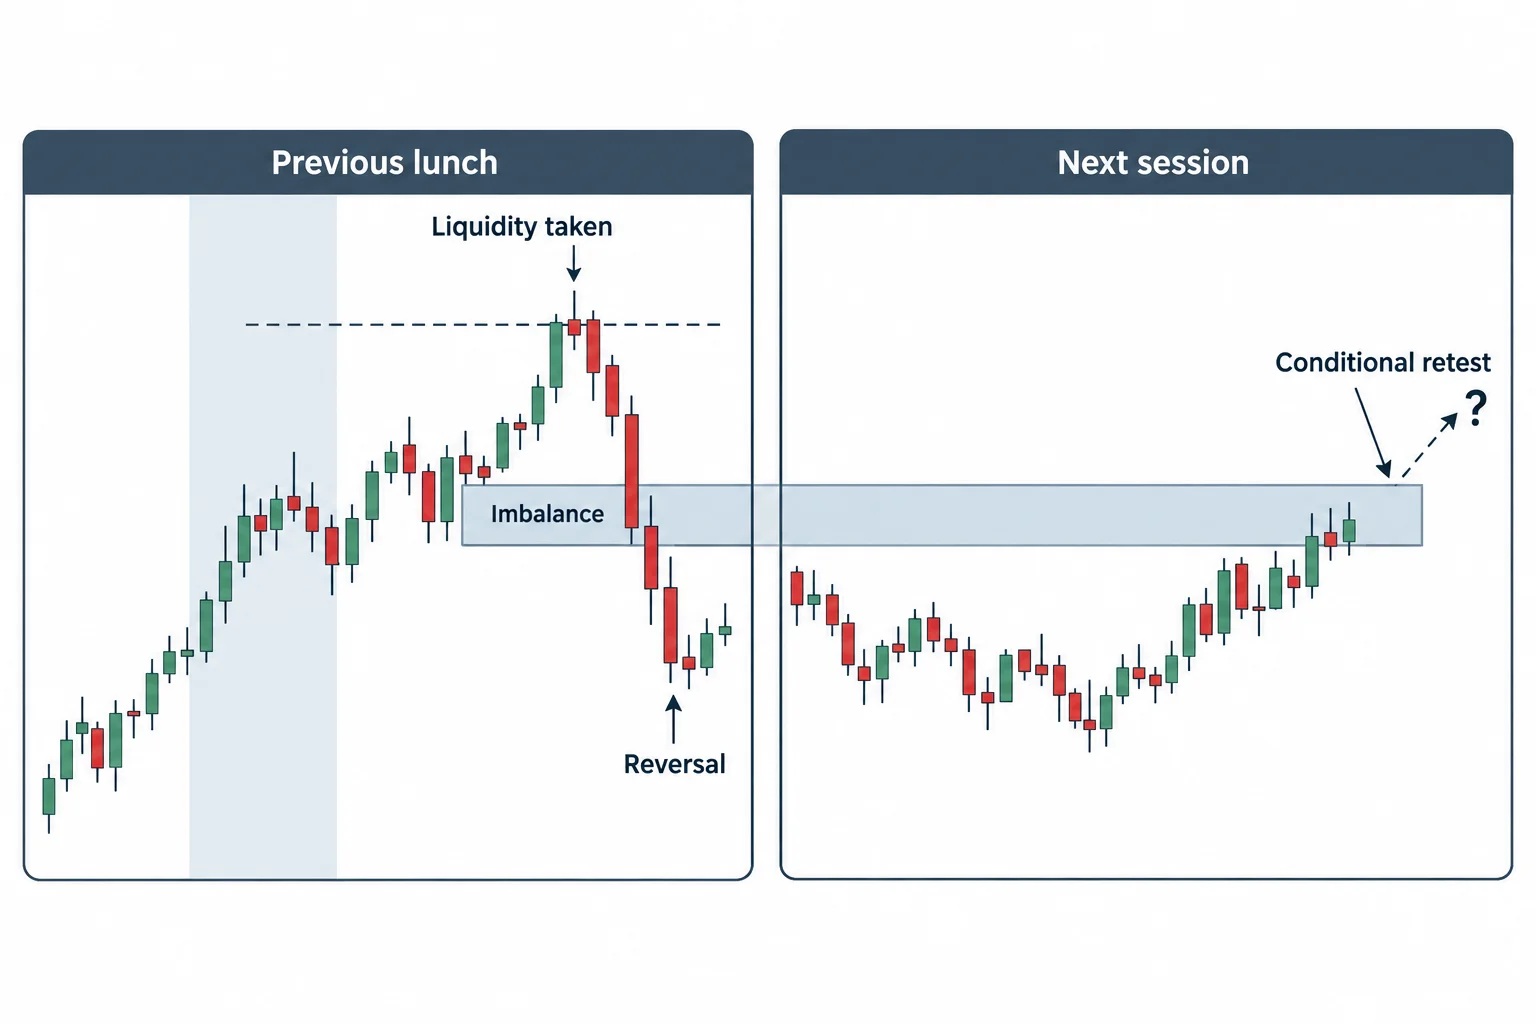
He says the request for a new “PD array” came from a charter member during a Trader Roundup session, that he had promised to release two during the year, and that this is one of them. He then states the pattern directly (09:57–10:37):
- Use the previous day’s two-hour New York lunch window.
- If there was a reversal after liquidity was taken, take the inefficiency that formed right before the liquidity was taken.
- Carry that area forward into the next day.
- If price trades up into it, he treats it as setting the tone for a shorting opportunity.
- Reverse the logic for a long.
He stresses that the reference is the imbalance tied to the liquidity event, and that the sequence — approach, liquidity taken, imbalance beforehand, reversal inside a time window where he expects reversals — is what gives it meaning (19:26–20:07). The transcript is not clear on whether he is pointing at the candle immediately before the highlighted one or that same candle, so the exact candle should be confirmed on the chart rather than inferred from the wording.
How the next session unfolded in his narration
Moving forward in time, he notes CPI at 8:30 a.m., which he calls “kind of wonky”, and says he told viewers to watch $24,892 on the sell side and to monitor the prior regular-trading-hours opening range gap. He says he did not annotate the current day’s opening range and did not need to, because the previous day’s gap was sufficient (07:48–09:04, 10:44–11:10).
From there, his account is that price ran up into the inefficiency carried over from the previous lunch, stopped near the plan level, dipped just outside it and then sold off. He calls that combination a complex reversal and describes the sequence as a “Turtle Soup” scenario because the level sat above a prior high (08:48–09:05, 12:43–13:05). He explains that he was working from a lower-timeframe version of the model anchored to sub-minute candles, and that anchoring to the one-minute candle highs and lows instead would have produced the same area (13:05–13:27).
He also explains why he does not treat this as conventional support and resistance: he says he is looking for the specific area the algorithm will return to reprice, and that everything else is the aftermath (20:08–20:35).
Event Horizon and what he says about managing the trade
He introduces “Event Horizon” as the 50% level between two pools of liquidity. In the demonstration he anchors one end at 892.5 and drags to 54.25 — 24,892.50 and 24,854.25 on the index chart — and configures the tool to display only the midpoint (15:27–16:04). He presents the concept as something not covered in the material he learned from.
He then describes what he says he intended to do with a live position: keep the stop above the prior high, let price attempt the next liquidity pool, then roll the stop above that pool, and treat a result in the vicinity of 24,892.50 as good enough. He says an unscheduled errand forced him to close early, and that he posted a video of the exit on X rather than have the position run unmanaged (16:04–17:14).
All of that is his own account. The transcript cannot confirm the orders, the fills, the account type used in each example, the risk taken or what the chart actually showed at each moment, and no statement here should be read as a verified result.
His stated executions, in his own framing
He says he sold into the fair value gap on the way down, on the down-close candle, and that he added to the position when price traded back up into the area, describing the entry as having no adverse excursion. He reports taking one of only two contracts he was using and explains the small size as a teaching choice for viewers with limited capital, noting that one micro contract is $2 per point and that a second can be added once someone can afford it (20:35–21:14, 22:00–22:30).
He says the market eventually traded just below the $24,892.50 liquidity pool, reaching 24,892.00, which he calls technically below the low, and that he wanted to see Event Horizon between the next pools instead; he acknowledges he had already closed the position and was not able to take the later move (22:30–23:07). He also repeats that he is not recommending that viewers copy the trades and that he is showing the reasoning rather than inviting imitation (09:05–09:22). His stated history of calling highs and lows across different accounts is likewise a claim made in the recording, not something the audio can verify.
The market view he adds afterwards
Near the end he gives the interpretation behind his range expectation, and it is explicitly speculative. He says a large amount of put-option positioning on stocks and stock index futures is holding the market inside its daily range, and he uses a story about rigged riverboat roulette wheels to argue that a market will move against the majority. He adds that he does not expect the range to loosen until option expiration and triple witching have passed, that he believes a larger decline will come eventually, that he would rather hunt shorts than longs, and that he is watching silver without being positioned in it (23:38–26:20, 26:47–27:08).
None of that is supported by the recording itself. Options positioning figures, the effect of expiry, and the direction of any future move are the speaker’s opinions about markets, not verified data, and they are worth separating from the mechanical part of the lesson.
How to study a session-window pattern like this
The practical value of the recording is as a defined observation exercise. The same checking steps that would be used on any session-based idea apply here, and the schematic below lists them in the order they can be applied while reviewing a recording.
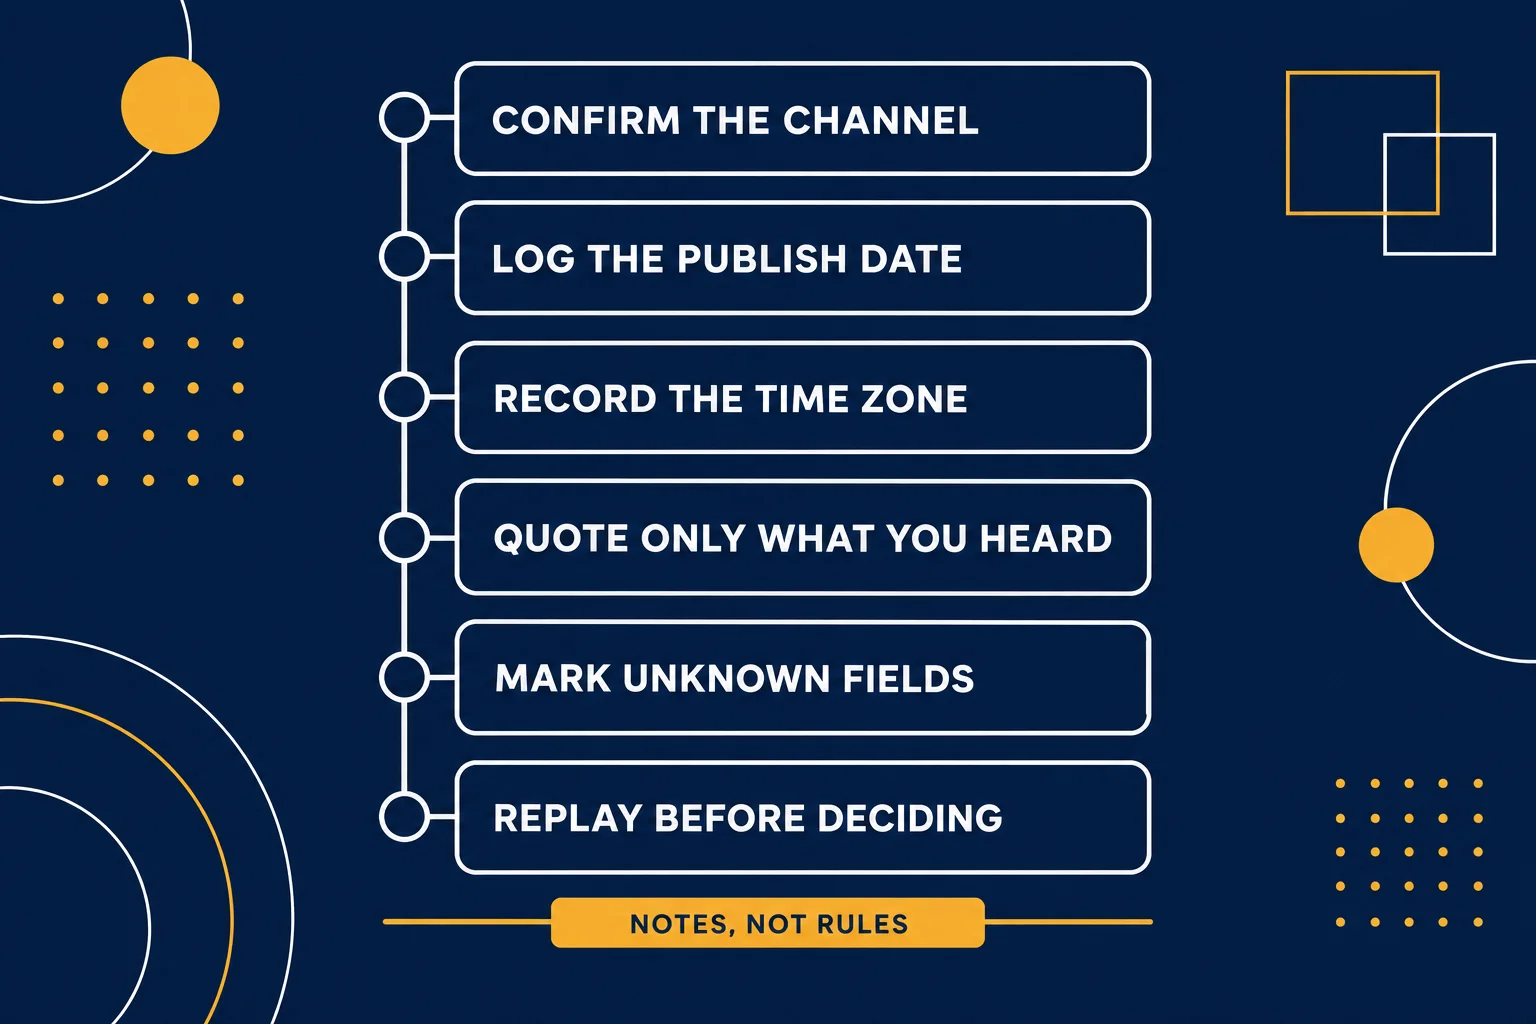
Applied to this recording, those steps mean: work from the channel’s own upload rather than a re-upload or clip; date it from the page rather than the search result; record the time zone your chart is set to, since every window in the lesson is stated in Eastern Time; quote only wording you have heard in the recording, because the automatic transcript misrenders several ICT terms; mark the fields the recording does not settle, such as the exact clock time the lunch window opens; and replay the examples before drawing any conclusion.
A study log is more useful than an opinion here. Mark the stated lunch window on your own chart, record whether liquidity was exceeded, identify the preceding imbalance under one consistent definition, and then record what price actually did when it returned to that area the next session. Cases that fail to return, that trend straight through the level, or that cannot be marked consistently matter as much as apparent matches. The recording supplies no hit rate, no sample size and no independent testing, so it should not be read as evidence of a repeatable edge.
What the transcript leaves open
- The exact clock time the two-hour lunch window starts is not stated; only its end at 1:30 p.m. Eastern and the 1:30–2:00 p.m. afternoon opening range are given.
- Several terms and figures arrive through automatic speech recognition, including the imbalance vocabulary and the price levels. One example: the transcript gives $25,177.5 as a candle low and $25,165.75 as a close on the same chart, which cannot both belong to a single candle, so the source audio and chart are needed to settle the readings.
- Whether the chosen imbalance is the candle immediately before the liquidity event or one candle earlier is not resolved by the wording.
- Executions, stop placement, position size and outcomes are the speaker’s recollections of a session already recorded, not audited records.
- The claim that the move is algorithmic, and the options-positioning explanation for the range, are interpretations that this source neither proves nor tests.
Watch the recording
The mapped source for this article is ICT 2026 New York Lunch Algorithmic Theory March 11, 2026, published on the channel The Inner Circle Trader on 11 March 2026, with a runtime of about 27 minutes 40 seconds. It is a public, first-party upload and it is the only source used for the claims attributed above.
Watch the original recording on YouTube
This recording cannot be played inside another website. A fresh test from a BestProps page on 14 September 2026 loaded the embed and tried to start it; the player itself reported “Video player configuration error” with error code 153, offered only a link to watch the recording on YouTube, showed no play button and reported no duration or playback progress. No player is reserved here and no embed has been left blank as a result. The recording is available directly on YouTube.
Watch ICT 2026 New York Lunch Algorithmic Theory March 11, 2026 on YouTube ↗
Primary source and supporting references
- The original Inner Circle Trader recording: the only source for the lesson described above; use the timestamp links in this article to compare each statement with the audio.
- NYSE: Holidays & Trading Hours: the exchange operator’s session schedule, which lists a core trading session of 9:30 a.m. to 4:00 p.m. Eastern Time and states that its times are Eastern. Useful for converting the clock references in the lesson, though it describes NYSE-listed equities rather than index futures.
- TradingView Help: Trading Sessions: platform documentation explaining that session boxes cover the bars that opened inside a session in a chosen time zone, that up to three sessions can be customised, and that the indicator works only on intraday timeframes.
- U.S. Bureau of Labor Statistics: Consumer Price Index: the official source for the CPI releases the lesson is built around; at the time of writing the page scheduled the August 2026 CPI release for 11 September 2026 at 8:30 a.m. Eastern Time, the same clock time the speaker refers to in the recording.
BestProps is not affiliated with The Inner Circle Trader, the New York Stock Exchange, TradingView or the Bureau of Labor Statistics, and none of them endorses this page. New York lunch, algorithmic theory, PD array, event horizon and related terms are used here only as descriptive study vocabulary in the sense the recording uses them; none is presented as official, standardised or independently tested. This article paraphrases a recording that was transcribed automatically, without visual verification of any chart, and reports the speaker’s own statements about his trades rather than verified results. It is educational commentary, not investment advice, and no trading approach can guarantee a profit or the completion of a prop-firm evaluation.