
Key takeaways
In this May 12, 2025 NASDAQ review, ICT works through a daily bullish premise, the way he marks the week’s first qualifying fair value gap, and the sequence he calls the Venom model: a sweep below a short-term low, a candle that leaves that low on one pass higher, and a deferred entry with risk…
Read the full summary
In this May 12, 2025 NASDAQ review, ICT works through a daily bullish premise, the way he marks the week’s first qualifying fair value gap, and the sequence he calls the Venom model: a sweep below a short-term low, a candle that leaves that low on one pass higher, and a deferred entry with risk below the swept candle. His narration refers to both opening and closing prices; the exact candle boundary cannot be reconciled from the transcript alone. He also spends a large part of the lesson on patience inside a 17-candle consolidation and on stepping up time frames when the lower chart stops being informative.[1]
How we researched this article
BestProps used document-based research from primary firm sources, checked September 24, 2026. The complete source list, scope, limitations, and commercial-state record appear near the end of this article.
This review is written from the transcript of the mapped recording, 2025 Lecture Series – ICT Venom Example May 12, 2025, on the channel The Inner Circle Trader. The audio was transcribed automatically rather than by hand, so wording is paraphrased and recognition-sensitive terms are flagged at the end. Every interpretation below is attributed to ICT as his own reading of the chart; nothing here treats the model as verified, and no price, level, fill or result is invented.[1]
The daily premise he starts from
ICT opens with a daily-chart review. He says his bullish stance depended on price holding above a marked daily fair value gap without closing below it, and he names the March 26, 2025 high as the near-term draw. See 0:09 and 0:16.[1]
He then refers to weekend news that he links to an agreement between China and the Trump administration, describing it as received well but not a resolution, and to the premium opening that followed. His stated reaction to that kind of open is the opposite of chasing: he says you always look for a discount rather than buying straight into strength at 0:36. He notes that price opened below the March 26 high, so that level stayed a candidate to draw into, while saying he did not expect much of the gap between Friday’s settlement and Monday’s regular-session open to close first, at 0:47 and 0:57.[1]
The next level he watches
ICT next discusses a bearish order block and a gap between the candle low and candle high he points to, and he colours it deliberately so he can watch whether price trades above it and then returns into it, which is the behaviour he would treat as an inversion fair value gap, at 1:23. In his words, if that behaviour appears he would expect the highs to be tackled at 1:25, while adding that things can spin out from left field at any moment, so the expectation is conditional rather than certain.[1]
Gap risk and why he says setups get less frequent
From 1:47 ICT defines gap risk as the difference between where the market settled and where it opens next. He argues that large gaps are often the mechanism that completes a move before the intraday session gets going, which means a trader has to be more selective and can expect the frequency of setups to slow down, while still staying nimble about what is available intraday. That is his explanation of the day’s conditions rather than a general rule, and the transcript supplies no measurement of setup frequency.[1]
The first qualifying fair value gap of the week
On the one-minute chart he marks the drop that follows the open and refers to 9:31 as the required starting point while identifying the gap, so he treats it as the week’s first presented fair value gap at 2:57. He extends it to the right, borders it, and says it should be used every time price returns to it until the final hour or final 30 minutes of Friday trading at 3:27. The exact wording the transcript produces for this concept is unclear, and is flagged in the review notes below; the useful point is his practice of retaining the marked Monday reference through the week.[1]
The session he reviews, in his narration
ICT describes an evening gap opening, a push higher into the London open at 3 a.m., then consolidation and a decline that he ties to the 9:30 a.m. New York open, at 4:01 and 4:17. According to his account, the decline made a short-term low, price returned toward the opening fair value-gap reference, and a subsequent sell-off took sell-side liquidity at 4:39. Because his daily premise was still bullish, he read the sell-side sweep as a move into discount rather than as a reason to flip bearish, and he ties that logic to expecting a discount-to-premium delivery at 5:19.[1]
How he defines the Venom setup in this example
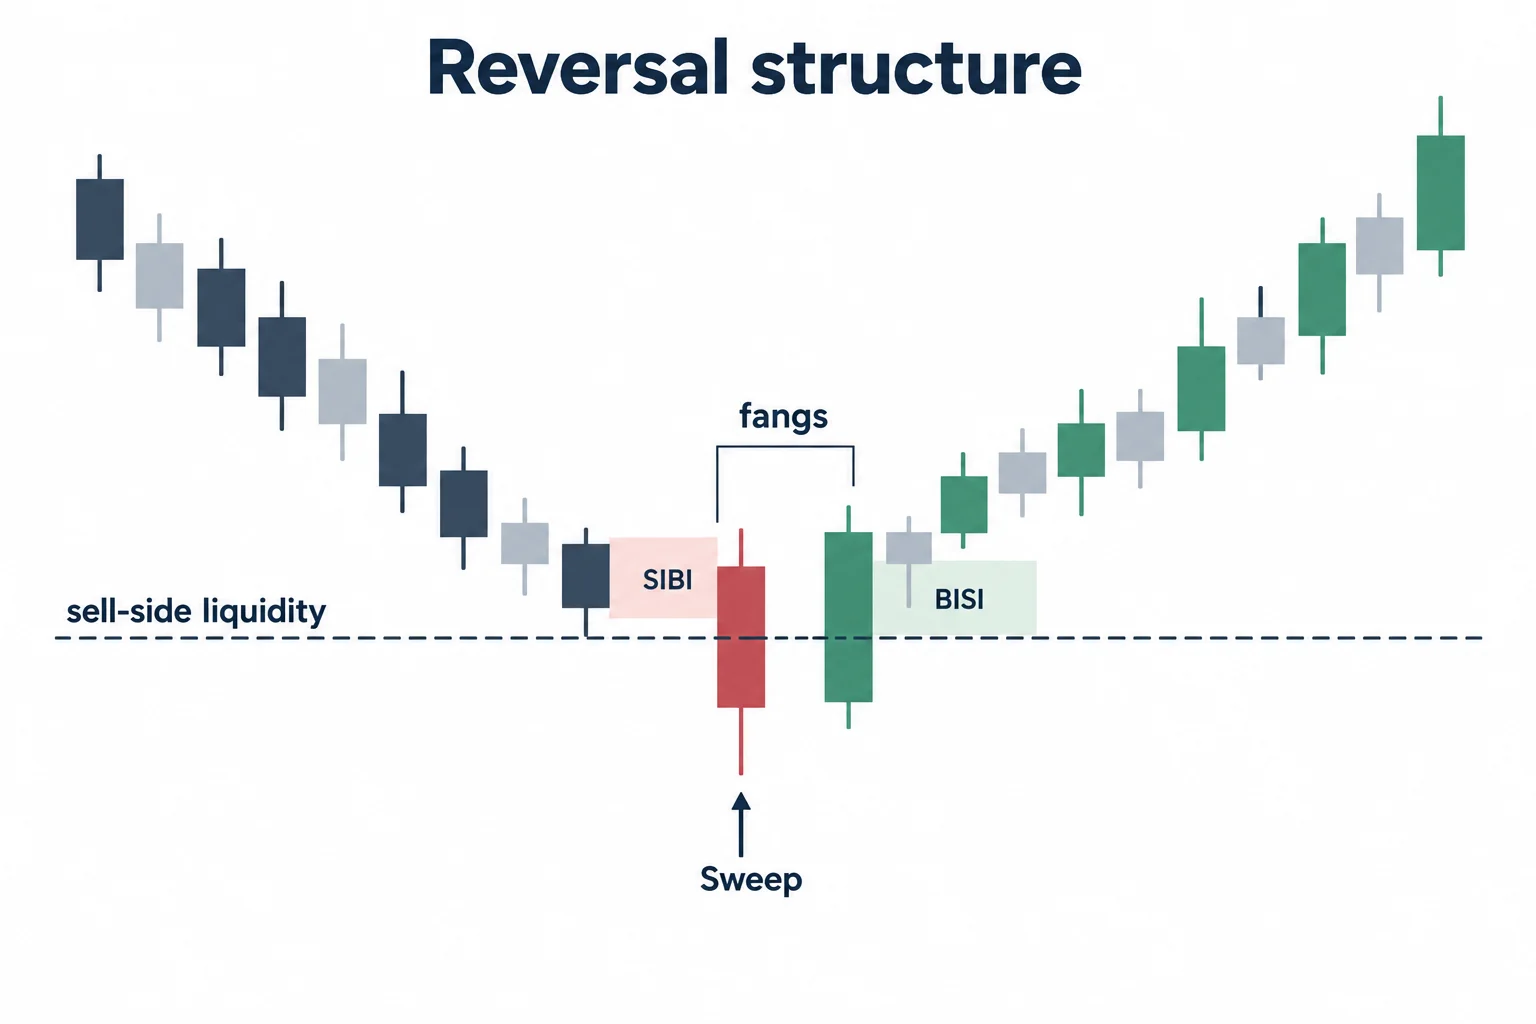
The worked example starts at 4:58 on the five-minute chart. ICT points to a low, says price stabbed briefly beneath it to take sell-side liquidity, and calls that run the catalyst at 5:50. He then checks his conditions: a single candle running below the liquidity pool, and a candle that leaves that low and travels back higher in one pass, with a sell-off of at least one candle below the level before the reversal at 6:13.[1]
The sequence he requires is that an imbalance at the low is followed by the bullish imbalance that carries price away from it; the transcript renders those two as SIBI and BISI without expanding them. He uses the word fangs for the candles that frame the reversal and sets the entry rule plainly at 6:45: a buyer has to be a buyer at that candle’s opening price or below. Later he uses different wording, saying the entry must be below the second candle’s closing price, at 10:54, and repeats that the model is framed on the five-minute chart so the stop can sit below the swept candle’s low at 10:30. The opening-price reference at 6:45 and closing-price references at 8:25 and 10:57 should not be treated as an identical candle boundary without examining the chart. This transcript review cannot establish that boundary and does not supply an actionable entry price. In his description price drops, takes the sell stops below the low, and then breaks higher at 10:47.[1]
Time distortion and when he moves up a time frame
A large part of the example is about waiting. From 7:00 he counts 17 candles of sideways movement lasting over an hour and calls it time distortion, arguing that this kind of range wears traders out because it never looks like an obvious long or short, and that the response is to commit to defined conditions rather than to react to the chop. His guidance at 9:45 is to toggle up a time frame or two when price goes sideways, describing a hierarchy that runs from one minute to five, then 15, then 30 or 60 minutes, and on to four-hour and daily charts when more context is needed.[1]
The alternative entry he offers
For anyone not using that entry, ICT presents a second way to read the same session starting at 11:44: mark the inversion fair value gap, wait for price to leave the consolidation and prove it is moving higher, and treat the return into that area as confirmation. He is explicit at 12:57 that trading above the high is not a breakout trade in his framework; it is evidence that the downside work has been done. He then reads the candle bodies rather than the wicks, arguing at 13:41 that bodies holding in the upper half show price is not accepting the lower half, and pointing out that price did not return to the consequent encroachment level at 14:20.[1]
He also distinguishes his framework from supply-and-demand explanations: he attributes the behaviour to institutional order flow and his own price-delivery arrays rather than to supply and demand, and he claims the rules did not exist before he presented them. That is an attributed claim by the speaker, not an established fact about how markets work, and the transcript does not independently establish the institutional interpretation or the claim of precedence.[1]
What he says about managing the reported trade
He describes the entry as being inside a specific candle’s close or lower at 8:25, with risk placed below the swept candle’s low at 7:57, and he says he exited into the candle that poked above the high he was aiming at, at 8:34. He also describes using the volume imbalance as an alternative trigger and targeting relative equal highs into the afternoon session at 14:29, and he frames the whole approach as a deferred entry: rather than being positioned where the stop run happens, you wait for the market to deliver the setup on his terms, at 15:33. He compares it to a turtle soup long or short, the failed-breakout entry the surrounding sentence describes.[1]
The reported execution cannot be independently checked from the transcript. The transcript contains his retrospective narration of an entry and an exit but no verifiable fills, size, commissions or account result, and no chart was inspected for this article, so the trade remains a reported example rather than a documented outcome. The recording’s own description also labels the displayed trading performance hypothetical; it must not be read as verified real-money profitability.[1]
How this May 12 example relates to the April 3 tutorial
The channel also shared a separate, earlier lesson titled Venom Model Tutorial, dated April 3, 2025 in its title, through its own post on X. The May 12 recording is a worked example of that model on a specific session, distinct from that earlier tutorial, and the two should not be blended: rules stated in an example should not be promoted to a universal definition of the model without checking the tutorial. The post title alone does not establish when the model was first introduced. The recording itself points viewers to the channel’s dedicated Venom example material at 15:18.[2]
Study points worth taking from the session
- Separate a higher-time-frame bias from the intraday trigger that is supposed to justify acting on it.
- Decide in advance what a sweep below a low would have to do to qualify as the catalyst, rather than deciding after the fact.
- Fix the entry boundary and the invalidation from the source candles themselves instead of improvising a stop.
- Budget for long stretches of sideways price, and step up a time frame when the working chart stops being informative.
- Keep the source wording, what is actually visible, your own interpretation and any open question apart when you write the session up.
He adds one deliberate exercise at 16:05: find the first qualifying fair value gap inside the 1:30 to 2:00 p.m. Eastern window, extend it forward, and study how the afternoon session interacts with it. He says openly that he is not showing everything, and that the point is for a viewer to work the same window on their own charts.[1]
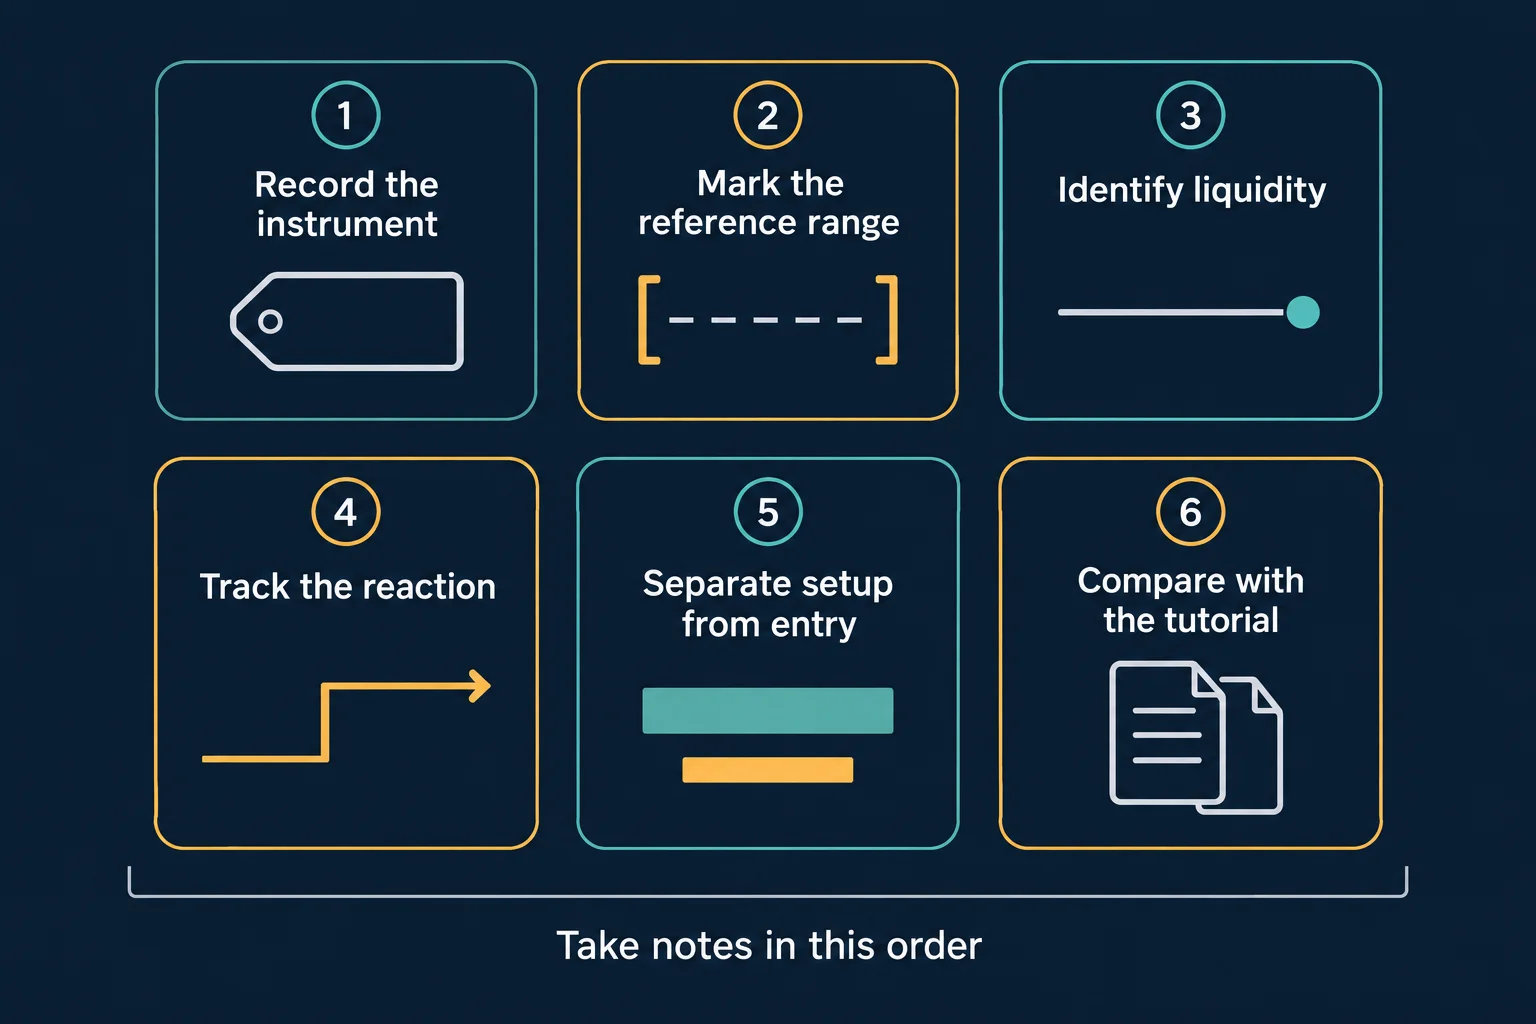
The schematic below is a generic order for taking notes from a recorded worked example; it is not derived from the lecture’s charts and does not claim to be ICT’s own note structure.
Related source video: 2025 Lecture Series – ICT Venom Example May 12, 2025
The recording mapped to this article is 2025 Lecture Series – ICT Venom Example May 12, 2025, on the channel The Inner Circle Trader. Its watch page reports a publish and upload time of 2025-05-12 and a runtime of 1,033 seconds, and the audio transcribed for this article runs 1,032.8 seconds, so the audio source covers the full recording. The session date the lesson discusses is May 12, 2025, which was a Monday; the upload instant falls late on that same Pacific-time day, so the title date and the upload date agree.[1]
Watch the original lesson on YouTube
The video cannot be played inside another website: when its embedded player was opened from a BestProps page origin and clicked on 14 September 2026, the player itself reported “Playback on other websites has been disabled by the video owner.” That message is why this article shows a watch card instead of an embed; the recording remains available directly on YouTube.[1]
Watch 2025 Lecture Series – ICT Venom Example May 12, 2025 on YouTube ↗
Review notes: what is verified and what is not
Source. The mapped recording is a public, first-party upload whose saved watch-page evidence reports the exact title, a 2025-05-12 publish and upload time and a 1,033-second runtime. The audio transcribed for this article was downloaded in full and decoded at 1,032.8 seconds, matching that runtime, so the source is complete and correctly identified.[1]
Transcript. The transcript is automatic speech recognition, not hand-made captions, and no chart or screen content was inspected at any point. Terms the recording uses but the transcript does not resolve are deliberately not presented as definitions: the repeated name for the week’s first qualifying gap, the expansions of SIBI and BISI, one garbled price reading near the open, a garbled reference to an intraday macro window, the relationship between opening-price and closing-price entry references, and the wording used for the decline into the United States open session. The phrase rendered as “turtle suit” was read as the well-known turtle soup term because the surrounding sentence is about a deferred entry on a failed breakout, and that normalisation is disclosed here rather than hidden.[1]
What stays open. The transcript cannot verify chart coordinates, the exact instrument contract, the chart’s time zone, order fills, position size, slippage or the outcome of the described trade, and none of those is asserted above. The claim that these rules did not exist before ICT presented them is recorded as his statement. Nothing here is investment advice, and a narrated example is not evidence that the model produces repeatable results.[1]
Sources
Four references support this article: the first-party recording it is grounded in, the channel’s own post for the separate April 3 tutorial, and two third-party TradingView scripts that describe Venom as the community has coded it.
- [1] The Inner Circle Trader – “2025 Lecture Series – ICT Venom Example May 12, 2025” (first-party recording, the primary source for the session review; watch page read 2026-09-13, link checked 2026-09-14). Its page metadata reported title “2025 Lecture Series – ICT Venom Example May 12, 2025”, publish and upload time 2025-05-12T17:53:29-07:00, a length of 1,033 seconds, public rather than unlisted or private, and playability status OK.
- [2] The Inner Circle Trader on X – post sharing the April 3, 2025 “ICT Venom Model Tutorial” (first-party account; read 2026-09-13). It carries different wording and a different recording, which is why the May 12 example is treated above as a worked example rather than as the tutorial.
- [3] TradingView – “ICT Venom Trading Model [TradingFinder]” (third-party community script, unofficial and untested; read 2026-09-13). It describes Venom as an intraday model for major US indices and places its critical window at 08:00–09:30 with a liquidity grab at the 09:30 open; that session definition comes from the script author and is not what the May 12 recording teaches, so it is listed as an unofficial point of comparison only.
- [4] TradingView – “ICT Venom Core – Simple NY Setup” (third-party community script, unofficial and untested; read 2026-09-13). It marks the 8:00 a.m., 9:30 a.m. and 11:30 a.m. New York times and tracks the high and low of the 8:00–9:30 a.m. range; like source 3 it is a third-party coding of the idea, not a statement by ICT and not evidence of performance.
BestProps is not affiliated with The Inner Circle Trader, TradingView or X Corp., and no source listed here endorses this article, this site or any method. Venom, SIBI, BISI, fair value gap, inversion fair value gap, consequent encroachment, turtle soup and gap risk are used on this page as descriptive terms taken from the recording or from the third-party sources named; none is presented as official, tested, free of repainting or profitable. No script, strategy or account was tested, replayed or measured for this article.