
Key takeaways
In his June 16, 2025 ICT 2025 Lecture Series recording on keys to success in troubled markets, ICT defines a troubled market as one that is unwilling to continue higher or lower and instead keeps overlapping earlier candle ranges — a condition he calls time distortion rather than a clean range.
Read the full summary
In his June 16, 2025 ICT 2025 Lecture Series recording on keys to success in troubled markets, ICT defines a troubled market as one that is unwilling to continue higher or lower and instead keeps overlapping earlier candle ranges — a condition he calls time distortion rather than a clean range. Working from the daily Nasdaq chart down to one-minute and 30-second views, he anchors the discussion to a February 24 daily sell-side imbalance and consequent encroachment level, a June 3 daily fair value gap, and quadrant levels inside a graded range, then describes how a break beneath selected swing lows shifts market structure and makes the upper half of that range “premium” for a short scenario. His stated filter is that the available movement must be large enough to cover spread, slippage and commissions on both sides before he will engage, and he repeatedly states that he is not giving trade advice, that the risks he sees are unusually large, and that he will not teach the proprietary PD arrays he uses for very tight invalidation. This page is a transcript-grounded study of his analysis; the recording does not establish that any level, scenario, execution, fill or outcome occurred as described.
How we researched this article
BestProps used document-based research from primary firm sources, checked September 24, 2026. The complete source list, scope, limitations, and commercial-state record appear near the end of this article.
The Inner Circle Trader’s June 16, 2025 installment of the 2025 Lecture Series is titled Keys To Success In Troubled Markets. The recording runs about 25 minutes and 35 seconds and is devoted almost entirely to method: how he frames Nasdaq futures after a contract roll, how he grades a range, and what he requires before a setup is worth his risk. For readers searching for ICT 2025 lecture series keys to success in troubled markets June 16 2025, this article works from the recording’s own audio and timestamps rather than from a keyword brief or from a third-party outline.
Three limits apply to everything below. The transcript used here was produced by automatic speech recognition of the full original audio, not by human-checked YouTube captions, so individual terms and numbers may be misrendered; where that matters it is flagged in place. The transcript records speech only, so chart annotations, candle relationships, order tickets and on-screen results cannot be independently confirmed from it. And every market observation in this article is ICT’s interpretation as he spoke it, not a verified fact about what price did afterward.
Contract rollover comes first
He opens by announcing a roll. At 0:04 he says he is moving out of the June Nasdaq contract, and that after this presentation his Nasdaq commentary would refer to the September 2025 delivery month. At 0:20 he adds that any reference to the ES or the Dow would likewise mean their September 2025 contracts.
One detail deserves honesty rather than a tidy fix. The automatic transcript renders that third instrument as “Dow.” The page he refers to for the same sentence — a third-party notes archive — renders it “DAX.” The two disagree, and the audio alone does not settle which index he named, so treat the third instrument as unresolved here. The NQ and ES references are unambiguous in the transcript.
The roll is not just bookkeeping. Different contract months trade at different prices, and charting platforms build continuous series differently, so a level carried from an expiring contract to a later one can sit at a different place on the chart. That is why he frames the rest of the session around one explicit delivery month. At 25:24 he closes the loop, saying he had already posted on X that he would be trading the September contract going forward and that this was the last look at the June contract.
What he means by a troubled market
Asked implicitly by his own framing, he answers directly at 1:45: a troubled market is one where price shows an unwillingness to go higher or lower and begins sharing the ranges of previous candles or bars. Overlapping delivery, in other words, rather than clean expansion.
Later he sharpens the definition. From roughly 10:29 he says it is not necessarily a range-bound market but a chaotic portion of price action, and he gives his own name for it: time distortion. His explanation is behavioural. Holding price in a holding pattern, he argues, gives participants time to build a bias and a narrative, while large participants refrain from committing because the surrounding risk is elevated; when price finally leaves the consolidation, that resolution is what draws deeper participation in. He also states plainly at 9:50 that approaches built from what he calls the retail collection of concepts will produce frustration in this environment, because the market is being fickle and allowing sentiment to accumulate.
He also names the external context: at 0:45 he refers to weekend developments he had anticipated and to exchanges between two countries, and at 4:03 he calls gap risk an enormous concern both in the Middle East and domestically in the United States. This is his read of the news backdrop, not a documented cause of any specific price move.
The daily references he is grading
The chart work starts on the daily Nasdaq chart. From 1:34 he walks through two February references — the 21st and the 24th — describing both as down-closed candles, with the February 24 reference carrying the Fibonacci levels he has graded onto it. He notes that an upside target taken from that work was reached at the time it was given.
He then tracks how price behaved around those levels: a move down into the discount wick of a candle, a rally back inside the February 24 reference, a trade up into the February 21 reference, a break back into a daily fair value gap formed on June 3, 2025, a session that opened at the low of that gap, and a return to consequent encroachment at 2:38. His terminology has to be handled carefully here: the automated transcript renders the recurring term variously as “SIBI,” “SIVI” and “Sibi.” At 2:45 he glosses it himself as a sell-side imbalance and buy-side inefficiency, and that gloss is what is used on this page.
He also reviews his own earlier guidance: he had described Nasdaq as bullish while price was lower, looking for a move up into the gap, and had said it would be an ideal scenario if price first ran below a particular low — the institutional order flow entry drill — before rallying, using a down-closed candle as an order block. He notes that price did drive up into the inefficiency but failed to reach consequent encroachment of the gap. What the transcript cannot supply is whether any of those annotations were drawn the way he describes; the speech and the chart are two different things.
Quadrants, midpoints and directional clues
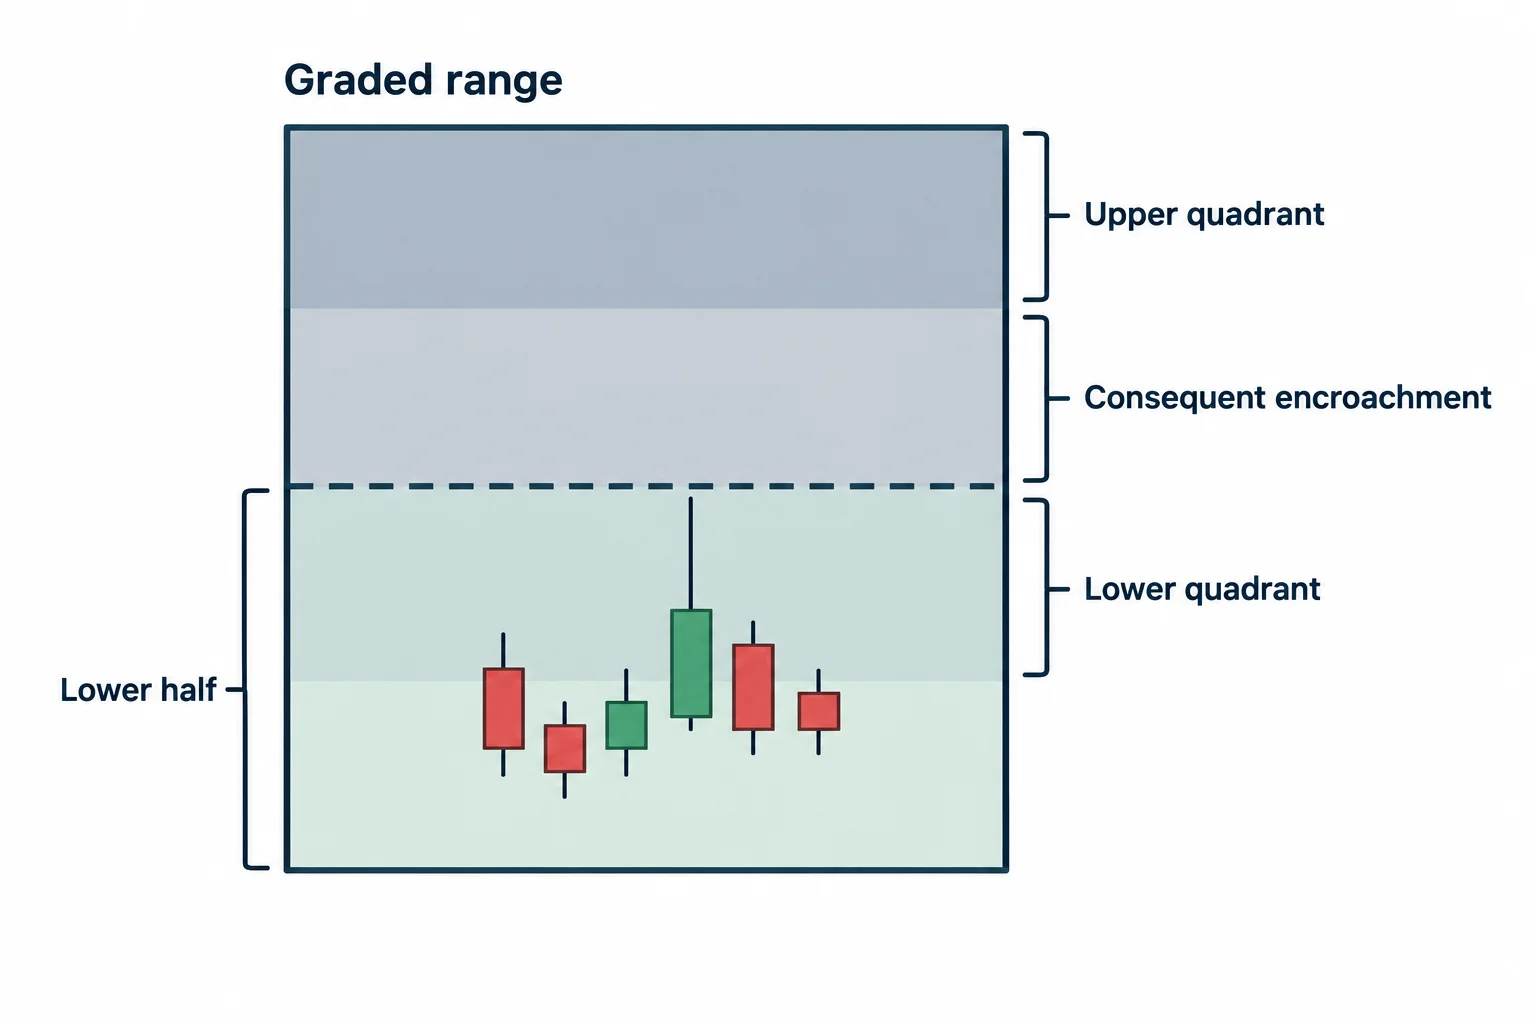
A large part of the lecture is about dividing a chosen range. From 6:11 he lists the levels he tracks inside a graded range: the lowest quadrant, consequent encroachment as the midpoint, the upper quadrant, and the high of the individual gap. He highlights the range so the same levels can be carried into lower timeframes.
His read of the day was built on where price was operating inside that structure. He notes that price was working in the lower half and having difficulty holding above the midpoint, which he treats as a bearish signature, and at 6:29 he states the conditional conclusion in his own hedged terms: price could have topped on the short term, in the sense that it ran into the gap but failed to reach consequent encroachment. He is explicit that he is not saying it will, or that it has.
From 11:22 he reduces the session to its practical instruction: the key to success in a troubled market is to stop thinking in classic support-and-resistance terms and to reason from predefined levels instead. He tells the viewer he is not a proponent of that approach in general and argues it is especially unsuited to this environment.
Liquidity pools, and why he is not calling a top
At 5:10 he identifies two significant pools of liquidity — one near-term buy side above an obvious swing high and one near-term sell side below an obvious swing low — and mentions smaller buy-side pools formed around June 6 and June 13 that had not been breached that week.
What follows is a deliberate refusal to forecast. Around 3:37 he says that, longer term and without trying to pick a top, he is using those highs as a relative equal high draw on liquidity, and that he still focuses on the likelihood price could keep grinding higher even though positioning longer term is difficult because a reasonable stop would require exorbitant risk. Two opposing possibilities are held open in the same session, which is worth noting: the same lecture contains a short-term bearish scenario and a longer-term higher scenario.
Premium only exists relative to a chosen range
At 14:41 he pushes back on how he thinks many viewers use his own vocabulary, saying people assume they understand his discount and premium theory when they do not. His correction is that premium is not a property of a price; it is measured against an anchor. In the example in this recording, once price breaks structure at a selected low, the movement between that low and a second reference level is graded, and anything at or above the resulting threshold is treated as premium within that specific bearish scenario.
That structure break is the pivot of the whole idea. Around 12:48 he says that when price finally breaks below particular swing lows, that is a shift in market structure, and anything inside the range can then serve as a premium array for a short. He then aims at what he calls low-hanging fruit rather than a large extension: nearby lows, an actual gap or liquidity void, or the lower quadrant. He notes that the entry he describes came only once, and that price subsequently rallied back without taking out the low.
The movement test he applies before engaging
The clearest statement of his filter comes at 15:32. He says that if he cannot comfortably take at least about fifteen NQ handles out of a short with the spread accounted for on both sides, he will not take the trade. The automated transcript is ambiguous at this exact point, dropping the word “cannot,” and the sentence as transcribed reads oddly; the surrounding passage at 16:00 clarifies the intent, describing a range that would allow roughly twenty handles of movement, or about fifteen net after slippage, spread and per-contract commission costs. He then illustrates it on that session’s own chart levels.
Those chart figures are deliberately not reproduced here. They were specific to that contract, that session and that moment, they are several months old, and the only source for them is automatic speech that can mishear digits. What survives the passage is the requirement itself: a minimum-movement test that must clear costs before a trade is considered worth taking. That is a cost-aware selectivity rule as he states it, not a rule this page is recommending or validating.
Lower-time-frame execution, and what he refuses to teach
From the daily view he descends to the one-minute chart and then to 30-second charts, where he discusses a volume imbalance, an inversion fair value gap, a rejection block, and a down-closed candle framed by its neighbours’ extremes as an order block. He also describes managing an entry inside a volume imbalance so that the worst case would be limited to consequent encroachment of a one-minute imbalance.
His invalidation method is stated as a principle rather than a formula. Around 16:51 he says a stop belongs one or two ticks beyond the level he wants price not to breach — above a midpoint when he wants price to rotate lower, or beyond a specific level he expects to hold. He acknowledges that this looks implausibly tight and says it is possible because of the PD arrays he uses.
He then declines to explain those arrays. From 17:05 onward he says he has PD arrays that allow for very precise placement, that he will not teach them, that he guards roughly eighty-one of them, and that they are reserved for his family. He also warns viewers away from material claiming to reveal hidden or paid-membership methods, calling such content predatory. Because the construction and rules are withheld, the precision of that portion of the method cannot be reproduced or evaluated from this recording — that is a limit of the source, not a judgment about the method.
Two practical admissions round out the execution section. At 24:03 he says he wanted to add two more contracts but was not given the chance. And from 23:59 he explains why 30-second setups are harder in live conditions than on a completed chart, comparing the delay between seeing a hazard and stopping a car with the far longer delay for a loaded truck, and noting that very short timeframes skew reaction time. He adds at 25:01 that limit orders are ideal but that he spent that morning measuring volatility and the order flow and liquidity of the June contract before deciding which session he would use it for. These are his observations about his own workflow; nothing in the transcript documents a fill, a size, or a result.
He also addresses broker disclosure from 21:45: he says he has no affiliate arrangements, receives no relationship kickbacks, is not steering viewers to a particular firm, and will not name the broker he uses. That is a statement about his own arrangements as he described them, taken at face value and not independently corroborated here.
A study checklist drawn from the session
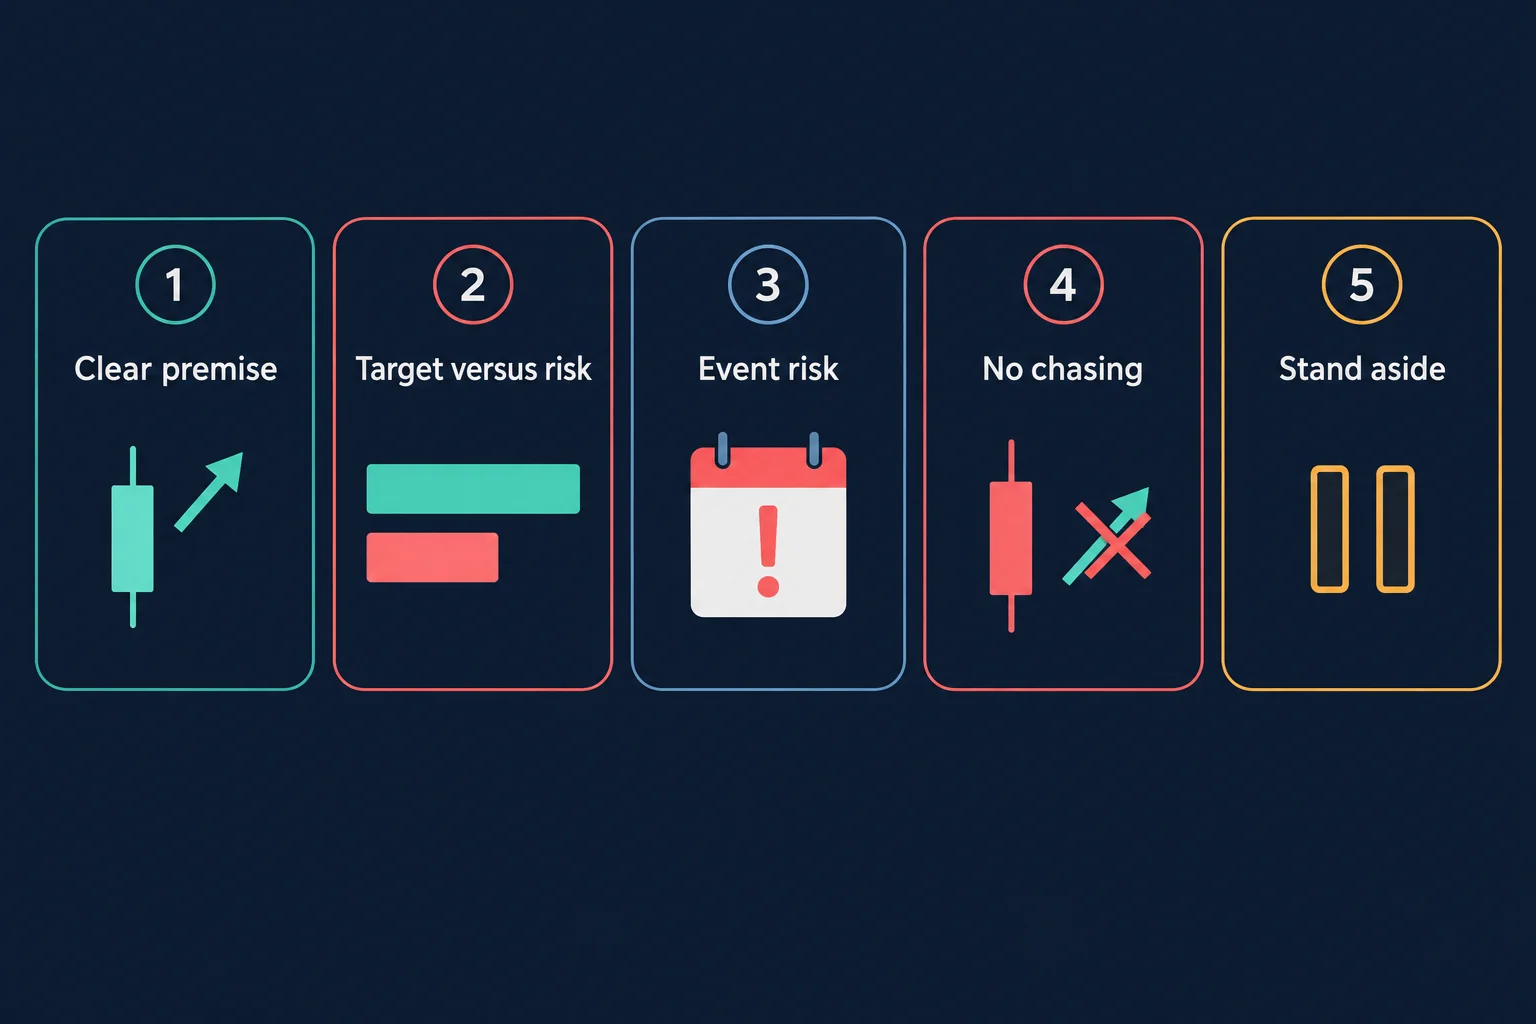
Reduced to questions a reader could ask before a session in a similarly unclear market, the lecture’s own conditions map onto a short list:
- Is there a directional premise at all, or is price sitting inside overlapping, indecisive delivery?
- Has a specific structure break occurred, so that premium or discount can be anchored to something real rather than assumed?
- Does the available movement to the nearest objective clear the spread, slippage and commissions on both sides?
- Where exactly is invalidation, and is a stop beyond that point survivable at the intended size?
- Is a scheduled event or an unresolved geopolitical risk capable of producing a gap through that plan?
- If the answer to any of the above is unclear, is standing aside the more consistent choice?
None of these questions predicts an outcome. Their function is to make participation conditional, which is the one theme that runs through the entire recording regardless of which chart level is being discussed.
The strongest lesson is the conditional language
Set aside the terminology and the transcript still carries a usable distinction. Throughout the session, levels are presented as references and scenarios as possibilities: price could have topped short term, price could keep grinding higher, and a particular retracement might present a location he would consider. He never converts those into promises, and at 7:08 he states outright that the discussion is not trade advice, that it is meant to encourage viewers to watch price action, and at 7:36 that the risks he sees right now are exorbitant at an off-the-charts level.
For a reader working through the recording, the honest summary is this: the session is a demonstration of how one trader organises an unclear market — grade a range, anchor premium to a structure break, demand that movement justify cost, keep invalidation tight and specific, and accept that declining a setup is a legitimate decision. Whether that framework produces a tradable edge is not something this transcript establishes, and it is not claimed here.
Source video: 2025 Lecture Series – Keys To Success In Troubled Markets June 16, 2025
The recording mapped to this article is 2025 Lecture Series – Keys To Success In Troubled Markets June 16, 2025, published on the channel The Inner Circle Trader on 16 June 2025 with a runtime of 1,535 seconds (25:35). Timestamp links on this page point into that recording.
Watch the original lesson on YouTube
The recording cannot be played inside another website. Its embedded player was loaded from a BestProps page origin and clicked on 14 September 2026; the player itself reported “Playback on other websites has been disabled by the video owner,” reported a duration of NaN and a ready state of 0, and never offered a play button — so no embed is reserved or left blank here. The recording remains available directly on YouTube.
Watch 2025 Lecture Series – Keys To Success In Troubled Markets June 16, 2025 on YouTube ↗
Sources and checks for this article
Four references support this page. The first is the recording itself, from which the transcript used here was produced. The second is the first-party announcement post that the page links. The third is a third-party notes archive covering the same session. The fourth is the exchange operator’s own lesson on expiration and rollover. Nothing on this page was tested, traded, replayed on a chart or measured, and no source listed here endorses this article.
The recording and its transcript
This article was written from the audio of 2025 Lecture Series – Keys To Success In Troubled Markets June 16, 2025, published on the channel The Inner Circle Trader.[1] The watch page reports a runtime of 1,535 seconds and a public upload dated 16 June 2025; the audio used for transcription was also measured at 1,535.061 seconds, so the transcript covers the full recording rather than a fragment.[1] The speech was transcribed by local automatic speech recognition, which is why terms such as the recurring imbalance reference and the third instrument named at 0:20 are flagged as uncertain above and why no numeric chart level from the session is reproduced on this page.[1] Timestamps cited in the body are the transcriber’s own, taken from that run, and are accurate to within the alignment of automatic timestamps rather than human-reviewed caption timings.[1] The recording’s upload date is 16 June 2025; the transcript does not independently establish a separate recording date.[1]
The first-party announcement post
The page links the post published by The Inner Circle Trader through the X account @I_Am_The_ICT, which is where ICT said at 25:24 that he had announced the move to the September contract.[2] That URL resolved on 14 September 2026, but X refused the automated request used to read it, so its wording was not re-read for this revision and nothing on this page depends on its exact text beyond the fact of the announcement.[2]
The third-party notes archive
The archivist page for the same session is a third-party summary written by someone else, not the presenter’s own notes and not an official ICT publication.[3] Read on 14 September 2026, it reports the roll into September contracts, the troubled-market framing of chaotic consolidation and time distortion driven by geopolitical risk, quadrant levels, a substantial minimum-edge requirement on NQ before short entries, one-to-two-tick stop placement beyond defined levels, withheld PD arrays, and the presenter’s statement that he was not giving trade advice.[3] It is cited here for two narrow things: it is the second source for the minimum-movement requirement discussed above, and it is the reason the third instrument at 0:20 is recorded as unresolved, because it names DAX where the transcript renders Dow.[3] Everything else on this page comes from the transcript, and where the two differ the transcript governs.
What the exchange operator states about expiration and rollover
The article’s rollover discussion reflects the exchange operator’s own account of contract mechanics. Its lesson states that futures contracts have a limited lifespan that influences the outcome of trades and the exit strategy, and that the two most important expiration terms are expiration and rollover.[4] It adds that a contract’s expiration date is the last day it can be traded, typically the third Friday of the expiration month but varying by contract, and that rollover is the act of moving a position from the front month to a later contract, with traders timing the move by watching the volume of both the expiring and the next month contract.[4] Scope note: that is the exchange’s general description. It is not a statement about any specific 2025 NQ, ES or DAX contract, and no contract month, level or date is asserted here from it beyond what ICT himself stated.[4]
Unofficial and untested material
Concepts used on this page — troubled market, time distortion, fair value gap, consequent encroachment, order block, volume imbalance, inversion fair value gap, rejection block, sell-side imbalance and buy-side inefficiency, premium, discount, PD array and market-structure shift — are ICT’s own descriptive vocabulary, and ICT’s PD arrays are undisclosed by his own statements in the recording.[1] Any ICT, smart-money or third-party indicator, script, tutorial or strategy referred to anywhere on this page is unofficial unless a first-party ICT publication states otherwise; none is presented as official, tested, or free of repainting, and no indicator, script, strategy or account was tested, replaye