
Key takeaways
The Inner Circle Trader’s 25 minutes 33 seconds YouTube recording published 17 September 2025 explains FOMC two-stage delivery on December Nasdaq futures as a 2 p.m.
Read the full summary
The Inner Circle Trader’s 25 minutes 33 seconds YouTube recording published 17 September 2025 explains FOMC two-stage delivery on December Nasdaq futures as a 2 p.m. selloff into deep discount and a daily volume imbalance followed around the two thirty p.m. press conference by a reversal through graded fair value-gap levels to take the day’s buy-side liquidity. ICT applies his 2022 model using a high-to-low Fibonacci, premium retracement above 50%, a 62% to 79% optimal trade entry zone, higher-timeframe inefficiencies divided into low, lower quadrant, midpoint or consequent encroachment, upper quadrant and high, plus volume imbalances and unfinished liquidity. Reported chart levels were $24,528.5 buy-side liquidity, $24,473.25 upper quadrant, $24,447.5 consequent encroachment, $24,421.5 premium sensitivity, $24,384.75 premium-wick upper quadrant and $24,297.75 extended fair value-gap upper quadrant. He shorted once in the morning and once during FOMC, but the afternoon short failed to reach its objective before his trailing stop exited it, reinforcing his rule to trade FOMC days surgically rather than hold for the full move. He treats the Dollar Index only as a directional barometer for euro, cable and other dollar pairs, cites euro equal highs near 1.19087 and warns that the observed two-stage Nasdaq sequence is descriptive rather than a fixed signal. All levels came from automatic speech recognition without chart inspection or verified fills, size, profit and loss, or order records, and the article recommends pairing daily and one-minute charts, mapping liquidity, grading inefficiencies and wicks, separating the 2 p.m. release from the two thirty p.m. press conference, defining no-trade conditions and reviewing the recording against your own charts.
How we researched this article
BestProps used document-based research from primary firm sources, checked September 24, 2026. The complete source list, scope, limitations, and commercial-state record appear near the end of this article.
How This ICT FOMC Recording Is Used
The article below is written against the mapped recording itself: Trading FOMC Two Stage Delivery on the channel The Inner Circle Trader.[1] It is a public first-party upload dated 17 September 2025 with a runtime of 1533 seconds (25:33), and the presenter opens by naming the same day – “Today is September 17th, 2025” – so the spoken date and the platform date agree instead of falling on different sides of midnight UTC.[t=0:00]
Two limits matter before reading further. First, the recording’s audio was transcribed in full with local automatic speech recognition because captions were unavailable, so the timings quoted here are approximate and the terms and numbers he reads off his charts can be mis-transcribed. Every price level below is presented as the level he states as transcribed, not as an independently confirmed chart value. Second, no video frame was visually inspected for this article: the chart geometry, candle relationships and annotations he refers to are described only as far as his spoken words carry them.
Building the ICT FOMC Higher Timeframe Map
The lesson opens on Nasdaq futures, where he notes the December contract had become the more active one, and he pairs a daily chart with a one-minute chart so that higher-timeframe areas can be carried down to the intraday view.[t=0:20]
He begins by recapping the previous night’s lecture about trading around all-time highs: look for very specific price points, volume imbalances, fair value gaps, opens and closes, and avoid trying to pick the top.[t=1:06] His stated position is that a seasoned analyst can take countertrend shorts, but they have to be intraday, because the larger-scale runs are more likely to keep going higher and nobody can reliably call the top – in his words, anyone who tells you they have figured it out is lying.[t=1:52]
On the intraday chart he marks relatively equal highs, then points to the open and close of the previous day’s daily candle as a reference and shows a 9:30 a.m. run above nearby highs followed by a break lower that he reads as a bearish shift in market structure.[t=2:21] From there he labels relatively equal lows as minor sell-side liquidity and identifies a sell-side liquidity pool below, before studying how that pool sits relative to the range of Monday’s single up-close candle to argue why price is more likely to come back down into a volume imbalance and a fair value gap.[t=2:37]
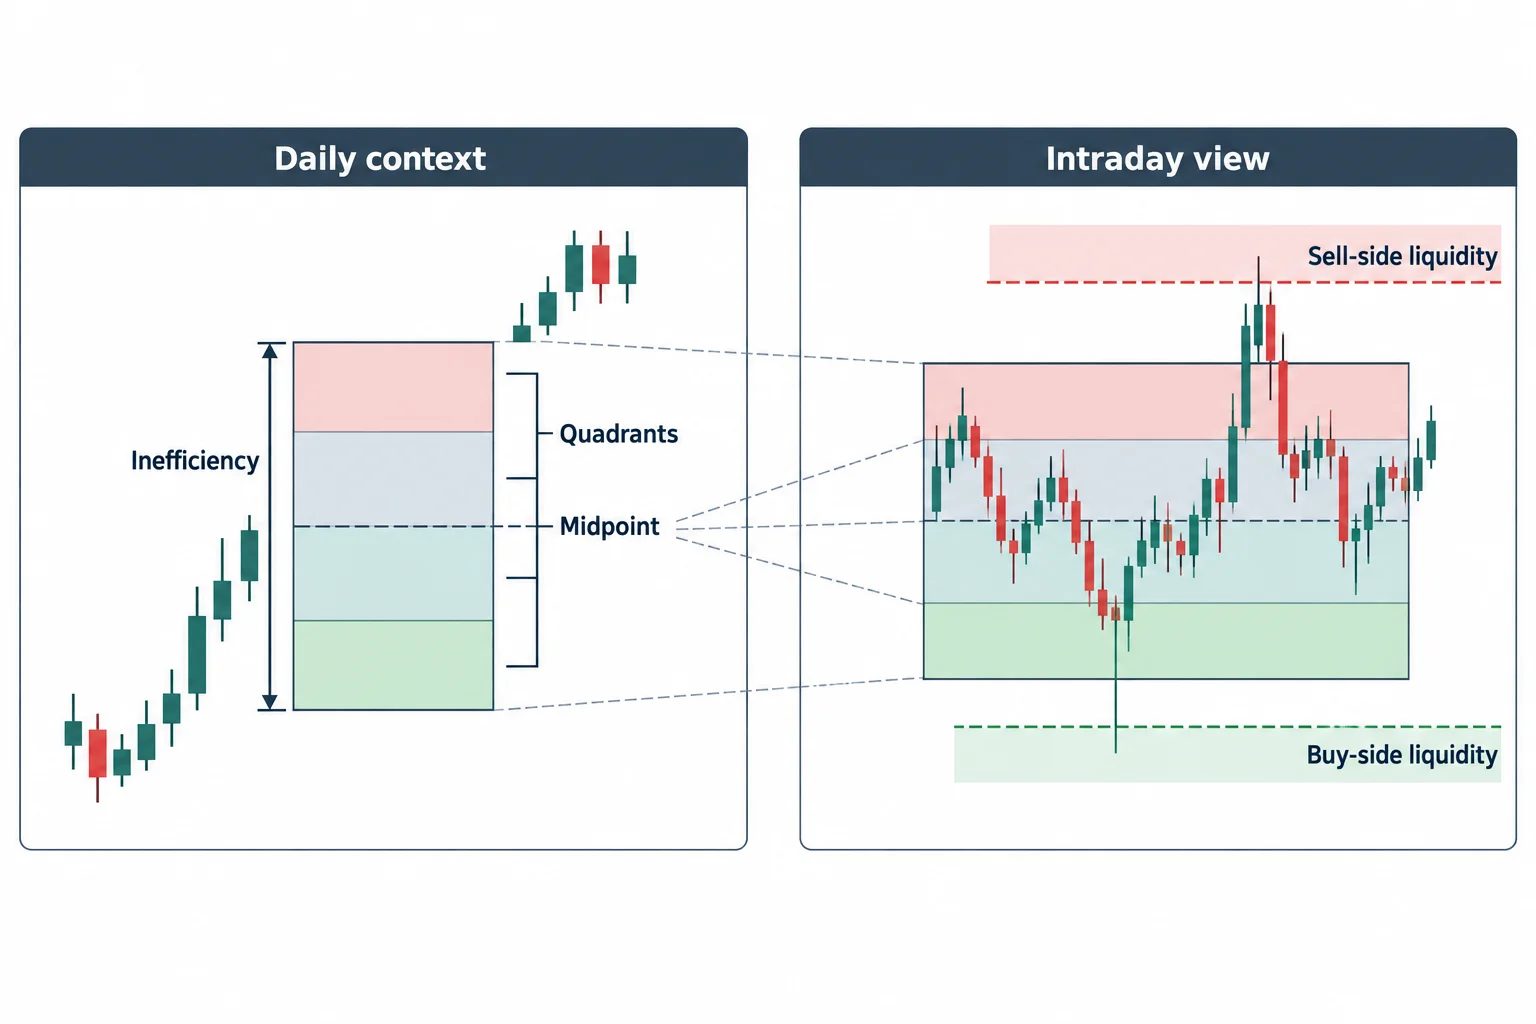
He then grades a daily bullish fair value gap – what he calls a buy-side imbalance, sell-side inefficiency – into its low, lower quadrant, midpoint or consequent encroachment, upper quadrant and high, and transposes those subdivisions onto the one-minute chart, alongside the first presented fair value gap after 9:30 a.m. Eastern and a minor sell-side pool.[t=5:05][t=5:50]
He also gives two definitions worth keeping separate, because the article uses them later. A premium wick, in his wording, is any wick above a candle’s body and a discount wick is any wick below it.[t=14:35] A volume imbalance he describes as the separation between one candlestick’s open and another’s close.[t=9:10] Those are his study terms, not standardised definitions.
ICT FOMC Morning Trade and 2022 Model
Before the FOMC portion he states that he shorted twice that day – once in the morning and once in the afternoon at the FOMC – using what he calls the 2022 model, and he pushes back on the idea that his approach is something more exotic.[t=3:38][t=3:51] The morning sequence he describes runs as follows:
- Price runs above a buy-side liquidity area after the 9:30 a.m. open.[t=4:17]
- A break lower shifts short-term structure, giving him a bearish context.
- He draws a Fibonacci range from the relevant high to low and looks for price to retrace into a premium above the 50% level, ideally into the three-quarter pullback he calls the optimal trade entry.[t=4:27]
- The retracement lands in an inefficiency, and a lower sell-side pool becomes the draw.
He points out that price rallied away from the nearby lows leaving sell stops intact, which he calls a false hope rally for bulls, and that the rally went up into the first presented fair value gap before selling off through the sell-side pool and into the consequent encroachment of the daily bullish inefficiency.[t=7:18] The levels he reads at that point are $24,447.5 for that consequent encroachment and $24,473.25 for the upper quadrant above it, presented here exactly as transcribed.[t=7:40][t=7:53]
Two of his methodological claims are worth flagging as claims. He says he grades every inefficiency from the higher timeframes down to the lower ones, and that these graded levels are more sensitive and more accurate than common floor pivots or simple support-and-resistance ideas, which he calls subjective.[t=8:05][t=8:16] Nothing in the recording measures that comparison, and he jokes about the “algorithm” it supposedly syncs with.[t=9:03] What can be taken from it is his process: mark the higher-timeframe inefficiency, grade its subdivisions, and watch how price reacts there.
Later in the same stretch he describes price sweeping into the consequent encroachment of the daily inefficiency, returning to the upper quadrant, failing at consequent encroachment several times, and reaching another sensitivity level around $24,421.5.[t=9:43][t=10:30] He then runs a Fibonacci from a prior high to that low and highlights the 79% and 62% retracement levels as the optimal trade entry zone, notes a body stopping inside the first presented fair value gap, and describes a convergence he calls Venom where price passes through a gap in both directions before selling off again.[t=10:59][t=11:31]
His closing note on the morning is a risk statement: that was enough for the morning session, you could hold for lower, but on an FOMC day he wants to be surgical – get in, get out.[t=11:56][t=12:05]
How ICT FOMC Two Stage Delivery Works
The FOMC section starts with the 2:00 p.m. window. He had extended the first presented fair value gap into the afternoon – something he says he teaches – and describes price trading up into that gap after 2 p.m., breaking lower, and then reaching the upper quadrant of the gap between a candle’s close and the next candle’s low at $24,297.75 as transcribed.[t=16:48][t=17:21]
He also corrects himself on the record here, and the correction is part of the source value: reviewing the session he says that during the live trade he called a lower daily feature a fair value gap when the correct term was volume imbalance, and attributes the slip to typing and talking while positioned into an FOMC release.[t=13:14] Earlier in the same review he had graded a premium wick and marked $24,384.75 as its upper quadrant.[t=14:15][t=14:21]
The two stages he describes are:
- First stage: the 2:00 p.m. reaction delivered sharply lower, into what he calls a deep discount and the daily volume imbalance. He states plainly that he was stopped out on that run after trailing his stop, and that he did not get his objective.[t=18:04] He points viewers to a short clip of that trade on his X account rather than to a verified record.[t=18:16]
- Second stage: after the dip into the daily volume imbalance, he says a second wave usually begins around 2:30 p.m., when the press conference is under way, and this one reversed upward off that low, crossed the graded gap levels and eventually ran above the earlier daily high.[t=18:51]
He summarises the distinction directly: the selloff from 2:00 p.m. was the first delivery, and the rally from the afternoon low up into buy-side liquidity was the second, with the consolidation after the high was taken effectively untradeable.[t=20:22][t=20:45] He also notes that the press-conference portion tends to delay the reaction rather than front-run it.[t=20:28]
Read carefully, the term is therefore descriptive of one session he had traded, not a mechanical rule with fixed entries. His own summary of the afternoon includes a losing management outcome and an untradeable consolidation phase, and the transcript contains no independently verifiable order record, fill list or profit-and-loss result.
Verifying ICT FOMC Trade Levels
These are the price references he reads out loud, reproduced as transcribed by automatic speech recognition. They are his chart annotations on the December Nasdaq contract and are not independently confirmed here:
- $24,528.5 – the buy-side liquidity pool he marks above price.[t=5:32]
- $24,447.5 – the consequent encroachment of the daily bullish inefficiency, which price reaches and reacts from.[t=7:40]
- $24,473.25 – the upper quadrant of that same inefficiency, which price returns to afterwards.[t=7:53]
- $24,421.5 – a lower premium-sensitivity level he identifies on the way down.[t=10:30]
- $24,384.75 – the upper quadrant of the premium wick he grades later in the session.[t=14:21]
- $24,297.75 – the upper quadrant of the extended fair value gap that price trades into after 2 p.m.[t=17:21]
No fill, entry, exit, size or account result is established for any of them. Automatic transcription of spoken numbers can mishear a digit, so the values are given as his stated levels with that caveat, not as verified market data.
ICT FOMC Trade Context for the Dollar and Euro
In the final section he uses the Dollar Index as a directional barometer rather than an instrument he trades – “I don’t trade the dollar index” – and says it helps him judge the opposite direction for euro, cable and other dollar pairs.[t=22:38] His stated read on the day was bearish: he wanted the index to ignore the lower half of the inefficiency and start building bullish discount arrays before he would change that view, and he allows that it can simply keep consolidating as it had for months.[t=22:00]
On euro he works from the weekly chart and notes a first-stage push into relatively equal highs at a level he recalls as 1.19087, followed by rejection and a drop, with the only area he says he would have considered trading being a five-minute gap idea to take the prior low and then leave rather than hold for more.[t=23:23][t=23:44] He then admits he has not talked about Forex in a while, calls euro and cable sloppy on anything below a one-minute timeframe, and says he will cover euro, cable and possibly yen crosses in future when it is pertinent.[t=24:33][t=25:03] The comparison reinforces the obvious: the Nasdaq sequence he describes should not be generalised into a guaranteed announcement-day pattern for other instruments.
How to Study an ICT FOMC Trade Session
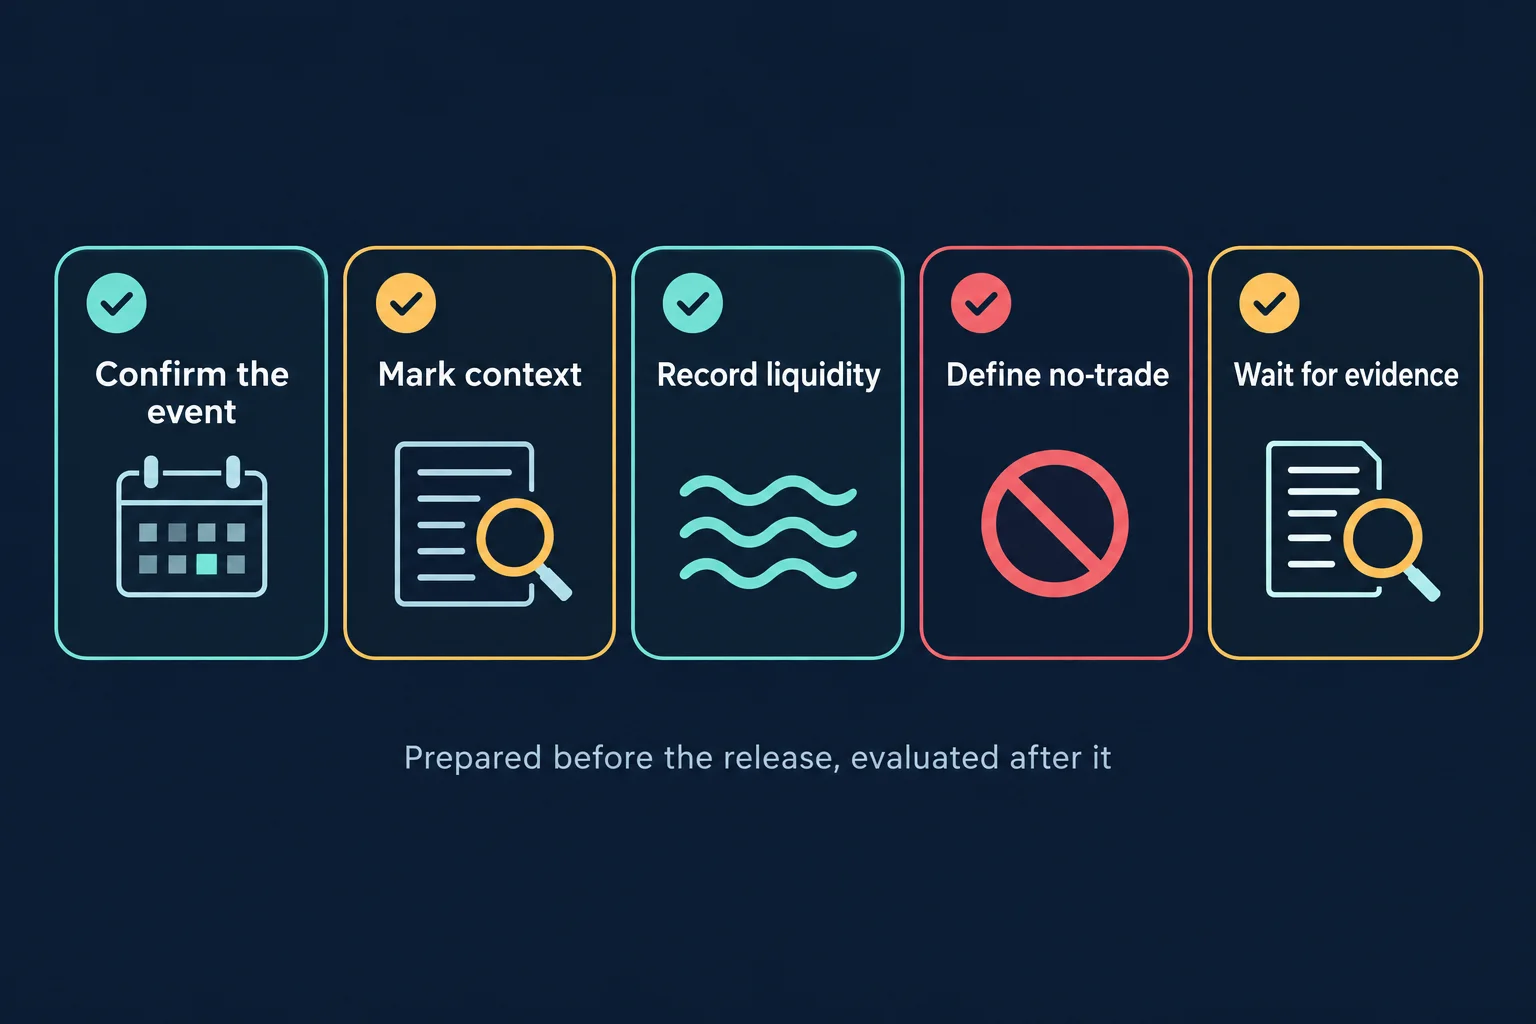
The recording does not present two-stage delivery as a signal with fixed entries. Its practical study value is the preparation and journaling he keeps returning to:
- Place the daily chart beside the execution timeframe so higher-timeframe context is always in view.[t=19:39]
- Grade higher-timeframe inefficiencies and wicks into quadrants and a midpoint, then transpose those levels down.[t=12:42]
- Record buy-side and sell-side liquidity, including the relative equal highs and lows that leave orders behind.
- Define in advance what you will not trade – on an FOMC day he wants small, surgical objectives.[t=12:05]
- Separate the 2:00 p.m. release reaction from activity in the 2:30 p.m. press-conference window.[t=18:51]
- Compare the recording with your own charts afterwards, which is the one instruction he repeats.[t=19:32]
The five-step checklist shown above this section is this article’s own general preparation list, not a rule set taken from the recording. This page is educational explanation of a public recording, not investment advice, and it does not promise an outcome.
Watch the original recording on YouTube
This video cannot be played inside another website: when its embedded player was opened and clicked on 13 September 2026 and again on 14 September 2026, the player itself reported “Playback on other websites has been disabled by the video owner.” That is the video owner’s own player message, which is why this page carries a watch card rather than an embed; the recording is available directly on YouTube.
ICT FOMC Sources and Their Uses
Five references sit behind this page. The first is the recording the article is written from, transcribed end to end for this version and used for everything the speaker says about the session.[1] The next three are the Federal Reserve’s own pages for the meeting that the lectured session followed: the calendar page, the meeting page and the policy statement.[2][3][4] The fifth is the third-party TradingView idea that older versions of this article cited for a four-stage framework; it is unofficial and is used only for what it states.[5]
The ICT Recording Behind This Guide
The mapped recording is Trading FOMC Two Stage Delivery on the channel The Inner Circle Trader.[1] Its watch page was read on 13 September 2026 and re-checked on 14 September 2026: the page was public rather than private or unlisted, and its own data reported a publish and upload time of 17 September 2025, a runtime of 1533 seconds (25:33), and normal playability. The presenter opens the recording by stating the same date, 17 September 2025, and the session he reviews is the FOMC event of that day. Unlike the earlier version of this page, which could only identify the upload, this version is grounded in a full transcription of the recording’s audio, produced locally with automatic speech recognition because no captions were available. That transcript is the source for the two-stage framing, the definitions of a premium wick and a volume imbalance, the graded levels, the reported trades and the dollar and euro comments above. Its limits are stated in the method section: the timings are approximate, and spoken terms and numbers can be mis-transcribed. The speaker’s own account of his trades and stops is reported as his account, and it is not verified by any order record. When the video’s embedded player was loaded and clicked on 13 and 14 September 2026 it reported that playback on other websites has been disabled by the video owner, which is why this article carries a watch card rather than an embed.[1]
The Official FOMC Event Schedule
For the date itself, the Federal Reserve’s meeting calendars and information page states that the FOMC holds eight regularly scheduled meetings during the year and other meetings as needed, links policy statements and minutes from those calendars, and states that minutes of regularly scheduled meetings are released three weeks after the date of the policy decision.[2] That is the page to check for a date and for the fact that information from a single meeting arrives in more than one instalment.
Why FOMC Delivery Has Two Information Windows
For the event window he trades through, the Federal Reserve’s own page for the September 16-17, 2025 FOMC meeting collects the materials released for that meeting – the statement, the implementation note, the projections materials and a press conference transcript – and the calendar page above lists that meeting’s minutes as released on 8 October 2025.[3][2] The statement itself is marked for release at 2:00 p.m. EDT.[4] So separate, time-stamped windows inside one meeting do exist and are published: a decision released in the afternoon and a press conference that follows it. Those pages do not show that price must deliver in two stages, and nothing here is offered as evidence of a price sequence; the point is only that a release and a press conference are genuinely separate information events.
The FOMC Policy Decision Behind the Trade
For the meeting itself, the Federal Reserve Board’s FOMC statement of 17 September 2025 records that the Committee lowered the target range for the federal funds rate by 1/4 percentage point to 4 to 4-1/4 percent, with one member voting against the action in preference for a half-point reduction.[4] This is background to the session the recording’s date falls on. It says nothing about how any market traded that day and is not a forecast for any future meeting or price path.
The Third-Party ICT Framework Reference
The TradingView page cited in older versions of this article is a community post in the Education category titled 4 Stages of Price Delivery (ICT Concepts), published by the user Road_2_Funded and dated July 2024, listing four stages as consolidation, expansion, retracement and reversal.[5] It is one individual’s post attached to a chart, is not an official ICT publication, and is not the source of the two-stage framing used in this article – that framing comes from the recording itself.[1] The same page carries TradingView’s own disclaimer that its publications are not financial, investment or trading advice, and the author’s closing claim of accuracy is the author’s claim about their own method, not something repeated or relied on here.
ICT FOMC Sources
- [1] YouTube: Trading FOMC Two Stage Delivery – The Inner Circle Trader (mapped first-party recording; page metadata read 2026-09-13 and re-checked 2026-09-14: public, not unlisted or private, publish and upload time 2025-09-17, runtime 1533 seconds, playability OK; full audio transcribed locally with automatic speech recognition because no YouTube captions were available; embed playback reported by the player as disabled by the video owner)
- [2] Federal Reserve Board: FOMC meeting calendars and information (official schedule page; states eight regularly scheduled meetings a year and that minutes are released three weeks after the policy decision; re-read 2026-09-14)
- [3] Federal Reserve Board: September 16-17, 2025 FOMC meeting (official meeting page collecting the statement, implementation note, projections materials and press conference transcript for that meeting; read 2026-09-14)
- [4] Federal Reserve Board: FOMC statement, September 17, 2025 (official policy statement marked for release at 2:00 p.m. EDT; target range lowered by 1/4 percentage point to 4 to 4-1/4 percent; “Voting against this action was Stephen I. Miran, who preferred to lower the target range … by 1/2 percentage point at this meeting”; read 2026-09-14)
- [5] TradingView: 4 Stages of Price Delivery (ICT Concepts), community idea by Road_2_Funded, Education, July 2024 (unofficial third-party publication; lists consolidation, expansion, retracement and reversal; carries TradingView’s own non-advice disclaimer; read 2026-09-13)
BestProps is not affiliated with The Inner Circle Trader, YouTube, Google, the Federal Reserve System, TradingView or the author of the TradingView idea, and no source listed here endorses this article, this site or any setup. Liquidity, sweep, displacement, market-structure shift, fair value gap, volume imbalance, consequent encroachment, premium and discount, optimal trade entry, unfinished business, Venom and the 2022 model are used on this page only as descriptive study terms; none is presented as official, tested or free of repainting, and nothing here was replayed or measured. No performan