
Key takeaways
In the June 21, 2025 episode of his Storytellers series, ICT reviews the September NQ futures contract and narrates how he framed Friday, June 20, 2025.
Read the full summary
In the June 21, 2025 episode of his Storytellers series, ICT reviews the September NQ futures contract and narrates how he framed Friday, June 20, 2025. His stated thesis was bearish: price could run above Wednesday’s daily high and into the upper part of a higher-time-frame imbalance, then deliver lower into the week’s new-week opening gap, which he said at 21:46 had already been laid out in a pre-session video posted the same morning. He describes selling the 9:30 rally and pyramiding into the high, and then at 31:07 says the one thing he got wrong was his line that price would not trade below the new-week opening gap low: intraday wicks did cross it, even though the candle bodies did not. Every price level, entry and result below is ICT’s own account of what he saw and did; the transcript cannot independently confirm fills, size or profit.
How we researched this article
BestProps used document-based research from primary firm sources, checked September 24, 2026. The complete source list, scope, limitations, and commercial-state record appear near the end of this article.
Educational note: This is a source-led recap of a teaching video, not financial advice and not a recommendation to trade NQ futures or any other product. Futures are leveraged and can move against a position quickly. A retrospective narration of one session does not establish that a pattern will repeat, that a stated result is representative, or that a method is profitable.
What the recording is, and what date it covers
The recording mapped to this article is 2025 Storytellers Series – Daily High To Low June 21, 2025, credited to the channel The Inner Circle Trader and published on 2025-06-21 at 12:58:50 (UTC-07:00), which was a Saturday. Its own opening lines remove any doubt about the session under review: at 0:16 ICT says the episode covers the September contract for NQ for June 21st, 2025, "for Friday’s trading, June 20th". The June 21 date is the publication date, not a session date.
This recap is grounded in a timestamped transcript of the full 45-minute-30-second original audio, produced by automatic speech recognition (whisper-large-v3-turbo) rather than by human-checked captions. The speech recognizer renders ICT’s shorthand inconsistently — the imbalance labels come through as variants such as "SIBI", "BISI" and occasional garbles, and Wyckoff is spelled more than one way — so terms and numbers below are given as the transcript supports them and should be confirmed against the video. No chart was viewed for this article: the levels discussed are the ones ICT describes, not ones measured here.
What ICT says he said before the session
ICT opens on the daily chart and works from an earlier, shorter video he says he published on X at 4:50 a.m. Eastern on the Friday morning, hours before the 9:30 cash open — a timing detail he stresses, because it means the call could not have been made with delayed data or after the fact. He tells viewers the link is in the video’s comment section and repeatedly asks them to watch that clip themselves rather than take his word for it (4:34).
The content he attributes to that earlier clip, and repeats here, is:
- The market was inside a defined range and would need some kind of event to break out of it; the event he had in mind was military-related, out of the Middle East (2:47).
- Because the session ran into a weekend, when nobody can step away from risk, he did not expect fresh buying to carry price to new highs (3:18).
- He expected price to overlap a specific daily wick and the week’s new-week opening gap, and he said at the time that he did not expect price to trade below the new-week opening gap low (10:27 and 10:41).
- He was not interested in doing anything before the 9:30 open (11:44).
The geopolitical reasoning is ICT’s own interpretation of the backdrop, not a verified cause of the session’s price action. The operational part is narrower: he marked a range, a level he expected to be swept, and a level he expected to hold, and he says he published those before the open. He repeats that he does not edit or delete posts on X, so the 4:50 a.m. clip and its accompanying post stand as his record (33:03). That clip is not reproduced in this review, and its exact contents are not verified here; what is verified is that this recording attributes those statements to it and that a first-party X post announcing this episode links the same video.
The reference levels behind the bearish thesis
Most of the episode is spent on the higher-time-frame map, because that map is what the intraday decisions are hung on.
Wednesday’s daily high. At 11:29 ICT identifies the high he is watching as Wednesday’s daily high, noting that Thursday was a holiday, so Friday’s reference day of liquidity was two days old. (Thursday, 19 June 2025 was Juneteenth, when the US equity and futures exchanges are closed, which is consistent with that remark.) He describes the intended sequence as running above that high to stop out shorts and to draw in breakout buyers, and says that is exactly the kind of move he would want to see if he were bullish — which he says he was not.
The February 24 SIBI high. The level he calls the heart of the setup is the high of a February 24, 2025 daily sell-side imbalance / buy-side inefficiency on the September NQ chart, which he calls a watermark he has been referencing for months (20:29 and 23:01). He also marks the one-hour buy-side imbalance / sell-side inefficiency that sits above the same area, together with its upper quadrant, its consequent encroachment (midpoint) and its lower quadrant, and treats the overlap of those references with the February 24 level as the confluence he traded from (23:52).
The segment of the daily chart he told students to work in. The section he highlights is drawn from Wednesday’s consequent encroachment of its daily wick down to that candle’s close (16:54). His argument for narrowing the focus is pedagogical: a newer student cannot trade a full daily range, but can learn to look for one familiar setup inside a small, pre-defined region.
Market structure and arrays. On the one-hour chart he separates long-term, intermediate-term and short-term highs and lows, and credits that classification to Larry Williams, saying it has served him since 1995 (12:21, and again at 39:52). His stated rule of thumb is that long-term and intermediate-term highs and lows containing large imbalances are higher-probability references than short-term ones (13:29). He describes casting those references forward and back across roughly a 120-day window and calls the resulting set premium and discount arrays, or PD arrays (14:32). He also says explicitly that he is not trading supply and demand, which he calls a stepping stone (14:09).
How the session was narrated as it unfolded
From here the episode is a walk-forward through Friday. ICT describes the opening rally above Wednesday’s high as a Judas swing — his term for an initial move in the wrong direction that builds premium before delivery the other way (25:30). At 20:20 he says his short entry was above the Wednesday daily high, inside what he reads as an inversion fair value gap, and that the reference he was keying off was the February 24 SIBI high. The lower-time-frame detail he cites includes a rejection block, a consequent encroachment level, and an order block he describes as the change in the state of delivery (21:07, 21:20). He states that he was watching live data rather than market replay (21:32).
The read he teaches off that entry is about where candle bodies are accepted: when he is bearish, he wants to see bodies respecting the lower half of the reference and no bodies trespassing into the upper half (26:41). He points to the first fair value gap presented between roughly 9:31 and 10:00 a.m. as another forward reference (26:25), and then describes price breaking down out of the one-hour imbalance and picking up pace (27:02).
The one numeric reference level he states on screen is the prior regular-trading-hours close, which he reads as $21,961.75 for June 19, 2025 (27:29). With the Friday open above that close he calls the difference a premium gap, expects a pullback to try to close it, and then narrates the sequence he says followed: trade up into the level, sell off, consolidation around consequent encroachment, break lower, gap closure (27:38 to 28:03). From there he tracks the draw to a minor sell-side liquidity level and then to the February 24, 2025 daily SIBI low (28:11), a rally back into the segment that corresponds to Wednesday’s closing price, and a second-stage redistribution into the new-week opening gap that he says arrived at about 11 a.m., six hours after the pre-session video.
None of that sequence is measurable from a transcript, and the entry price, fill quality, contract size, stop placement and result are not stated in numeric terms anywhere in the recording. They are ICT’s retrospective description of his own trading, and they are attributed as such here.
The opening-range-gap observation and the 70% claim
One teaching point is stated as a probability rather than a description. At 29:31 ICT says he teaches a 70% likelihood that the consequent encroachment midpoint of the opening range gap is reached by 10:00 a.m. Eastern, and then says the chart reached it at 9:59 (29:51).
That percentage is his claim inside the lesson. The recording supplies no dataset, no definition of the sample used, and no test protocol, and repetition of the claim in the episode is not evidence for it. Treat it as an assertion to be tested with your own data, or not at all.
Where the stated forecast missed
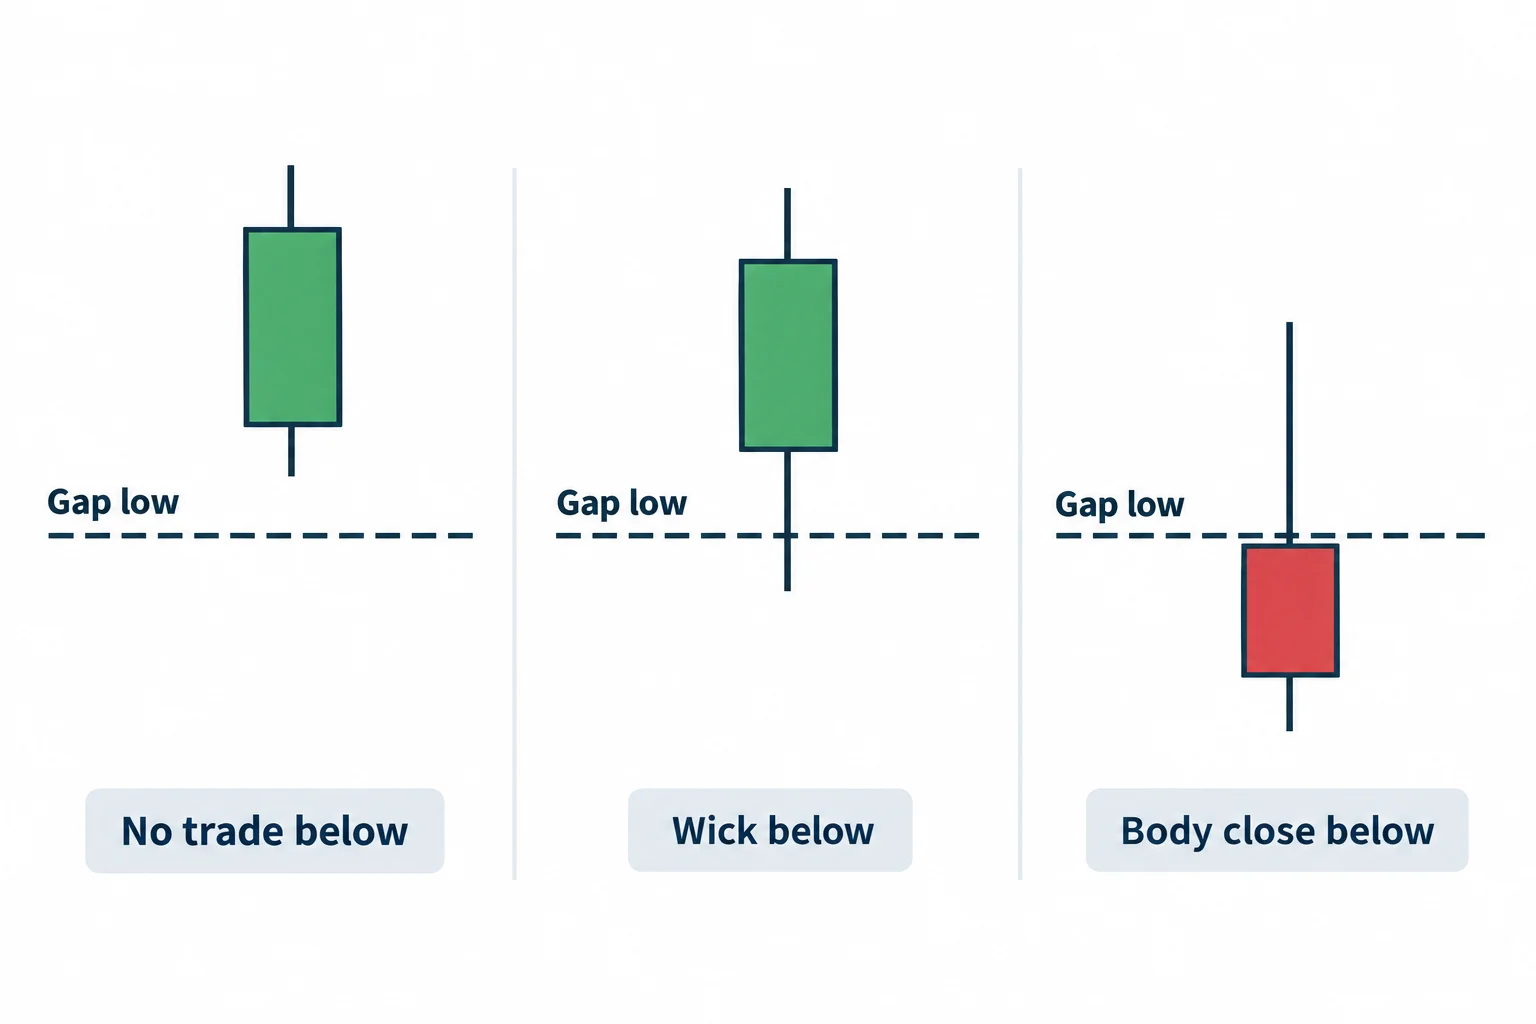
The most useful passage in the episode for a sceptical reader is the one where ICT contradicts himself on purpose. At 31:07 he says the thing he got wrong was the statement that price would not go below the new-week opening gap low. He then points out that wicks did trade beneath it, twice, and argues that the candle bodies never established acceptance below the level, adding that the market then spent time inside the gap rather than continuing lower (31:14 to 31:33).
He also reports that the market came back up to the February 24 SIBI low again and closed between the new-week opening gap high and that level — in his phrase, in no man’s land (31:42).
The transferable lesson is about the wording of a forecast rather than about the market: "will not trade below", "will not close below" and "no candle body below" are three different conditions, and only a precisely written one can be scored honestly afterwards. Whether the wick-versus-body distinction salvages this particular call is a judgement call ICT explicitly leaves to the viewer.
Reported execution, the recording glitch, and the limits of this source
ICT summarises the trade at 32:54 as a market maker sell model in which he sold the high and pyramided into the high, and at 33:40 he frames the session as the high and the low of the day being called in advance. He also says he had to leave the screen: an unannounced 11:00 a.m. appointment for his youngest son meant he scaled most of the position off and kept one contract on for the new-week opening gap high, and that he could not manage the trade from his phone while driving (22:24, 22:35, 31:55).
He is also explicit that the visual record is incomplete. He says his screen-recording software froze the chart during the session while still capturing cursor movement, so part of the recording looks like a static screenshot rather than continuous live price, and that it had happened repeatedly that month (18:44 to 20:13). Two consequences follow. First, this article cannot show or verify any chart feature, because neither the transcript nor this review included a visual inspection of the video. Second, an uninterrupted record of the execution and its outcome does not exist in the source as described, so the reported entry, scale-out, remaining contract and result remain unverified claims.
Two further assertions in the closing third are worth labelling as claims rather than findings. ICT says that he does not trade in front of an audience because the prices he works with are so specific that a large crowd trying to fill at the same level would distort his own fills, citing a past live stream with 15,000 concurrent viewers that peaked near 21,000 and a real-money account where his limit orders went unfilled while somebody else’s filled, leaving him exiting within five handles of the high rather than at it (36:47, 37:31, 38:27). He also spends time answering people who say his concepts are rebranded from earlier authors, credits Larry Williams for market structure, and challenges anyone to show his PD arrays taught elsewhere (39:52, 41:26). Those are disputes about provenance and are outside what a transcript can settle; nothing in this article repeats them as established fact.
Journaling and practice lessons from the episode
Interspersed with the chart work is the part that transfers most easily to any method. At 5:26 ICT recommends writing the explanation you would have given before the outcome was known — annotating the chart as though the sequence were already certain — and he says the value accumulates because the same signatures recur, which is how experience gets built without buying it. He argues that mentorship, books and signal services substitute someone else’s decision for your own (5:59), and that a newer trader should work one, two or at most three setups rather than chasing every concept on offer (6:46).
Reduced to a routine that a funded-account trader could actually keep:
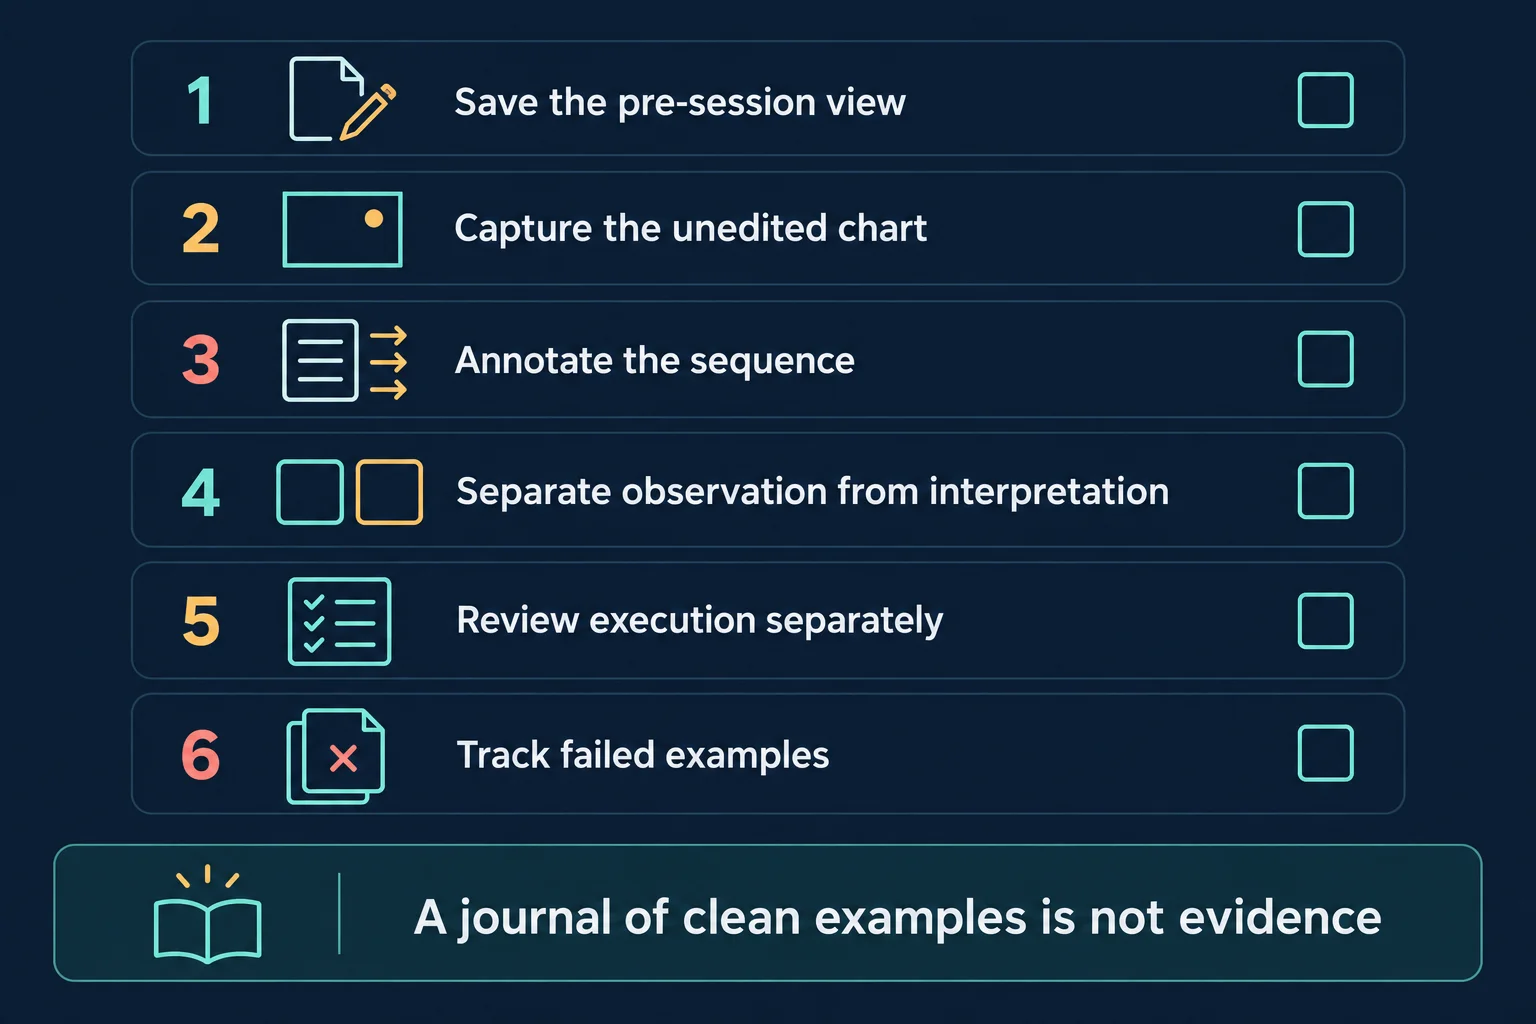
- Save the pre-session view. Write the thesis in a timestamped note before the open, so the version of your thinking at the time is the version on file.
- Capture the unedited chart. Keep the raw record of the session — and, as this episode illustrates, check that a recording actually captures live price and not a frozen frame.
- Annotate the sequence. Mark the levels you used and why, in the order they mattered.
- Separate observation from interpretation. What price did is one column; what you thought it meant is another.
- Review execution separately. Follow your stated rules even when the position is scaled or abandoned for reasons outside the market, as happened here.
- Track the failed examples. Keep the sessions where the expected path never formed, including the ones where a stated boundary was pierced even if only by wicks.
None of that is a strategy, and none of it should be scored as one. What it does do is make a forecast falsifiable: the episode is only usable as teaching material because its own author stated, on the record, the one condition that did not hold.
Sources and further reading
Three references sit behind this article, and each is used only for what it states.
[1] The recording itself — 2025 Storytellers Series – Daily High To Low June 21, 2025. Read on 2026-09-14: the watch page returned the title above, the channel The Inner Circle Trader, a publish and upload time of 2025-06-21T12:58:50-07:00, a runtime of 2730 seconds (45:30), and a playability status of OK. The runtime matches the duration of the audio that was transcribed for this recap, which supports the source identity. This is the primary source: everything attributed to ICT above comes from it. Its captions were not used — the transcript is a machine transcription of the audio — and playback inside another site was previously tested and refused by the player, so the link is offered as a watch card rather than an embed.
[2] ICT’s own announcement of the episode — post on X, 21 June 2025. Read on 2026-09-14: the post is live and its text carries the episode title together with a shortened link to the same video. It is the first-party record that the episode was published on the date its title states. It is not evidence for any market claim, and the separate 4:50 a.m. pre-session video ICT refers to in the episode is a different post that this article does not reproduce or verify.
[3] The contract family — CME Group, Nasdaq futures and options. Read on 2026-09-13, when the page described E-mini and Micro E-mini Nasdaq-100 futures as the exchange’s access to the Nasdaq-100 benchmark and listed quarterly contract months. It is here only to identify the product the September NQ contract belongs to; it is not a source for anything ICT says. A re-read on 2026-09-14 was refused by the site’s automated-access block, so the content above stands on the 2026-09-13 read.
Watch the full 45-minute recording on YouTube
The episode is a first-party upload on the channel The Inner Circle Trader and is public. It cannot be played inside another website — a previous embedding test on this site returned the player’s own message, "Playback on other websites has been disabled by the video owner" — so no blank player is left here. Watch it on YouTube, where the pre-session X video ICT refers to is linked from the video’s own description or comment section.
Watch 2025 Storytellers Series – Daily High To Low June 21, 2025 on YouTube ↗