
Key takeaways
The Inner Circle Trader reviews the US Dollar Index, EUR/USD, GBP/USD and the March 2025 E-mini Nasdaq-100 contract in a 47 minutes 48 seconds YouTube recording with 88,675 views, focusing on a planned NQ setup built around a discount opening range gap, sell-side liquidity below short-term lows, a return through the gap and relative equal…
Read the full summary
The Inner Circle Trader reviews the US Dollar Index, EUR/USD, GBP/USD and the March 2025 E-mini Nasdaq-100 contract in a 47 minutes 48 seconds YouTube recording with 88,675 views, focusing on a planned NQ setup built around a discount opening range gap, sell-side liquidity below short-term lows, a return through the gap and relative equal highs as the draw. ICT defines the gap as the nine thirty a.m. Eastern open below the prior regular-session settlement, says he wanted 21,508 swept before 21,615 and then Tuesday’s roughly 3 p.m. relative equal highs, and describes buying below the first presented fair value gap using his undisclosed IMP24 framework and power three sequence, although he admits moving his stop too close and being stopped out. His forex triad requires EUR/USD bullishness, GBP/USD confirmation and opposing Dollar Index weakness, with GBP/USD reaching buy-side liquidity before EUR/USD, while high-resistance liquidity conditions call for wider stops, lower leverage and patience because inefficiencies may be overshot. He recommends capturing five-minute, 15-minute, hourly, daily and weekly charts and separating the presenter’s claims, visible chart evidence and personal interpretation. The automatic transcript cannot verify chart prices, order types, fills, position size, risk, account results, third-party livestream posts or ICT’s claimed market-delivery algorithm, and the chart itself was not reviewed, so the reported execution and ambiguously recognised 21,694 level remain unconfirmed claims rather than verified performance.
How we researched this article
BestProps used document-based research from primary firm sources, checked September 24, 2026. The complete source list, scope, limitations, and commercial-state record appear near the end of this article.
ICT dates the session to Wednesday, February 5, 2025, and tells viewers at 0:48 to watch his February 4 review first because several levels were established there. Upload and session dates are different things: this recording was uploaded on 5 February 2025 at 19:49 Pacific time, which falls on 6 February in UTC.
Everything below comes from an automatically generated transcript of the recording’s own audio, not from YouTube captions and not from watching the chart. Levels and times are reported as the speaker says them, as rendered by the speech recogniser; where a term or a number is ambiguous that is flagged rather than smoothed over. The summary reports ICT’s interpretations as his own and does not treat any of them as verified market mechanics.
ICT 2025 Forex Review of Dollar Index Correlations
At 1:23 he starts on the Dollar Index, carrying a range from the weekly chart down to the daily and watching its midpoint, which he calls consequent encroachment. His anticipated path was for that range to behave as an inversion fair value gap and for price eventually to reach sell-side liquidity below a short-term low. He notes the index did not move below the referenced gap during the session he is reviewing.
On the 15-minute and five-minute views he describes price working back and forth in the upper half of that inversion gap. He sets out two ways of engaging it: wait for bearish displacement and then use the first lower-time-frame fair value gap, or, only with more conviction and experience, position nearer the upper portion before the inversion has proved itself.
The forex section moves to EUR/USD and GBP/USD at 3:57. He says GBP/USD reached his previously identified buy-side liquidity objective first, with EUR/USD following later at 4:02. He presents sterling as the relative-strength leader and describes the euro as moving in sympathy with it while the Dollar Index weakened.
ICT Three-Market Forex Comparison
His general point at 8:16, which he calls a three-market triad, is that a single currency pair is not enough on its own. For a bullish EUR/USD read he wants all three conditions visible: the pair itself bullish, a closely correlated pair such as GBP/USD confirming, and the Dollar Index showing the opposing weakness. He adds that futures do not require the same multi-market step, since one instrument and its index are largely sufficient there.
ICT 2025 Lecture on High-Resistance Liquidity
From 5:53 onward he points to overlapping ranges, repeated whipsaws and imprecise reactions, and labels the market a high-resistance liquidity run at 6:11. In his description, inefficiencies in this condition are overshot rather than stopped on precisely, and he argues that very tight stops are likely to be taken out. He refers to wider stops, lower leverage and more patience, then states at 11:53 that he was in fact stopped out during his Nasdaq execution.
That admission matters more than the general advice. A wider stop raises the amount at risk unless position size is reduced to match, and nothing in the transcript shows that the approach produces a repeatable or positive expectancy.
ICT 2025 Lecture on the NQ Gap and Sell-Side Sweep
The Nasdaq section begins at 10:56, where he revisits what he calls Tuesday’s first presented fair value gap, extended to the right from February 4. On the 15-minute chart he says the market traded down into that area, wicked outside it, and closed in its upper half, which he reads as a sign of higher prices to come.
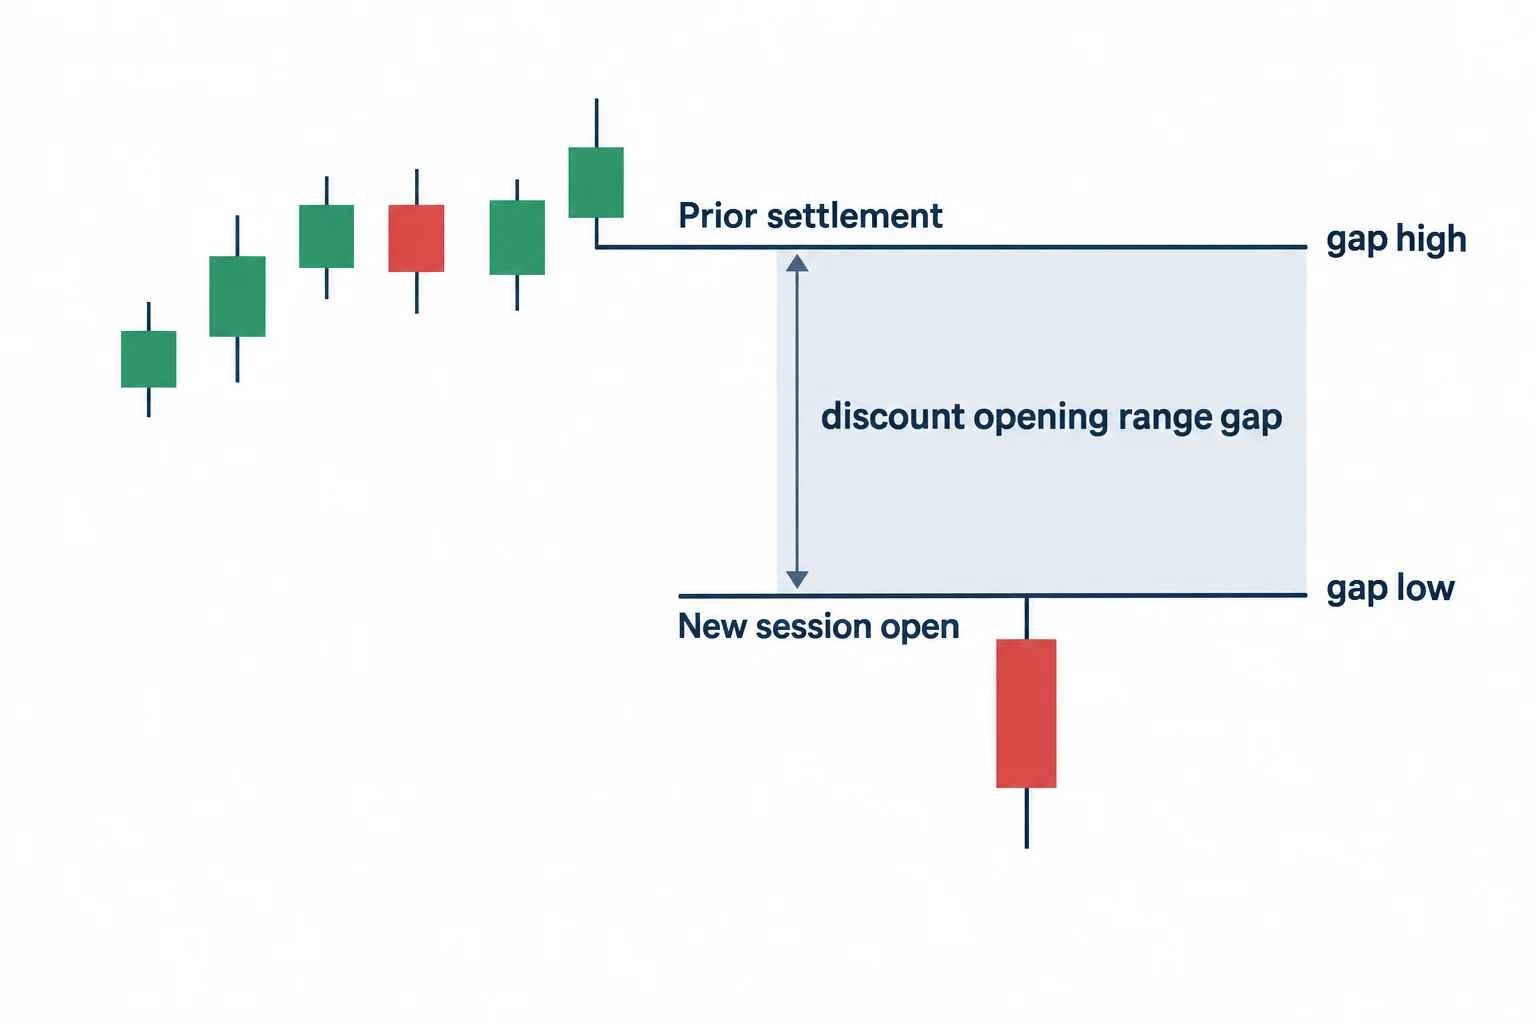
The detailed one-minute explanation starts at 22:57, on the March 2025 delivery contract with the chart set to regular trading hours. He defines a discount opening range gap as a 9:30 a.m. Eastern open below the previous regular-session settlement, with the prior settlement as the gap high and the 9:30 print as the gap low. At 24:11 he describes a drop through a short-term low that retail traders would call a bear flag, and says his own read was that it trapped those sellers before a reversal higher.
His stated bullish sequence combined several references:
- a lower regular-session open relative to the previous settlement;
- sell-side liquidity beneath relative equal lows;
- the earlier fair value gap as a discount area;
- an expected move back through the opening range gap; and
- relative equal highs above price as the draw on liquidity.
At 25:38 he divides the discount opening range gap with a fib drawn from the settlement to the open and reads candle bodies and wicks against the midpoint. At 26:15 he says he was stopped out on an entry after he raised his stop too close to price.
Further on he names a draw on liquidity at 34:53 and again at 39:25. The transcript renders that level as 21,694; the speech recogniser is not reliable enough on digits to treat the exact figure as confirmed, and he also refers to relative equal highs without stating a price for them.
ICT Levels Shared Before the NQ Session
From 17:53 he explains that he went into another trader’s livestream chat that morning and posted the logic he intended to use on the Nasdaq daily range, on the argument that a live chat cannot be edited after the fact. He states the sequence at 18:50: he wanted minor sell-side at 21,508 taken first, then 21,615, then the relative equal highs from around 3 p.m. Tuesday. He restates it at 46:32 while showing what he presents as a clip of that chat.
At 40:45 he says he used a framework he calls IMP24, which he declines to teach in the recording. At 42:10 he says he would buy the sweep beneath 21,508 expecting the gap to close and price to continue into buy-side liquidity; he shows entries he describes as grouped below the first presented fair value gap at 43:44, execution labels at 44:29, and a stop raised as the move extended at 44:42, concluding at 45:10 that price reached the level he had described. He calls the sequence his “power three” at 42:26.
Two limits apply to all of that. First, the transcript can confirm that he makes these claims and narrates these actions; it cannot confirm the external livestream or messaging record, the exact posting time, the chart prices, the order types, the fills or any account result, because none of those was supplied for independent verification. Second, screenshots and labels shown inside a recording are the uploader’s own material. A reported trade is not a verified outcome and is not an instruction to copy it.
ICT 2025 Lecture Claims About the Algorithm
A large part of the recording is an argument rather than a lesson. At 13:30 he states that the markets are fully manipulated and delivered on a time-based mechanism he treats as scripted, and he presents the morning’s sequence as evidence of what he calls his authorship at 22:36. He also says at 37:52 that traders can be profitable with ordinary money management but that he wants what he calls freakish precision.
Those are the speaker’s interpretations and his own characterisation of his method. The transcript does not establish a central algorithm, a fixed delivery mechanism, or that any specific level must be respected, and the recording’s own performance disclaimer points the same way. Read the argument as a claim to evaluate, not as a result.
How to Study the ICT 2025 Lecture
A workable approach is to separate the observable references from the broader claims. On a regular-trading-hours chart, mark the prior settlement, the 9:30 a.m. Eastern open, the first presented fair value gap, and any relative equal highs and lows, then record how price behaved around each without assuming in advance that any one must hold. At 10:12 he recommends taking screenshots across the five-minute, 15-minute, hourly, daily and weekly views of each instrument you trade, which is a reasonable way to keep context consistent and reduce hindsight selection.
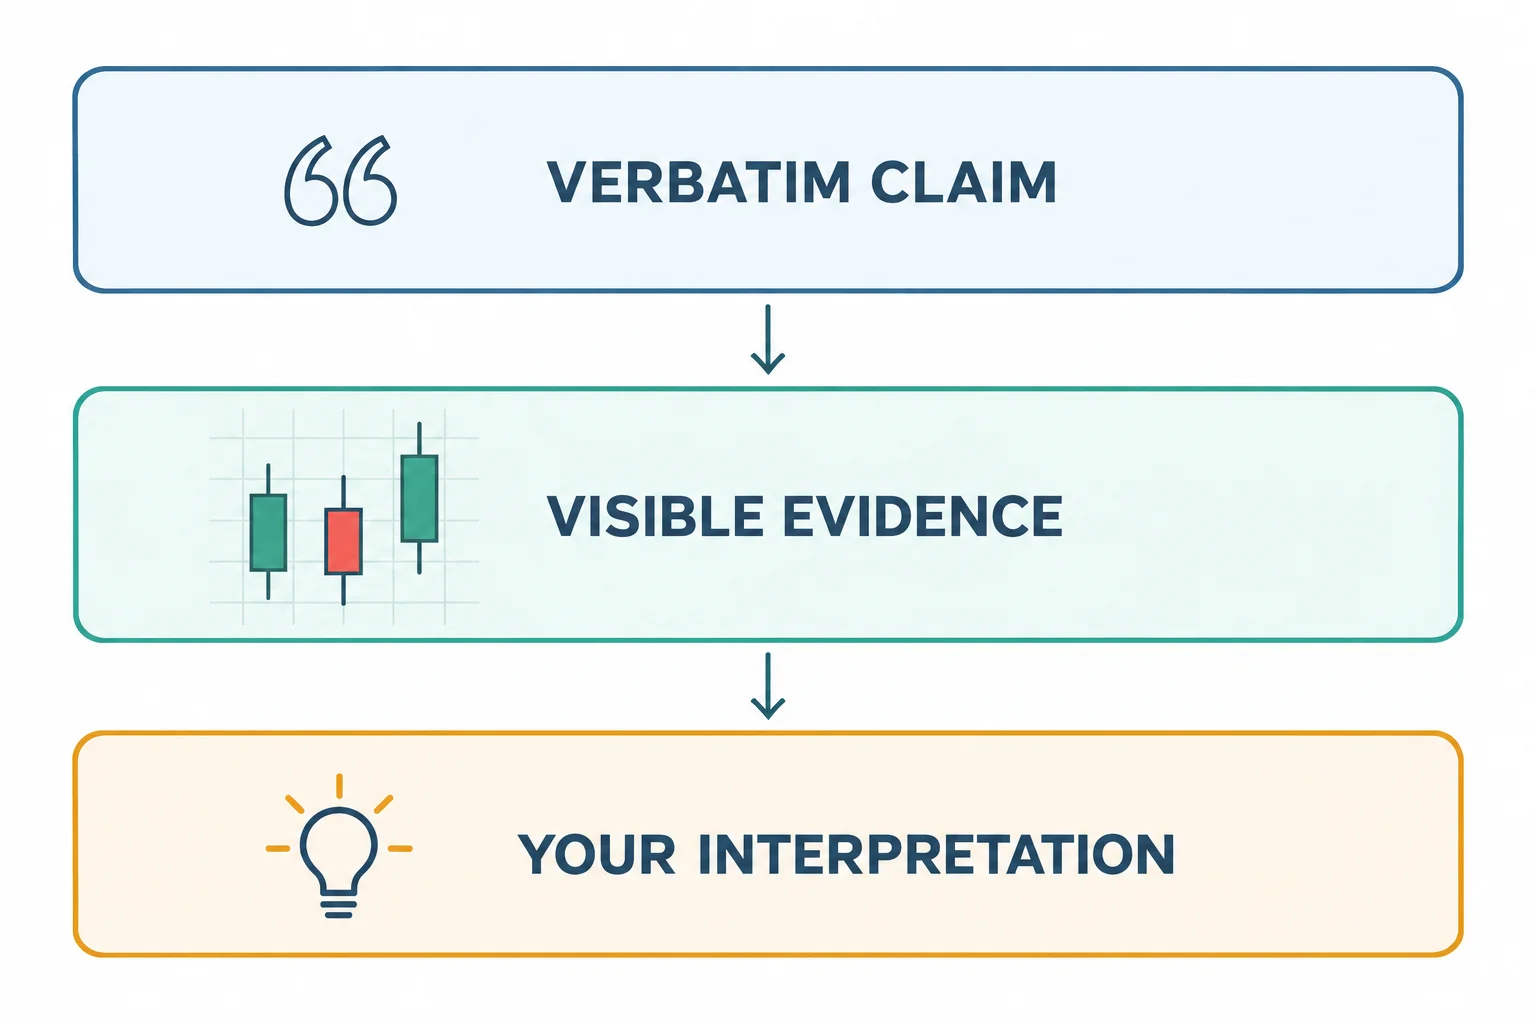
Then keep three layers apart: what he says, what the chart visibly shows at that moment, and your own conclusion. The line between the second and third is where most recaps of recordings like this go wrong.
ICT 2025 Forex and NQ Lecture Video
The recording this article is grounded in is 2025 Lecture Series – Forex & NQ Review 02/05/2025, a public upload on the channel The Inner Circle Trader whose watch page reports 88,675 views, a local upload timestamp of 5 February 2025 at 19:49:28 Pacific time (03:49:28 UTC on 6 February 2025) and a runtime of 2,868 seconds, or 47:48, when read on 14 September 2026, with a normal playability status and no unlisted flag. Every timestamp link in this article points into that recording; the transcript behind them is an automatic speech recognition of its audio rather than human-verified captions, and the chart itself was not viewed.
Watch the original lesson on YouTube
The video cannot be played inside another website: when its embedded player was opened and clicked from a BestProps origin on 14 September 2026, the player itself reported “Playback on other websites has been disabled by the video owner.” and settled on a “Watch on YouTube” prompt, with no duration and no playback progress reported. That message is the reason no embed is reserved or left blank here; the recording itself is available directly on YouTube.
Watch 2025 Lecture Series – Forex & NQ Review 02/05/2025 on YouTube ↗
ICT 2025 Forex and NQ Review Sources
Four references support this article: the first-party recording, the regulation whose prescribed warning text appears in its description, YouTube’s own documentation of the uploader setting that blocks the embed, and the index provider’s page for the instrument the article calls NQ. None of them is a substitute for watching the chart, and no source here was used to assert a price, fill or result.
What the ICT Transcript Can Establish
The source material behind the timestamps is a local automatic speech recognition of the recording’s full audio, not YouTube captions and not a human-verified transcript. Recognised spans include “fair bank app” and “buy-sell equity pool”, which in context correspond to fair value gap and buy-side liquidity pool, and “sell sign and bounce buy sign and efficiency”, which reads as an imbalance-and-inefficiency pair. Terms are normalised only where the surrounding words support it, and the two price levels are flagged where the digits are not certain. Automated timestamps are approximate to the segment; each link points at the pass being described.
The transcript cannot establish unseen chart geometry, order types, fills, position size, risk or any account outcome, and it cannot verify the external livestream and messaging records cited inside the recording. Where this article says ICT did something, it means the recording says he did it.
ICT Editorial Note on Replaced Material
An earlier version of this page stated that the searches BestProps ran contained no confirmed video page for the February 5 session, no transcript, runtime, publication date or timestamp list, and that the original recording had not been found. That framing is false against the first-party upload mapped to this article, and it has been removed rather than annotated. What replaced it is a transcript-grounded review of what the recording actually contains: the Dollar Index and correlated-forex discussion, the high-resistance-liquidity remarks including his own admission of being stopped out, the discount opening range gap framing on NQ, the levels he says he published in another trader’s live chat beforehand, and the argument he makes about algorithmic delivery. Claims that could not be established from the transcript were left out, including any net result, and the one level the recogniser renders ambiguously is labelled as such. Nothing about the retained images, their captions or their alt text was changed.
ICT Recording and Watch Page Details
Re-read on 14 September 2026, the watch page for the mapped upload carries the title above, attributes it to the channel The Inner Circle Trader, reports 88,675 views and 2,868 seconds of runtime, and returns a normal playability status with no unlisted flag.[1] Its description reproduces a United States Commodity Futures Trading Commission risk disclaimer headed with CFTC Rule 4.41. The rule provides that performance of a simulated or hypothetical commodity interest account or transaction may not be presented unless accompanied by a prescribed statement, prominently disclosed in immediate proximity when the presentation is not oral.[2] Nothing here asserts whether that upload or this page satisfies any regulatory requirement, or that any performance shown is verified; the reference is listed because this article warns against reading a recording or a social clip as a promise of an outcome.
ICT Video Embedding Guidance From YouTube
The embedded player for the mapped upload was opened and clicked from a BestProps origin again on 14 September 2026, and the player itself reported “Playback on other websites has been disabled by the video owner” alongside a Video unavailable notice, with no duration and no playback progress reported. YouTube’s help page documents the uploader-side control that produces that state: to stop others embedding a video, the uploader opens YouTube Studio, selects Content, then Details, then SHOW MORE, and unchecks the box next to “Allow embedding” before saving.[3] A blocked embed is an ordinary platform setting, which is why this article links out instead of reserving a player it cannot play. No owner restriction beyond that message is inferred.
What NQ Means in the ICT Review
Nasdaq, which operates the index itself, describes the Nasdaq-100 as concentrating on non-financial sectors and as subject to quarterly reviews and rebalancing.[4] That page identifies the index, not the futures contract. The exchange’s contract specification was not consulted, so no contract month, tick size, session, settlement or margin detail is asserted here beyond the recording’s own reference to the March 2025 delivery contract. A chart label of NQ, an index name and a listed futures contract are treated here as labels to confirm against the source rather than interchangeable terms.
Untested and Unofficial ICT Material
Any ICT, SMC or third-party indicator, script, spreadsheet, note set or social-media summary mentioned by this article or by the material it links to is unofficial unless it comes from the publishing channel’s own upload page, and none is presented as official, tested or free of repainting. No performance test, backtest, win rate, drawdown figure or account result is claimed anywhere in this article, and none of the references above was used to produce a signal, a forecast or a level.
- [1] 2025 Lecture Series – Forex & NQ Review 02/05/2025, The Inner Circle Trader (watch page read 14 September 2026)
- [2] eCFR, 17 CFR 4.41, Advertising by commodity pool operators, commodity trading advisors, and the principals thereof (read 14 September 2026)
- [3] YouTube Help, Embed videos & playlists (read 14 September 2026)
- [4] Nasdaq, Nasdaq-100 Index (index provider page, read 14 September 2026)
Leveraged currency and futures trading involves substantial risk and is not suitable for everyone. This article is educational, reports no outcome from any lecture, indicator or account, and is not individualized financial advice.