
Key takeaways
The Inner Circle Trader’s roughly 29 minutes 6 seconds YouTube lesson reviews the US Dollar Index, EUR/USD, GBP/USD, September E-mini S&P 500 and Nasdaq before presenting Ma Deuce, an advanced inversion fair value gap setup whose hierarchy is more important than the pattern.
Read the full summary
The Inner Circle Trader’s roughly 29 minutes 6 seconds YouTube lesson reviews the US Dollar Index, EUR/USD, GBP/USD, September E-mini S&P 500 and Nasdaq before presenting Ma Deuce, an advanced inversion fair value gap setup whose hierarchy is more important than the pattern. First define a wide higher-time-frame candle’s range, midpoint and lower quadrant, determine premium or discount, expected destination and market structure, then apply the gap only when timing aligns. ICT remained bullish on the dollar and bearish on EUR/USD and GBP/USD, while conflicting index signals required price to break above or below the imbalance range before any trade, with trading inside it linked to overtrading and drawdown. The bearish Ma Deuce example uses a one-minute Nasdaq chart, price above the wider range midpoint, expected downside re-delivery, a retracement into a violated gap, the 8 o’clock period and an 8 thirty employment release, followed by partial profits at the midpoint and lower quadrant and a possible extension to a nearby discount array. The bullish version reverses every condition. The E-mini S&P 500 contract is worth $50 times the index, regular trading hours are documented as 08 thirty through 15 fifteen CT, and no fills, position sizes, costs, sample size, audited results or verified Twitter calls are provided. ICT says the wider daily objective was not reached and accepts the lower level may never be reached, while the CFTC warns hypothetical results may omit loss capacity and poor stop fills and reports about two out of three retail forex traders finish each quarter in the red.
How we researched this article
BestProps used document-based research from primary firm sources, checked September 24, 2026. The complete source list, scope, limitations, and commercial-state record appear near the end of this article.
In ICT Mentorship 2023 – September 08, 2023 Review & ICT Ma Deuce Model, the Inner Circle Trader reviews higher-time-frame conditions across the US Dollar Index, EUR/USD, GBP/USD, the September E-mini S&P 500 contract and the Nasdaq, then spends the second half of the recording on a specific application of an inversion fair value gap that he names the “Ma Deuce” model.
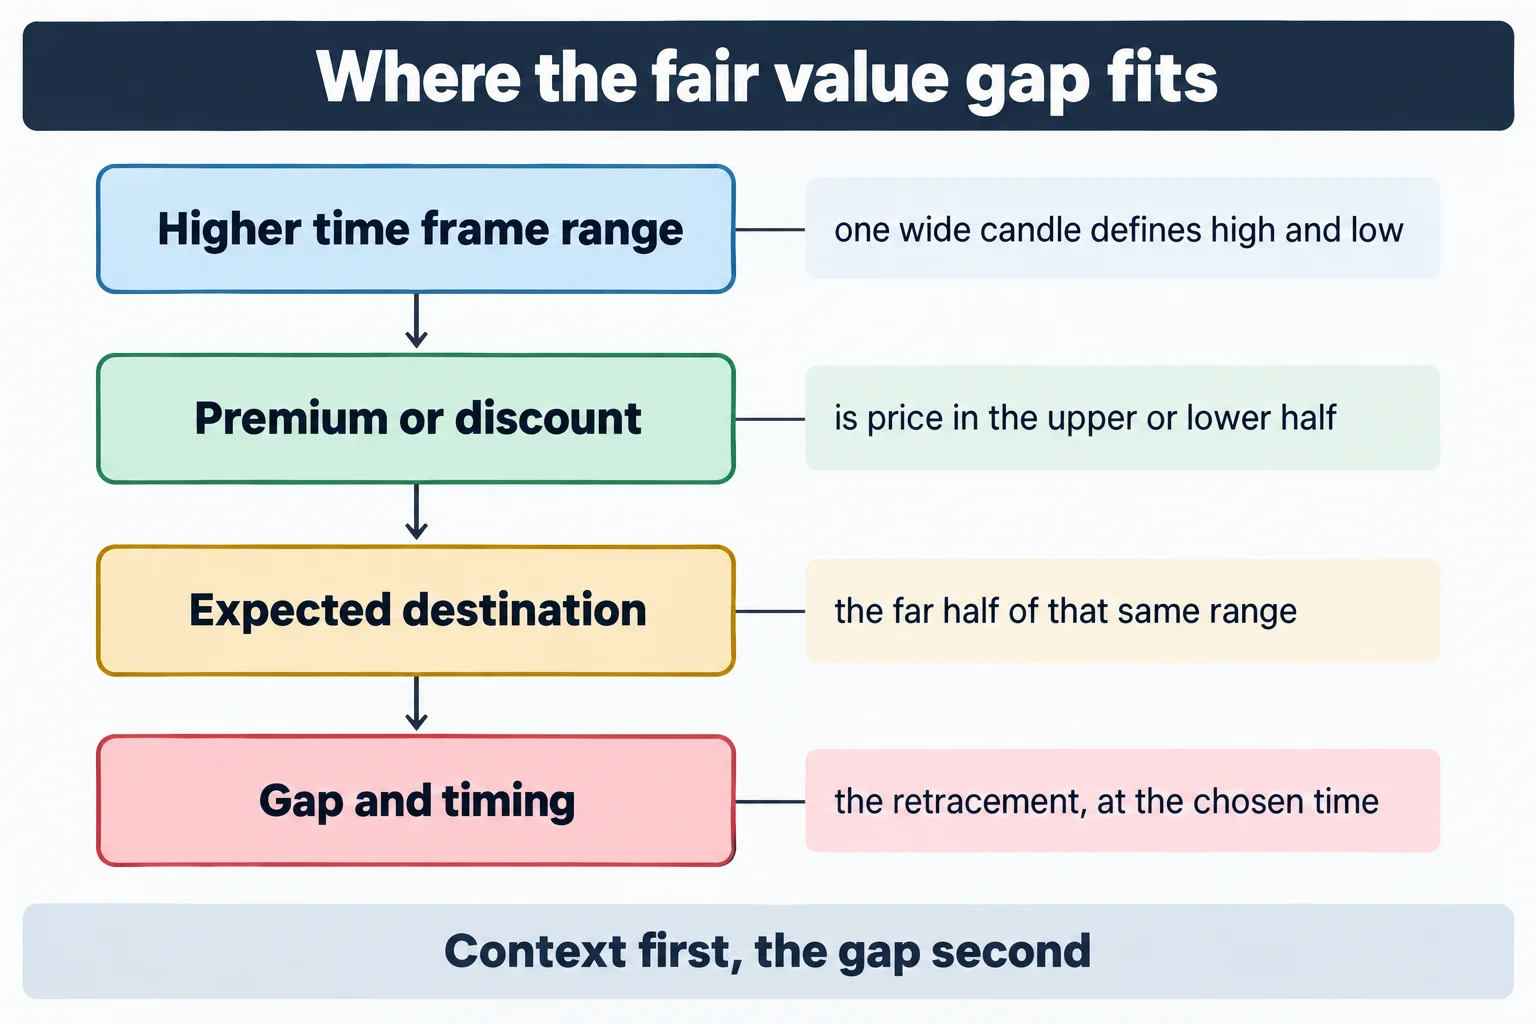
The useful part of the lesson is the hierarchy, not the pattern. The gap only becomes relevant in his framework after the higher-time-frame range, the premium or discount position, the expected destination and the timing are already established. What follows restates his stated analysis against his own timestamped captions. Every chart level is his reading of a screen this article cannot show, and he gives no account statement, sample size or cost treatment anywhere in the recording.
ICT September 2023 Higher Time Frame Review
He opens at 0:36 with the US Dollar Index, saying the buy-side liquidity pool he had been pointing at was reached, that he stayed bullish, and that he was not looking for lower prices on the dollar. From 1:18 he describes the sequence he relies on: sell-side liquidity taken beneath relative equal lows, a fair value gap traded through, then a continued advance into the buy-side levels he had already identified. His conclusion is that dollar strength keeps intermediate and longer-term pressure on EUR/USD and GBP/USD.
For EUR/USD at 1:50 he describes price trading up into an inversion fair value gap, respecting what he calls consequent encroachment, which he defines here as the midpoint of any gap, and then breaking lower to take sell-side out. He notes he had been looking for one further small gap to be reached and that the failure to get there was “indicative of heaviness” – his word for a market he expects to go lower (2:21). He also explains that “fiber” is simply a nickname for the euro.
GBP/USD follows at 2:45. He identifies an inversion fair value gap, says the next draw on liquidity still sits at the sell-side below, and describes a trade into less than half of a small gap as an “institutional order entry drill” (3:05). He states plainly at 3:38 that he is not drawing attention to the smaller time frames for these pairs and is only lending his experience for the bias.
ICT Model View of Range Bound Indices
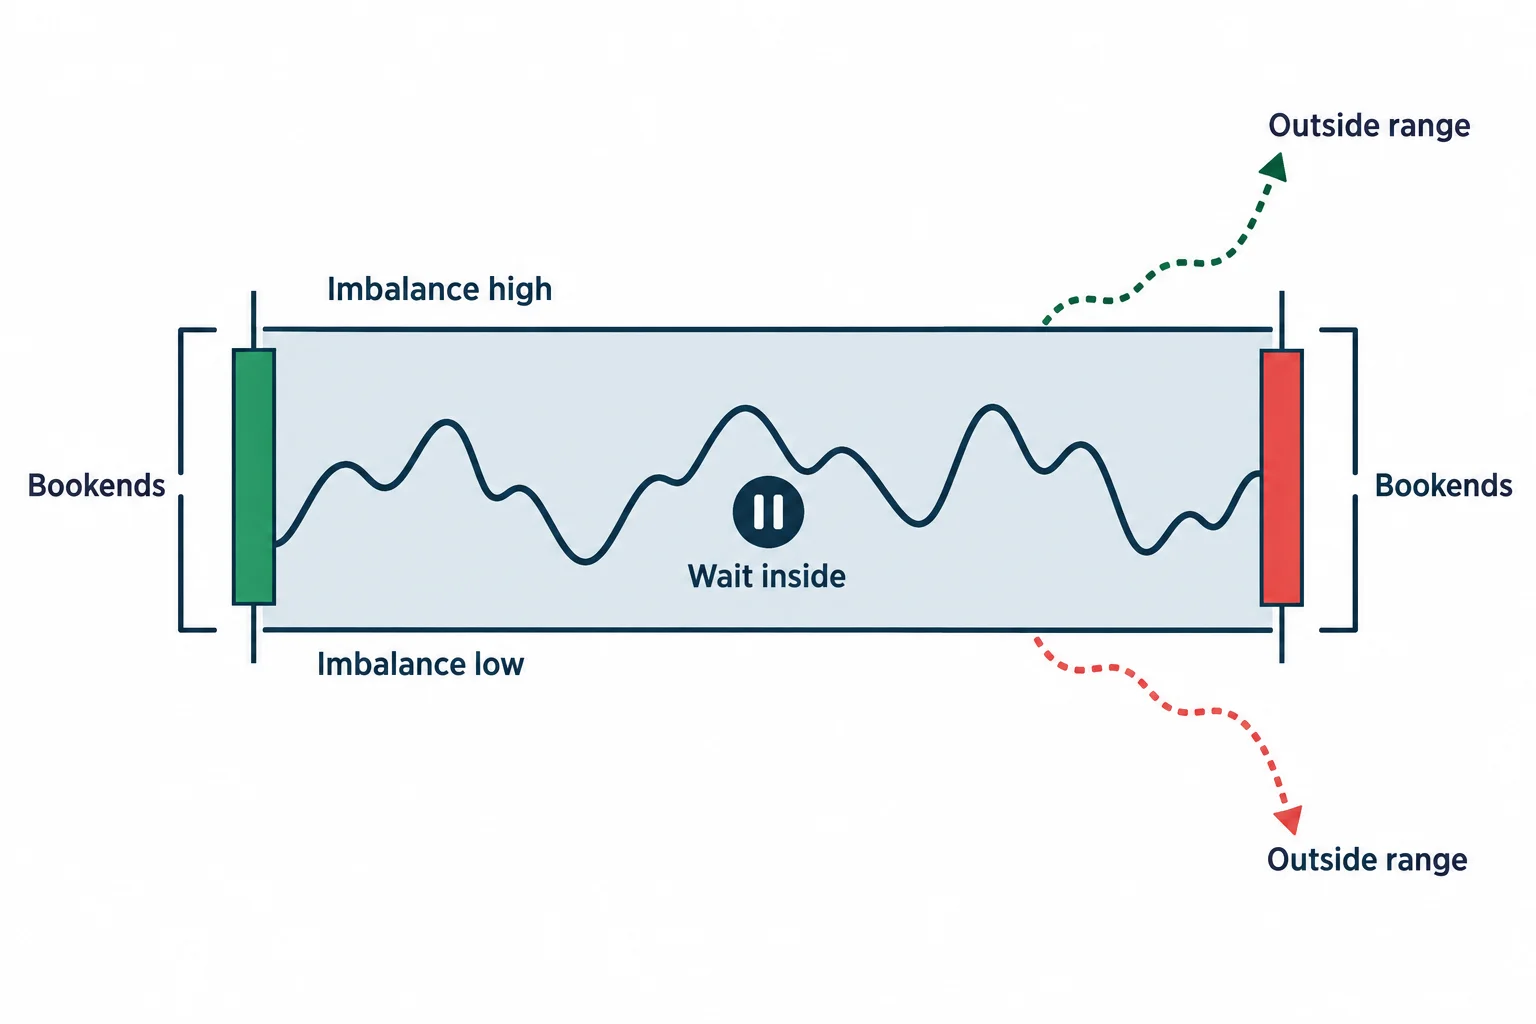
The September E-mini S&P contract comes in at 4:04. He sets up what he calls a buy-side imbalance / sell-side inefficiency between one candle's low and another's high, with a red line marking the midpoint, and says that inefficiency still needs downside delivery. His assessment of the week is that Wednesday afternoon through Friday was difficult unless someone was operating on a one- or five-minute basis, and he frames the condition with what he calls bookends: strong reasons exist for both higher and lower prices, which cuts down the number of high-precision setups (5:21).
His stated rule is blunt: price has to move outside that range, either above the high or below the low of the imbalance, before he is interested in taking any trade on it (6:12). While inside, he says his hands stay away from all asset classes, and he warns that trading inside the range leads to overtrading and drawdown rather than growth (8:17).
On the Nasdaq from 8:49 he again describes conflicting possibilities: price could continue lower through the inefficiency, or rally toward buy-side liquidity. He names a level he says he called in advance on Twitter and concedes the bearish idea could be wrong because the market may simply be accumulating to go higher (10:11). He is explicit that conflicting higher-time-frame evidence is what forces a trader down to scalping time frames.
ICT Model for Turning One Candle Into Levels
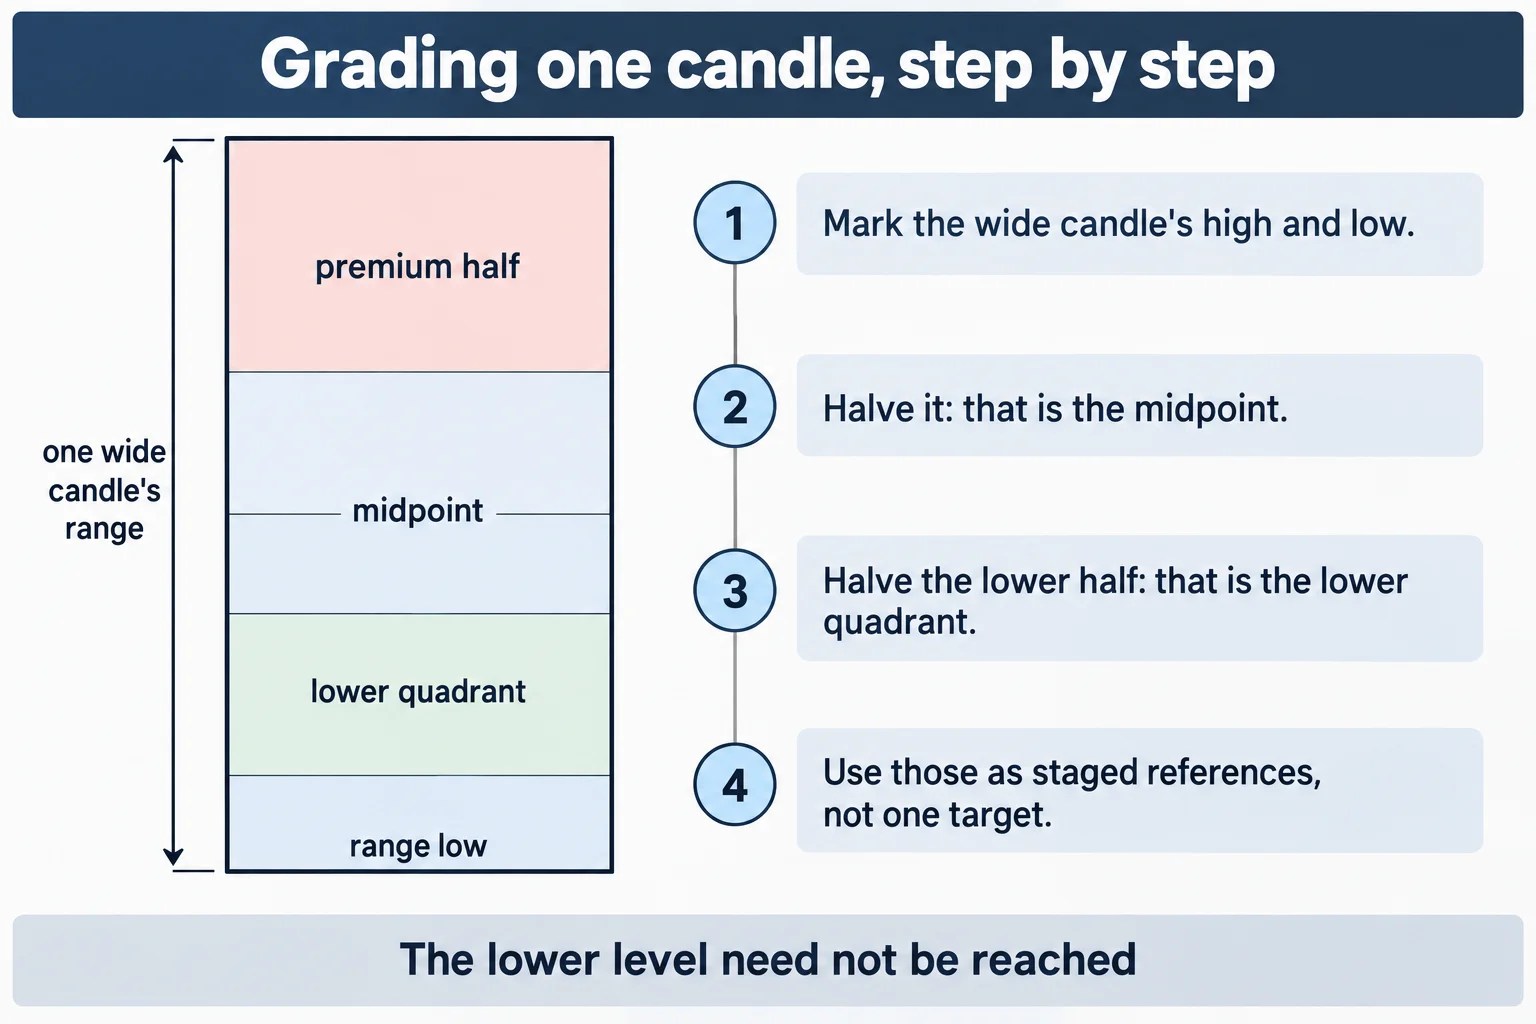
The mechanics of the levels come at 12:39. He takes the single wide daily candle that created the imbalance, halves it to get the midpoint, then halves the lower half to get what he calls the lower quadrant, and uses those as successive reference points. He also distinguishes this from a charting convention he calls quarters theory, saying he is grading an inefficiency rather than applying that framework (13:06).
Two caveats belong on those figures. The transcript renders the Nasdaq levels inconsistently, so the article states the method rather than reproducing a table of values that captions cannot reliably support. And the levels are his markup of a specific candle on a specific chart; the recording shows them, but the article cannot verify their placement, and he states that the ultimate lower objective need not be reached at all (17:49).
ICT Ma Deuce Model Explained
The model lesson runs on a one-minute Nasdaq chart from 14:14, and he begins by rejecting a common description. A fair value gap, in his terms, is not simply a support or resistance zone on a lower time frame; it is an inefficiency, an area a single candle passed through in one direction without any later candle overlapping it, so the range has only been delivered one way (14:27).
He then sets out the conditions that make one particular gap the one to use. Price must sit in the premium of the wider inefficiency, meaning above the midpoint of that range. There must be a disagreement in market structure on the lower time frame, which he says is not the same as a classic higher-high-lower-low reading. The expectation must be that the wide candle gets re-delivered to the downside. And time has to line up: he describes waiting for the 8:00 period and anticipating an 8:30 news delivery rather than acting on the first touch of the gap (19:08).
His described execution sequence is: the retracement into the violated gap, the 8:30 employment release, then a run down to the lower quadrant, then a further push to a nearby discount array, with partials taken at the midpoint and the quadrant rather than one final target (22:55, 23:33). He names the model at 21:38, explaining that “Ma Deuce” is slang for the M2 machine gun and that the name is only how he classifies the setup. His own summary of the content is that it is nothing more than an advanced application of an inversion fair value gap inside a defined premise (27:59).
He also gives the mirror image at 24:14: with a sell-side imbalance / buy-side inefficiency and an expectation of higher delivery, the equivalent gap would form after a low, be retraced into, and then send price higher. Everything in the bearish version is reversed.
What the ICT September 2023 Recording Establishes
As a study in sequencing, the lesson is coherent. He states the wider range before the entry pattern, requires market structure agreement, and ties the timing to a scheduled release. He also does something many instructional recordings do not: at 26:54 he says he told viewers in real time to take profits rather than be greedy, and he notes price went slightly beyond his objective that day but never reached the wider daily objective. He admits at 28:31 that he expects the lower level to be reached at some point and that he is fine with being proven wrong.
What that does not amount to is a verified result. The transcript contains no fills, no position sizes, no costs and no record of the reported Twitter calls; the chart markings the method depends on are only visible in the video. The 8:30 employment release in the example is a real scheduled event, but the idea that a violation of a gap plus a news release reliably produces the described delivery is the speaker's reading of one session. The CFTC's advisory on trading systems sets out the relevant caution directly: hypothetical or reconstructed results may not account for a trader's ability to absorb losses, and a stop-loss order may be executed at a worse price or not at all.[4]
Two context notes are worth keeping. The instrument in the examples is a futures contract quoted at $50 times the index, so one index point is fifty dollars and the handle sizes he discusses are not small in cash terms.[2] And the session settings matter to the analysis he describes: he refers to regular trading hours against electronic trading hours when he discusses settlements and opening-range gaps, and third-party documentation of that distinction describes the reduced 08:30-15:15 CT regular session against the full electronic session.[3] That documentation is unofficial and was not tested here for any trading purpose.
The honest reading of this lesson is that it is a vocabulary and sequencing exercise. It teaches where one trader places a gap in a chain of reasoning, and it repeatedly says that the chain matters more than the pattern. It makes no audited claim about outcomes, and the baseline it should be read against is unflattering: the CFTC notes that about two out of three retail foreign-exchange traders end each quarter in the red.[5]
Watch the ICT September 2023 Recording
This article draws on the timestamped English captions of the recording, which YouTube generated automatically. The charts the lesson depends on are only visible in the video, so it remains the primary source for every level discussed above.
The recording runs about 29 minutes 6 seconds. It is titled “ICT Mentorship 2023 – September 08, 2023 Review & ICT Ma Deuce Model” and was published on the channel The Inner Circle Trader on YouTube on 8 September 2023. The embed above was tested as a saved player on this site and starts normally.
ICT Ma Deuce Model Resources
These are the outside sources checked for this article. The CME page is the exchange's own specification for the future discussed in the recording, and the CFTC pages are regulator and investor-education material on how trading systems and results are presented. The TradingView page is third-party documentation of a charting platform's session settings, labelled here as unofficial and untested for any trading purpose. None of these sources assesses ICT, this review, or the Ma Deuce model.
- [1] ICT Mentorship 2023 – September 08, 2023 Review & ICT Ma Deuce Model – The Inner Circle Trader (primary source; watch page read 15 September 2026, 29M06S)
- [2] CME Group – E-mini S&P 500 Futures (ES) Contract Specs (contract unit $50 x S&P 500 Index; read 15 September 2026)
- [3] TradingView Help – Regular and Electronic trading hours for CME futures (third-party documentation, unofficial and untested here; defines the reduced 08:30-15:15 CT regular session against the full electronic session; read 15 September 2026)
- [4] CFTC Fraud Advisory – Commodity Trading Systems Sold on the Internet (on hypothetical results and stop-loss fills; read 15 September 2026)
- [5] CFTC Learn & Protect – Forex Frauds (the CFTC states that about two out of three retail foreign exchange traders end each quarter in the red; read 15 September 2026)
This is independent educational commentary on one recorded market review. It is not official ICT material, it is not a tested trading system, and it is not investment advice. The levels, the named model and the reported calls are the speaker's own statements , not verified results, and nothing here has been independently audited. Leveraged futures and foreign exchange trading involves substantial risk and is not suitable for everyone.