
Key takeaways
In ICT Mentorship 2023 – ICT Reaper PD Array Introduction & Market Review, ICT reviews the Dollar Index, the E-mini S&P and Nasdaq on 18 July 2023 and then names a new array: the “ICT Reaper inversion fair value gap” (17:27).
Read the full summary
In ICT Mentorship 2023 – ICT Reaper PD Array Introduction & Market Review, ICT reviews the Dollar Index, the E-mini S&P and Nasdaq on 18 July 2023 and then names a new array: the “ICT Reaper inversion fair value gap” (17:27). His stated definition is narrow — a bullish Reaper is a fair value gap sitting in the discount of the impulsive first leg of a bullish breaker, and a bearish Reaper is the mirror image in the premium of a bearish breaker’s impulsive leg (21:42). What distinguishes it from an ordinary inversion fair value gap is that price is expected to cut straight through it first rather than respect it (17:37). He frames the whole lesson around a market review: Nasdaq is the “leadership issue”, the S&P is the laggard (2:54), weekly volume imbalances are marked as potential support and resistance (3:37), and he states he does not try to pick tops in a buy program or bottoms in a sell program (5:21). He also states a specific result for the day: a six-contract long filled at 15,781 and closed manually above 16,000 for “over 120 handles” and “about 14 grand plus” (23:18 and 23:48). Those figures are his own account of his own trade and nothing in the recording verifies them.
How we researched this article
BestProps used document-based research from primary firm sources, checked September 24, 2026. The complete source list, scope, limitations, and commercial-state record appear near the end of this article.
This is an introduction, and he says so at both ends of it: he calls it “just a quick little review and an introduction to a new PD array” (0:14), and he closes by saying he will not be releasing more on it because he does not want others producing tutorials on something they do not understand (30:10). The practical consequence for a reader is that the qualification, invalidation and risk rules are not in this recording. What follows reports what he said and separates his chart readings from anything independently established.
ICT July 2023 Market Review: the Dollar Index and the weekly charts
He opens on the Dollar Index daily chart, describing price meandering inside a gap between two weekly reference points, and says he would have preferred a trade down into it, which did not happen (0:21 and 0:39). He then refers back to a review he published on 9 July 2023, in which he said the week would open, trade down into a weekly inversion fair value gap and rally; he notes that the weekly volume imbalance has now been completed and calls the delivery a “slam dunk”, while stressing that the levels were marked before the fact rather than added afterwards (0:50 and 1:15 and 1:54). The assertion that the annotations predate the move cannot be checked from this recording; he points viewers to the earlier video and to old charts rather than showing a verifiable timestamp.
He then explains why the move happened at all: the Dollar Index was, in his framing, “exceedingly bearish” as expected on 9 July (2:16). This is his own attribution of a reason to price action he is reading after the fact.
On the weekly S&P chart he points out the original weekly volume imbalance that price has now traded to and through (2:24). The intermarket comparison that follows is the part he says matters most: Nasdaq had two weekly volume imbalances and had already completed both, while the E-mini S&P had been the laggard — “the sixth sister” between the two averages — and he calls Nasdaq the leadership issue, which is his stated reason for trading it (2:54 and 3:00). He marks the boundaries of a weekly volume imbalance and says to keep both the high and the low on the chart and treat them as potential support and resistance rather than guaranteed turns (3:09 and 3:40).
One short digression is a workflow note rather than a claim. He says he toggles the settlement-price display on when he is thinking about where the market closed relative to his “TGIF” ideas, and off otherwise, because he is looking for both volume imbalances and inefficiencies and wants to see both presentations (3:45 and 3:51 and 4:00).
ICT July Market Continuation Outlook
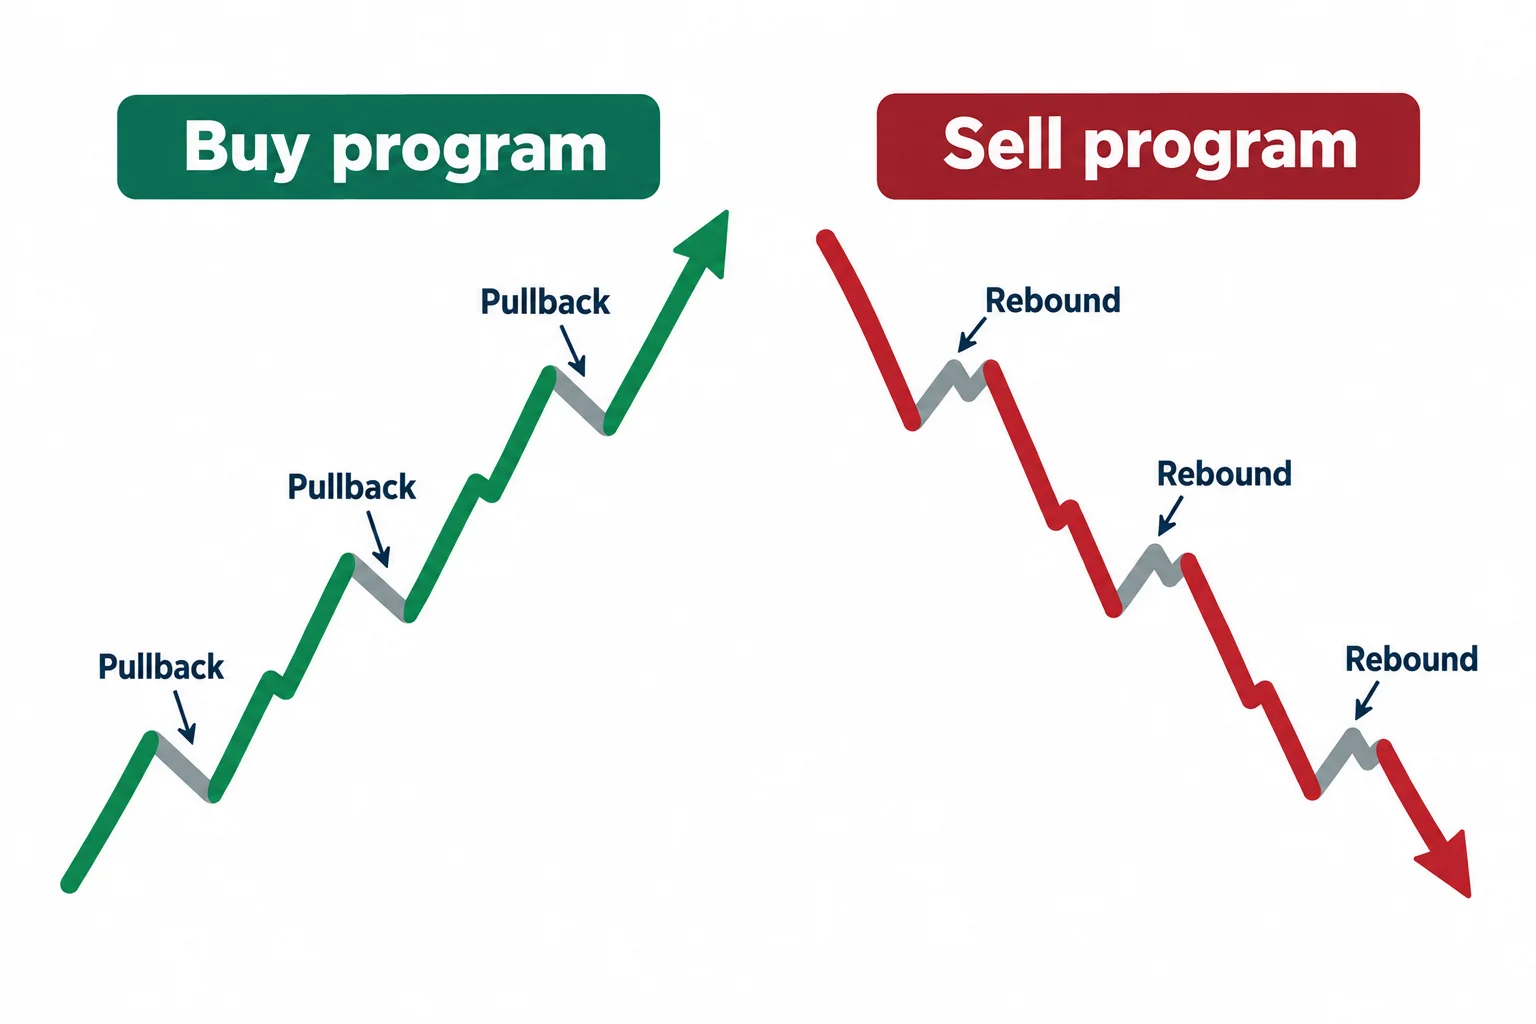
The rule he repeats most in this lesson is about not fighting established delivery. On the E-mini S&P daily chart he says he does not try to pick tops in a buy program or bottoms in a sell program, and explains what he means: the market is not obliged to retrace just because it looks overbought, so he gives it room to move beyond where other traders expect a reversal — if that cannot be accepted, the alternative he offers is not to trade (5:21 and 5:39 and 5:54). He restates it on the Nasdaq charts at 7:11 and 7:46: “you do not try to pick tops while the market’s going up”, and patterns used to capture reversals will, in his words, run right over the trader. He is describing his own approach and its psychological premise, not a tested rule about how often reversals fail.
He walks the 18 July session in his terms. On the intraday S&P chart he describes a small consolidation, a drop that took out sell-side liquidity, and then a rapid acceleration into and above Monday’s high and up into the higher weekly volume imbalance (6:05 and 6:13 and 6:20). He points out 15-minute fair value gaps and an order block that price traded down into, and says he is deliberately showing the annotations on a 15-minute basis so viewers can find them on their own timeframe (6:25 and 6:45).
On the Nasdaq daily chart he identifies an order block and a repulsion block, and says he does not want to see a closing price below the midpoint of that block — which, he notes, never occurred (8:08 and 8:13). He also describes trading back up into old highs and lows as a discount array, and refers viewers to his month-four premium mentorship PD array matrix lectures on the channel rather than detailing them here (8:54 and 9:00 and 9:11).
The setup he wanted to see: a bull flag that fails
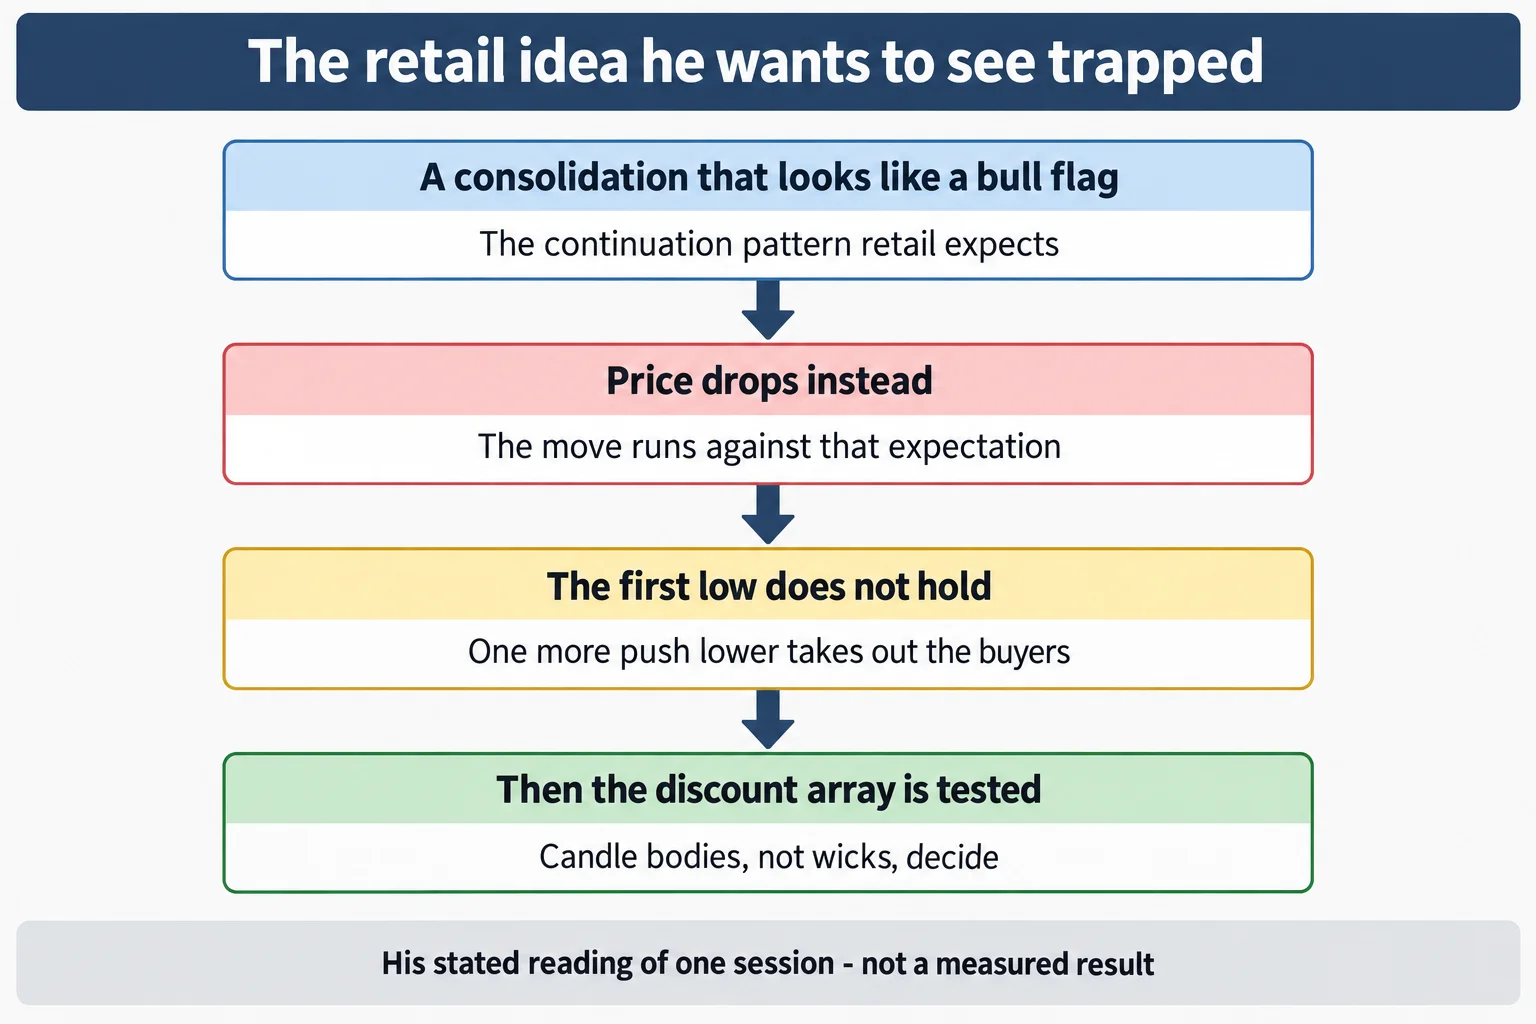
The Reaper introduction is built on what he describes as the market punishing a retail expectation. On the hourly chart he shows a drop followed by a small consolidation and says that is where retail would see a bull flag and expect continuation higher (9:37 and 9:47). He says he was asked on Twitter what his bias was, and that he posted it so the record existed rather than just asserting it afterwards (9:56).
He then gives the sequence he says he was waiting for. Retail-sales data was released at 8:30 a.m. New York time; he says he was waiting to see whether price would drop on it and then rally, and that if it dropped and did not rally it did not matter to him because movement is what he wanted (12:20 and 12:34). His description of what happened: price drops at 9:30, creating what he calls a Judas swing — traction in the opposite direction to what retail expects — forms a short-term low, rallies, then dives one more time, which he calls “absolutely beautiful” because it traps the traders who expected the bull flag to work and then stops out the ones trying to buy that low (12:40 and 13:13 and 13:19 and 13:25). He says that immediately scares off most retail participation. This is his reading of who was positioned where; the recording shows no order book, positioning data or evidence about other traders.
He also flags a specific pattern objection at this point. A three-move structure that looks like a three-drives or “three Indians” topping pattern, he says, is not one in his framework — because he is not trying to call tops in this context (14:51 and 15:12 and 15:22). He names Street Smarts as, in his opinion, one of the better books available, while saying this particular formation does not qualify as the pattern described there (15:31).
ICT Reaper Array and Inversion Fair Value Gaps
The formal introduction arrives at 14:02, which he opens by calling it “a new gift to the trading community”. He starts with the structure he calls a bullish breaker: a low, then a high, then a lower low that takes out the earlier low and stops out longs, followed by price rallying through the earlier high (14:12 and 14:35 and 14:48). He then separates two measurement questions. The low-to-high of that first leg is the standard measurement for swing projections and targets, taken as one standard deviation (16:36 and 16:48 and 16:58); the lower low that undercuts the original low is what sets the tone of the pattern as a breaker. He notes the projection came in within about a handle of the level he had marked and asks whether that is precise enough, while adding that they are going to go a little beyond that (17:16).
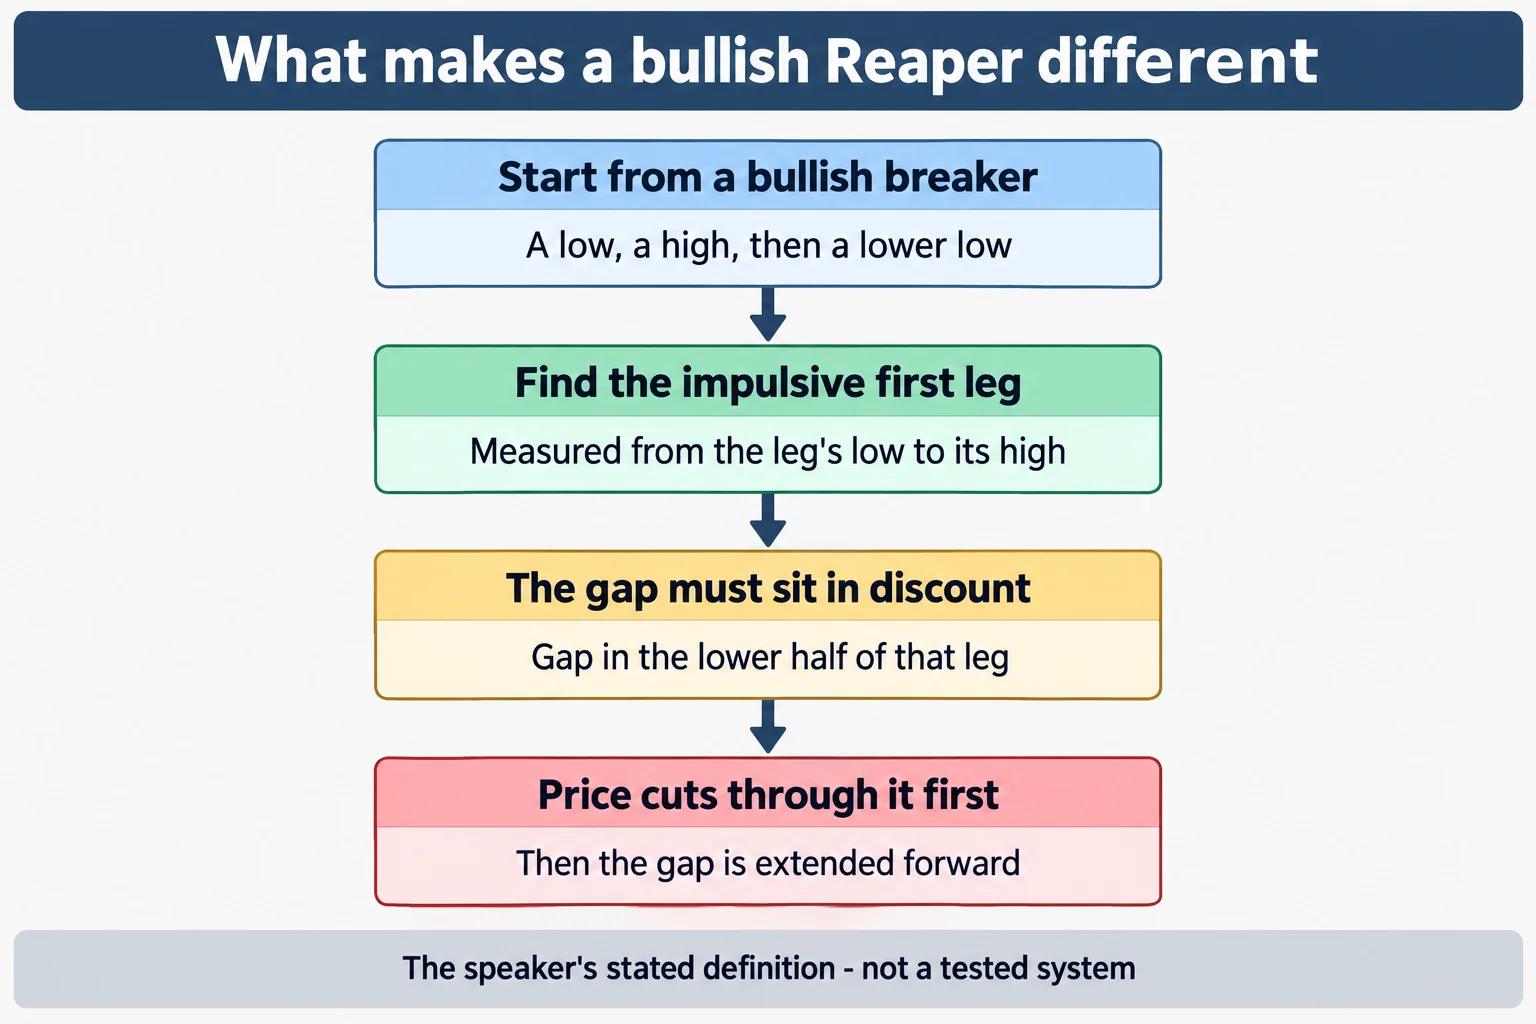
He then names the array. His concise definition at 21:42 is that a Reaper is a fair value gap in the discount of the impulsive price leg of a bullish breaker, and that reversing it gives a bearish ICT Reaper inversion fair value gap — a bearish breaker with a fair value gap in the premium side of its impulsive leg. The fuller description he gives immediately before that is worth setting out in order, because the sequence is where the array differs from an ordinary inversion fair value gap:
- Price runs and leaves a fair value gap in the lower, discount portion of that run — the first leg of the bullish breaker (17:55 and 18:05).
- Discount is measured against that leg’s low-to-high range, and the gap is extended forward once identified (18:12 and 18:32).
- Price then trades down through the gap and does not respect it, which is what he says he expected — he wants it to run the stops of traders holding a trailing stop there (18:37 and 18:40 and 18:55).
- Price then rallies back up and takes out the high, which he says punishes anyone using the breaker conventionally as well as anyone treating the consolidation as a bull flag (19:15 and 19:20 and 19:35).
He is emphatic that this is not a relabelling of supply and demand or of a liquidity void, and he frames the point of the array as precision, exploiting shifted sentiment and staying under the radar (17:46 and 18:02 and 18:31). Those are claims about the origin and purpose of his own terminology; nothing in the recording tests whether the array performs differently from the concepts he says it is not.
Two context requirements are stated as mandatory. First, there has to be a directional bias. Second, there has to be a competing retail idea that would lure traders in — in this example, the bull flag (21:34 and 21:38). He also ties the array to a specific level: he says the best fills for getting long are normally at equilibrium of the previous day’s range or higher, “except when my Reaper exists in price action”, in which case he expects price to cut through those candles and trade lower than that (19:55 and 20:05 and 20:21). He then points to candle bodies respecting 50% of the previous day’s range while the wicks do the damage, and calls the resulting reaction the signature that told him the setup was done (21:16 and 21:23 and 21:41).
He also makes a stronger claim while interpreting that reaction: that it is “proof that my algorithm refers back to candlestick highs and lows that you would never otherwise know”, and that classic support and resistance is only meaningful to him when it coincides with one of his fair value gaps (20:45 and 20:58 and 21:08). That is his assertion about how price is generated, offered without independent evidence in this recording.
ICT Reaper Array Trade Example
From 22:51 he describes his own trade. He identifies the specific price points — between the lower wick handle of the qualifying candle and that candle’s high — and says his long fill on six contracts was 15,781, inside the inversion fair value gap at the candle that qualified and confirmed the Reaper (23:13 and 23:18). He says he took a market exit rather than being stopped out, because his intentions were going to be elsewhere and he did not want to manage the position on his phone (23:40 and 23:45). He reports the exit as a little above 16,000 — noting it went about a handle beyond — giving “over 120 handles” on Nasdaq and “about 14 grand plus”, which he calls “not bad for a couple hours of leisurely fishing” (23:48 and 23:54 and 24:00).
He then maps the entry onto time of day. He calls the entry a silver bullet with the other context layered on top (25:13), points to a lunchtime macro from which price started running higher (25:22), and says the daily range is likely to create its extreme high if he is bullish in the PM session going into the last hour — which he describes as power of three, and which is where he says the high of the day did form, around three o’clock (25:42 and 26:02 and 26:42). He also says he gave up about a hundred handles against the wider move and calls 120 enough, and that price ultimately went higher than his exit (26:10 and 27:02).
The lesson he draws from the trade is about holding, and he is explicit that it depends on position size. He says to place the stop and then not trail it, not take partials and not watch the chart — and that he did exactly that, being away from the house while the market kept going (27:10 and 27:18 and 27:32). He describes his standard index-futures size as six contracts initially, with a possible four more to reach ten, and says he was tempted to add four more on a later qualifying candle but chose not to (27:50 and 27:56 and 28:54 and 28:58). He states where his stop was — below that candle’s low — and notes he has used tighter stops than that, and that price traded down into a fair value gap he did not act on because he was not watching (29:16 and 29:26 and 29:36).
Two caveats belong with that account. The first is that a stop placed and left alone changes the risk profile rather than removing it, and his own description of giving up about a hundred handles before exiting is an illustration of what that choice costs when the exit is early. The second is that this is a single self-reported session. There is no statement, fill confirmation, commission, position-sizing detail in dollars or net result anywhere in the recording, and no sample, win rate or backtest. The figures he gives are reproduced here as his statements, not as verified performance.
What the Recording Does Not Establish
The Reaper is presented as an introduction. He says near the end that he will not be releasing more about it, partly because he expects others to produce tutorials on it without understanding it (30:10 and 30:18 and 30:22). Readers should therefore not infer qualification rules, invalidation criteria or risk parameters from this video; they are not stated, and the recording contains no sample size, backtest or performance data of any kind.
Several things are asserted and cannot be checked from this source. He says his chart markings were placed before the moves he is describing and refers viewers to his 9 July 2023 review and to old videos rather than showing a verifiable timestamp; he says he posted his bias on Twitter in advance and shows a tweet on screen; he attributes the day’s delivery to the algorithm “referring back” to candlestick highs and lows that other traders would not know, and says the concepts are his own codification that nothing else resembles; and he characterises the day as designed to trap retail buyers and stop them out. None of that is established by the captions, and the article reports the trade result only as his stated account. He also refers viewers to his month-four premium mentorship PD array matrix lectures rather than setting out those concepts here.
A note on the source itself: the transcript used for this article is YouTube’s automatic captions, which are not human-checked. They render several of his terms phonetically — the Reaper is described as being “in version” rather than “inversion”, a fair value gap as a “Fairbag Gap” or “Fairbank Gap”, a Judas swing as a “Judah swing”, a repulsion block as a “propulsion block”, an institutional order-flow entry drill as an “institutional article entry drill”, and 16,000 as “16 000”. Where the correct term is clear from context it has been normalised here, and the level he cites is reported as the number he speaks, 15,781. The reviewer did not see any chart, so every level, candle reading and structural claim in this article is the speaker’s own description of charts he was annotating.
Watch the original recording
ICT Mentorship 2023 – ICT Reaper PD Array Introduction & Market Review
The Inner Circle Trader · uploaded 18 July 2023, reviewing the 18 July 2023 session · about 31 minutes. This is the primary source for this article; every timestamp link above points into it.