
Key takeaways
The Inner Circle Trader’s public 671-second YouTube lesson reviews the dollar index, EUR/USD and E-mini S&P 500 before the week ending 20 January 2023, with a conditional bearish dollar bias toward sell-side liquidity at 101.30 and 101.29, a higher-time-frame preference for EUR/USD to rise toward the caption-rendered 109 to 109.05 area, and a cautiously bullish…
Read the full summary
The Inner Circle Trader’s public 671-second YouTube lesson reviews the dollar index, EUR/USD and E-mini S&P 500 before the week ending 20 January 2023, with a conditional bearish dollar bias toward sell-side liquidity at 101.30 and 101.29, a higher-time-frame preference for EUR/USD to rise toward the caption-rendered 109 to 109.05 area, and a cautiously bullish index-futures outlook that could change at the Sunday open. For E-mini futures, ICT cites objectives rendered as 40 20 and 40 30, a possible measuring-gap and breakaway-gap path toward 40 40 to 40 45, weekly fair value gap support, and consequent encroachment calculated by applying Fibonacci from a candle’s open to its high and using the 50 level. His preferred opening scenario is a gap up, retracement to close the gap and continuation, while a gap lower that fills and sells off would be concerning. The prior week is described through fair value gaps, order blocks, bullish breakers, liquidity sweeps, market-structure shifts and a five-minute market maker buy model, but no entry, position size, stop, fill or verified result is provided. ICT stresses that market behavior can invalidate his preferences, does not trade Sundays and waits for the Monday nine thirty open, while the article cautions that its evidence comes from machine-generated captions and public metadata rather than visible chart verification.
How we researched this article
BestProps used document-based research from primary firm sources, checked September 24, 2026. The complete source list, scope, limitations, and commercial-state record appear near the end of this article.
Everything below is his own narration of charts he was annotating. The recording establishes what he said about his levels and expectations; it does not establish that a level, an order, a fill or an outcome was what he describes, and the reviewer read the caption track and the public watch-page metadata rather than the video frames. Where the automatic captions render a price as a run of space-separated digits, that rendering is reproduced rather than converted.
ICT Premarket Commentary Recording Overview
The video is public on the The Inner Circle Trader channel, titled “ICT Premarket Commentary for Week Ending 01/20/23”, and the watch page records a publish time of 15 January 2023 at 11:24 a.m. Pacific with a duration of 671 seconds. That is the same calendar day on which he says he is recording: at 2:11 he says the read is what he sees on the chart “before Sunday’s opening on the 15th of January 2023”, and he opens the recording with “good afternoon folks” (0:04). He also says the market has not yet opened for the new week and that it is shortly after one o’clock his local time on the East Coast, which fits a Sunday-afternoon premarket review for the week ahead (1:28, 1:37).
Despite the title, the recording is two things at once. He gives a forward-looking read for the coming week, and he spends the second half reconstructing what he says the prior week’s index-futures price action did. The retrospective part is where most of the teaching vocabulary sits.
Watch the original lesson on YouTube
The video cannot be played inside another website. The embedded player for this recording was loaded and clicked on 15 September 2026 from a bestprops.com page: it reported “Video unavailable” and “Playback on other websites has been disabled by the video owner”, with no duration and no playback progress, at desktop and mobile widths. The recording’s own watch-page data agrees that embedding is unavailable, so no embed is placed here. The lesson is public and playable directly on YouTube.
Watch ICT Premarket Commentary for Week Ending 01/20/23 on YouTube ↗
ICT Premarket Dollar Commentary
He starts on the daily dollar index chart and says the levels on it are the ones he gave out in the first week of January, with one addition. He notes that price has already reached the discount array, relative equal lows, fair value gap and order block he had marked below, and that a small gap between one candle’s high and the next candle’s low is worth annotating because the larger fair value gap is already in place (0:28, 0:40).
The condition is the substantive part. He says the one thing that would change his near-term tune is a trade above a specific fair value gap (not the one on the immediate chart, but the one below Wednesday’s low and Friday’s high) followed by a return down into that area finding support, which would give him two areas of imbalance to work with. Absent that, he still reads the index as heavy, and he names the next draw on liquidity as the level the captions render as “101.30” and “101.29” (0:49, 1:02, 1:14). He also flags a volume imbalance and says the discount arrays are reached as long as price remains below it (0:24).
On the hourly chart he calls the recent back-and-forth a balanced price range and says it is more likely to gravitate toward the range low than to go higher, then immediately qualifies it, because the Sunday open is still ahead and “who knows where they’re gonna happen or not” (1:51, 2:01). He describes what he would like to see (a gap down, a return up to fill it, and then a move toward his level) and then says the thing worth keeping: “but what I want and what the market gives me is two different things” (2:17, 2:24). If price reversed above the imbalance instead, he points to relative equal highs above as buy-side liquidity and a bearish breaker formed by a down-close candle, and says that for now he does not think it needs worrying about (2:27, 2:38).
ICT Premarket EUR/USD Commentary
He moves to the EUR/USD daily chart, says buy-side liquidity has been taken and a buy-side liquidity level has been pierced, and points to the sell-side imbalance and buy-side inefficiency he treats as a fair value gap below. If price keeps moving higher, that is the imbalance he wants viewers watching (2:52, 3:01, 3:09).
The hourly condition is stated as a sequence: if price trades above the gap he has marked, then the level he points to should not come back to be retested until the levels above it are taken out, and a move to roughly halfway between two of his references would be enough. That halfway level is the one the captions render as “109” and “109.05” (3:44, 3:49, 4:00). The alternative he gives is the mirror image: a gap down that fills and then trades off would bring the sell-side liquidity resting below into focus (4:15, 4:18). His summary of the pair and the index is a single sentence of higher-time-frame preference (reaching higher for the euro and lower for the dollar) wrapped in the same caveat that Sundays are always fifty-fifty (4:20, 4:28).
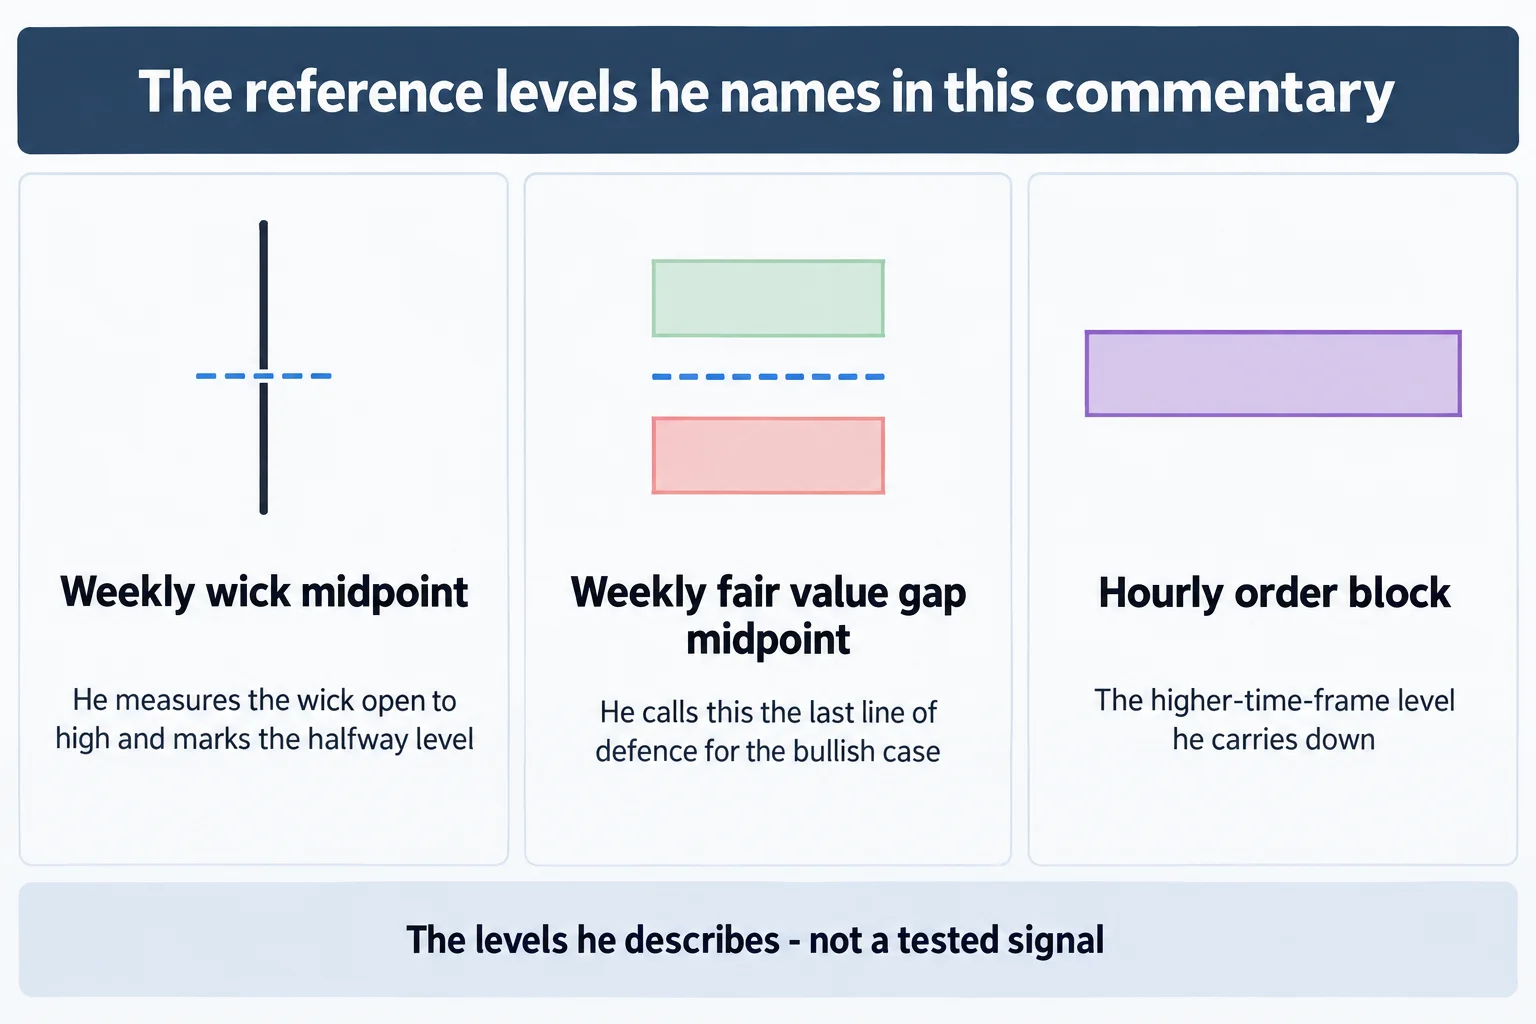
ICT Premarket E-mini Weekly Commentary
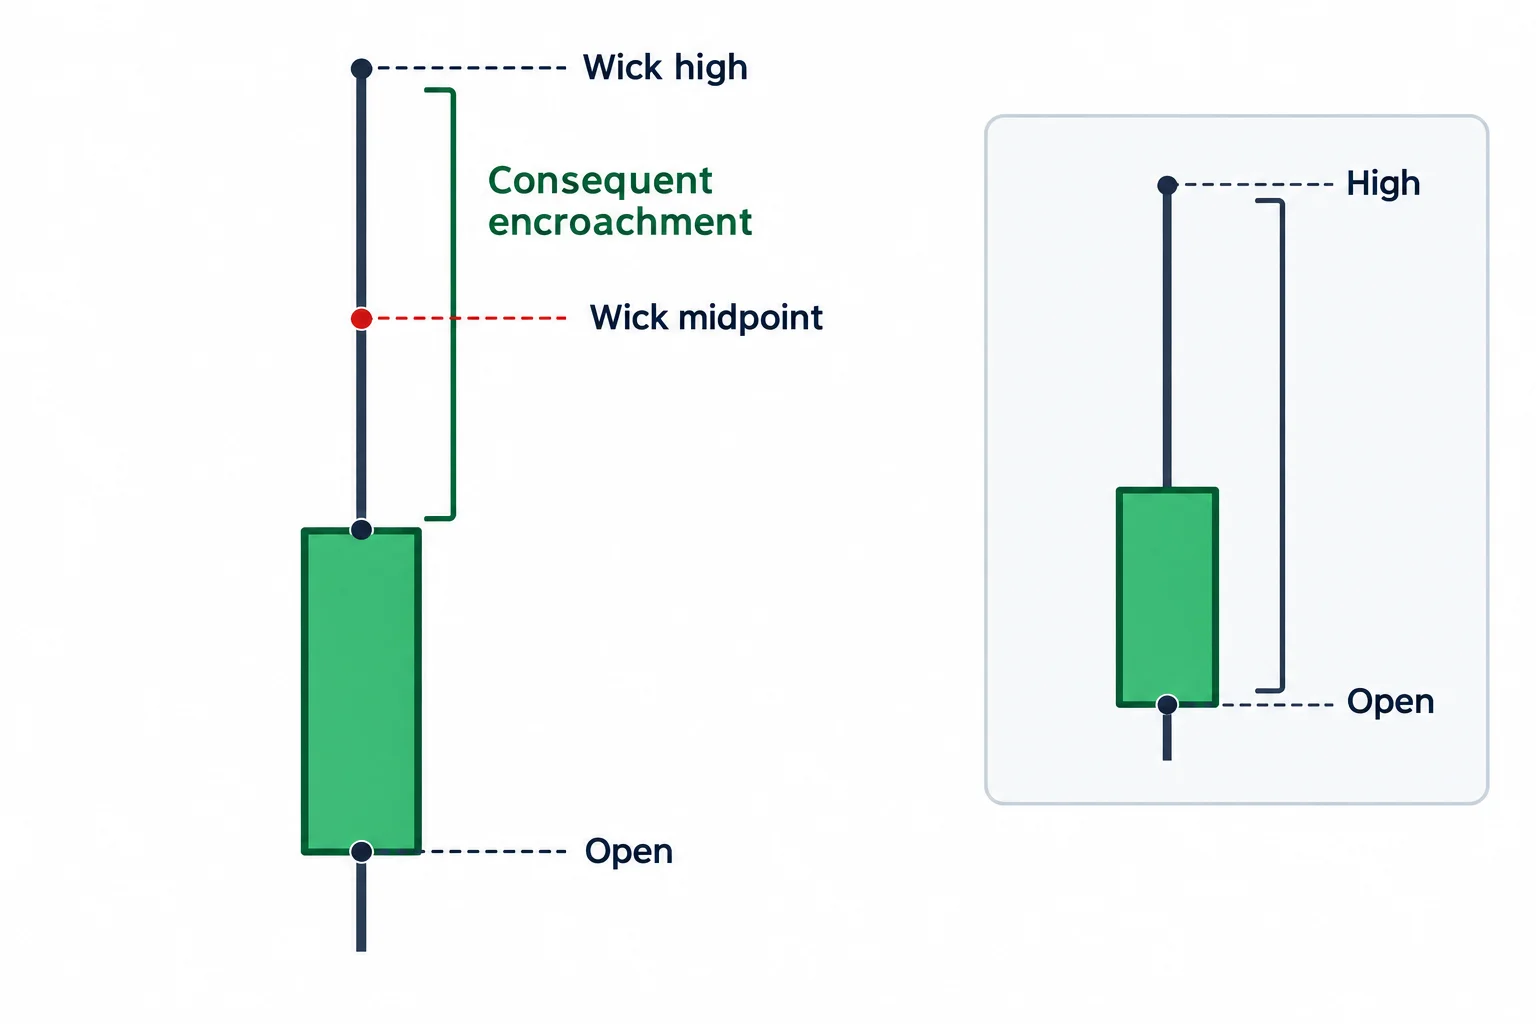
He turns to the E-mini S&P weekly chart, notes that the prior week expanded, and draws attention to half of a wick, which he calls consequent encroachment on a wick, basically the halfway point (4:30, 4:38, 4:43). He says he is not annotating it because there are already too many lines on the chart, and asks viewers to be mindful of it (4:47, 4:50).
On the downside he identifies the low of a candle that is also the high of a fair value gap represented by three candles, and says that if price drifts back to it, he would want support there or at half of that consequent encroachment. His longer-term “last line of defense for bulls” is the midpoint of the weekly fair value gap, with the midpoint of the earlier weekly wick as the objective above; his instruction for getting that level is to drop a Fibonacci on the open to the high and take where the 50 level falls (4:55, 5:02, 5:16, 5:34).
ICT Premarket Index Opening Scenarios
On the hourly chart he says the levels in front of him are the ones he had given out on Twitter (a bullish order block and relative equal highs) and that he had been looking for price to trade down into that area and perhaps take out the low, which would trade back into a wick; he says buy-side has since been taken (5:45, 5:52, 5:55). The tweets themselves are not shown in the captions and are not verified here.
His stated objectives were a level he renders as “40 30” and, reached already, what he renders as “40 20”. He says he would like to see the market gap up, trade back down to close that gap and then continue. He then gives the opposite case: a gap lower that fills and starts to sell off would be a little bit concerning for him, and if that happened there is a small gap he would want left open rather than worked back into (6:11, 6:15, 6:20, 6:37). He then applies his gap vocabulary to that small gap: it could be a measuring gap, which together with a breakaway gap would set the stage for around “40 45” to “40 40” (6:50).
One detail in that passage is worth separating from the analysis, because it is about attention rather than price. He notes that on the morning of the CPI release he was on a one-minute chart calling it out live, and then on Friday the market dropped lower (7:02, 7:08).
ICT Commentary on the Prior Week
The remainder of the recording is a walkthrough of what he says the prior week did. He starts by splitting the Friday low wick in half, which gives him a consequent encroachment that is also half of the fair value gap, and calls that a discount array (7:12, 7:18, 7:37). He then narrates a repeating sequence: price trades back into a fair value gap, rolls up through overlapping highs, leaves a small gap, returns to the order block, rallies, comes back down, and rolls up again (7:40, 7:46, 8:01).
The criticism he aims at how other people read the same chart is the most quotable passage in this section. He says that a move above an old high is not simply a break of support-turned-resistance; what price digs into is an actual candle he had marked as a bullish breaker, and the move then gravitates toward what he renders as “ 20” (8:14, 8:19, 8:25).
On the lower time frame he says the short-term high was traded to the consequent encroachment twice before price broke higher, breaking above the short-term high, which he labels a shift in market structure, and that it left a fair value gap behind which price then redelivered into before the order block produced another rally (8:49, 8:53, 8:58, 9:04). Two phrases in that passage are his own shorthand rather than standard terms, and he uses them loosely: he describes the return as price being “reclaimed”, and explains cutting through candles as not supplying demand (9:21, 9:25).
He ends on the five-minute chart, where he calls the whole sequence a market maker buy model and narrates it as a list of phases: consolidation, leaving the consolidation, coming back in, sell-side distribution, a smart-money reversal, a low-risk buy into an imbalance, cutting through candles, tracing back down into accumulation of longs, a rally, a secondary buy at the consequent encroachment of a gap midpoint, another order block finding support, and then a run into the Friday close that reaches what he renders as “ 20” and clears the old high for buy-side liquidity (9:48, 9:50, 9:56, 10:13, 10:25, 10:32). That list is his interpretation of a chart the captions cannot show, and the recording states no entry, size, stop or result for any of it.
ICT Premarket Commentary on Sunday Trading
His closing position is deliberately loose. He says he is continuously looking for reasons to allow bullishness on his buy side for index futures, while being aware that a gap on the weekly opening can change everything (10:38, 10:48). Then he gives the operating rule that turns the whole commentary into a wait: they do not trade on Sundays, and prefer to see what the opening is at 9:30 on Monday so traders can digest the week, build their sentiment and place their liquidity pools ahead of that open (10:50, 10:55, 11:01).
Usable Lessons From ICT Premarket Commentary
- Every directional statement comes with the condition that would change it (a trade above a named fair value gap on the dollar index, a trade above a named gap on EUR/USD) which is the part of the recording that transfers to any framework.
- The method he gives for a wick midpoint is concrete: drop a Fibonacci on the candle’s open to its high and take the 50 level.
- He distinguishes a fair value gap that should be left open from one he expects to be filled, and treats the weekly gap midpoint as his longer-term invalidation for the bullish case.
- He states a preference and then says explicitly that what he wants and what the market gives him differ, which is the right way to read the rest of the recording.
Read as a worked example of how he frames a week before it opens, the recording is specific and self-limiting. Read as evidence that the framework produces results, it is not: nothing in it verifies a level on the unseen charts, and the prior-week walkthrough is narrated after the fact.
ICT Premarket Commentary Transcript Notes
This article was written from the recording’s own automatic English captions, which are machine-generated and not human-checked. They misrender several of his terms and run his price levels together: “Fairway Gap” for fair value gap, “consequent encouragement” and “consequent encrosion” for consequent encroachment, “volume and balance” for volume imbalance, “by side” and “Boston liquidity” for buy-side, “cell side” and “sell sign” for sell-side, “bicep recorder” and “bison efficiency” for the imbalance phrases, “ublish order block” for bullish order block, and instrument levels as space-separated digits such as “ .30”, “ 20” and “ 109.05”. Where the intended term is unambiguous from the surrounding sentences it has been normalised in prose, and the transcript note above lists what was changed. Every price he reads out is reproduced as the captions render it and no number has been converted or reconstructed. The caption track establishes what he said; it cannot establish a chart level, a tweeted call or a fill.
ICT Premarket Commentary Resources
These are the sources checked for this article. The regulator pages below are general investor-education and fraud-warning material about leveraged retail trading, hypothetical performance claims and commodity trading systems; they are not assessments of ICT, of this recording or of anything said in it, and none of them verifies a statement made here. Any ICT, smart-money or third-party indicator, script, note set or transcript circulating outside the publisher’s own channel is unofficial and untested here.
- [1] ICT Premarket Commentary for Week Ending 01/20/23, The Inner Circle Trader (primary source; watch page read 15 September 2026: published 15 January 2023 at 11:24 a.m. Pacific, 671 seconds, public)
- [2] The Inner Circle Trader, official YouTube channel (read 15 September 2026)
- [3] YouTube Help: Embed videos & playlists (read 15 September 2026; the platform documentation relevant to the disabled-embedding notice above)
- [4] CFTC Learn & Protect: Forex Frauds (read 15 September 2026; states that two out of three retail foreign exchange traders lose money each quarter)
- [5] CFTC: Fraud Advisory: Commodity Trading Systems Sold on the Internet (read 15 September 2026; cautionary material on hypothetical trading results and on systems marketed with impressive historical results)
- [6] NFA: Investor Education & Resources (read 15 September 2026)
This is independent educational commentary on one speaker’s framework and on his own premarket read of one week. It is not official ICT material, it is not a tested trading system, it is not investment advice and it is not a claim that any result can be reproduced. Leveraged futures and foreign-exchange trading involve substantial risk, the regulator’s published data indicates that the majority of retail foreign-exchange traders lose money over time, and past or hypothetical performance does not indicate future results.