
Key takeaways
ICT’s 92-minute review of the 4 January 2023 March Nasdaq-100 futures session uses TradingView to trace a daily volume imbalance down through 60-minute, 15-minute, five-minute and one-minute charts, anchors 10,864.75 from the 3 January candle, and selects Nasdaq over ESH2023 because Nasdaq showed stronger relative strength.
Read the full summary
ICT’s 92-minute review of the 4 January 2023 March Nasdaq-100 futures session uses TradingView to trace a daily volume imbalance down through 60-minute, 15-minute, five-minute and one-minute charts, anchors 10,864.75 from the 3 January candle, and selects Nasdaq over ESH2023 because Nasdaq showed stronger relative strength. The simulated long risked 2.1% of a 100,000 paper account, pyramided to ten contracts with a possible extra add, targeted roughly 600 ticks, moved the stop to break-even after resting highs were taken, and scaled out one contract at a time around a rejection block, 11,018.25, 11,048 and later liquidity levels. Nine contracts were reportedly banked, but the final runner was stopped during the lunch retracement before the daily imbalance and 11,075.50 objective were reached, leaving a claimed result above 500 ticks. ICT displayed paper-account history rising from 100,000 to 121,185 for a claimed 21.1% one-trade return, but no fills, costs, position arithmetic or performance figures were independently verified. The lesson identifies buy-side imbalance and sell-side inefficiency, breakaway and measuring gaps, fair value gaps, order blocks, rejection blocks and market-structure shifts, then frames the setup as a market maker buy model involving consolidation, distribution, reversal, reaccumulation and a return to buy-side liquidity. ICT says US 100 CFD is not identical to futures but showed similar one-minute imbalance, structure-shift and partial-exit signatures. He also warns that FOMC and non-farm-payroll conditions reduce precision, says viewers should not trade an FOMC session, and acknowledges that his management would differ on a funded live account.
How we researched this article
BestProps used document-based research from primary firm sources, checked September 24, 2026. The complete source list, scope, limitations, and commercial-state record appear near the end of this article.
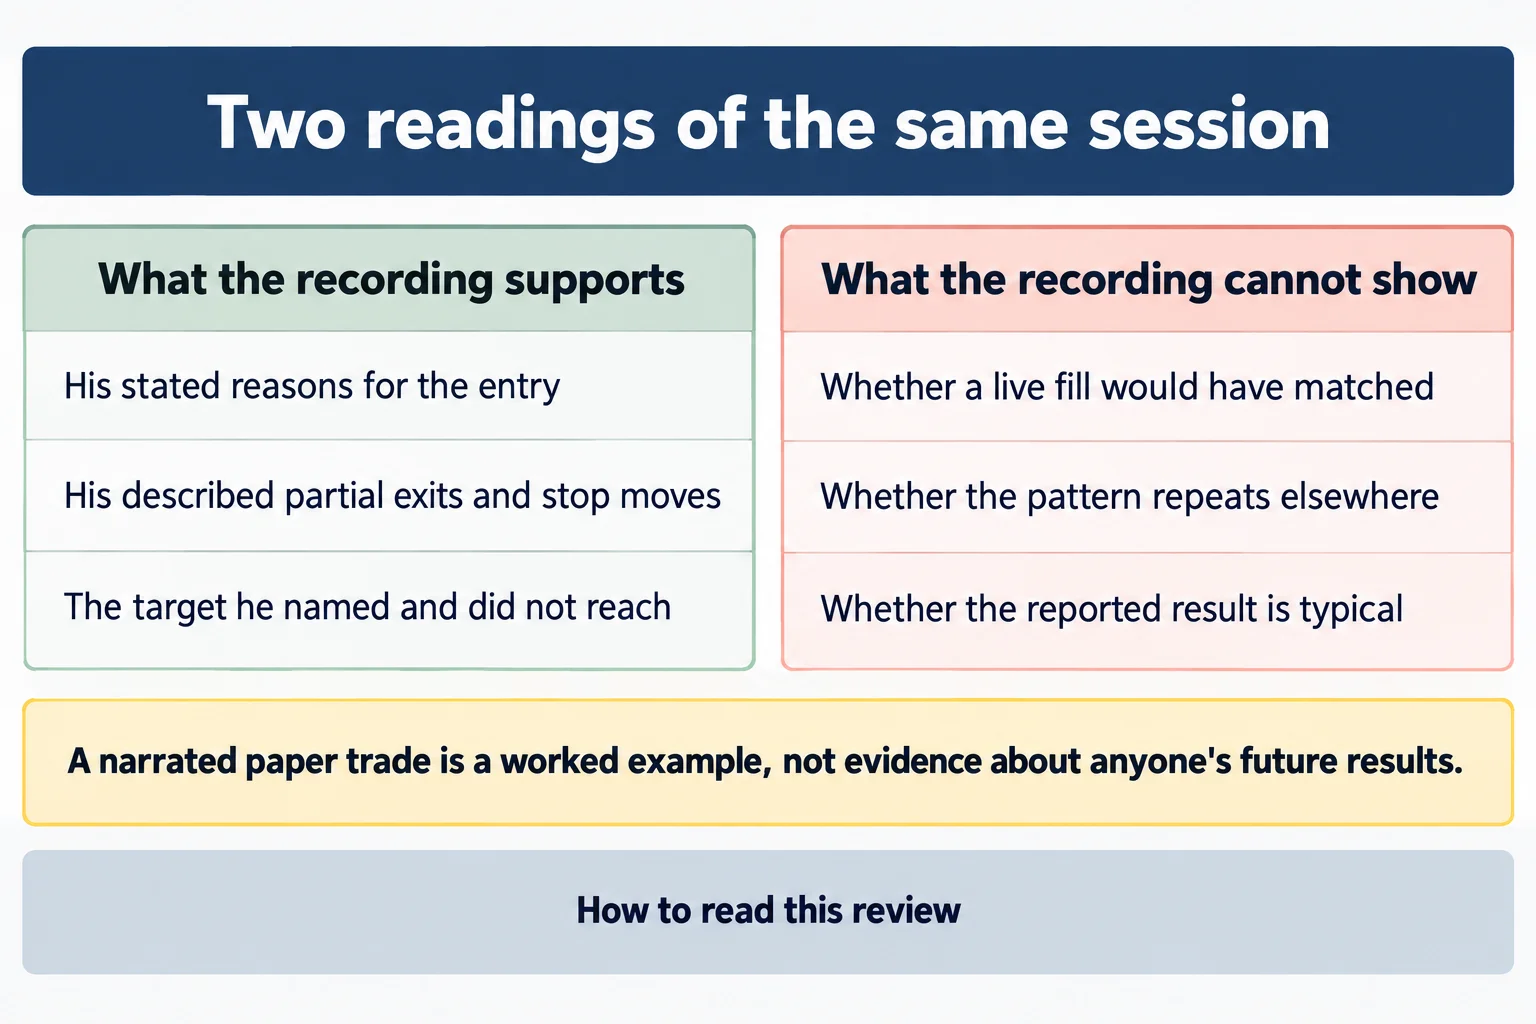
This is a transcript-grounded review of one speaker’s chart work, not a test of it. The captions are the source for what he said and for the levels he read out. The reviewer did not watch the charts, so no drawn level, order, fill or account figure below is verified here, and the reported paper-trade outcome is his claim about a simulation rather than evidence of live profitability. Leveraged futures trading carries substantial risk.
One date needs care. The bestprops scheduling inventory carries 5 January 2023 for this video. The watch page read on 15 September 2026 gives the upload as 4 January 2023 at 10:00 p.m. Pacific, which is 5 January in UTC (the same moment, recorded two different ways). The session he reviews is 4 January.
ICT Nasdaq Futures Higher Time Frame Target
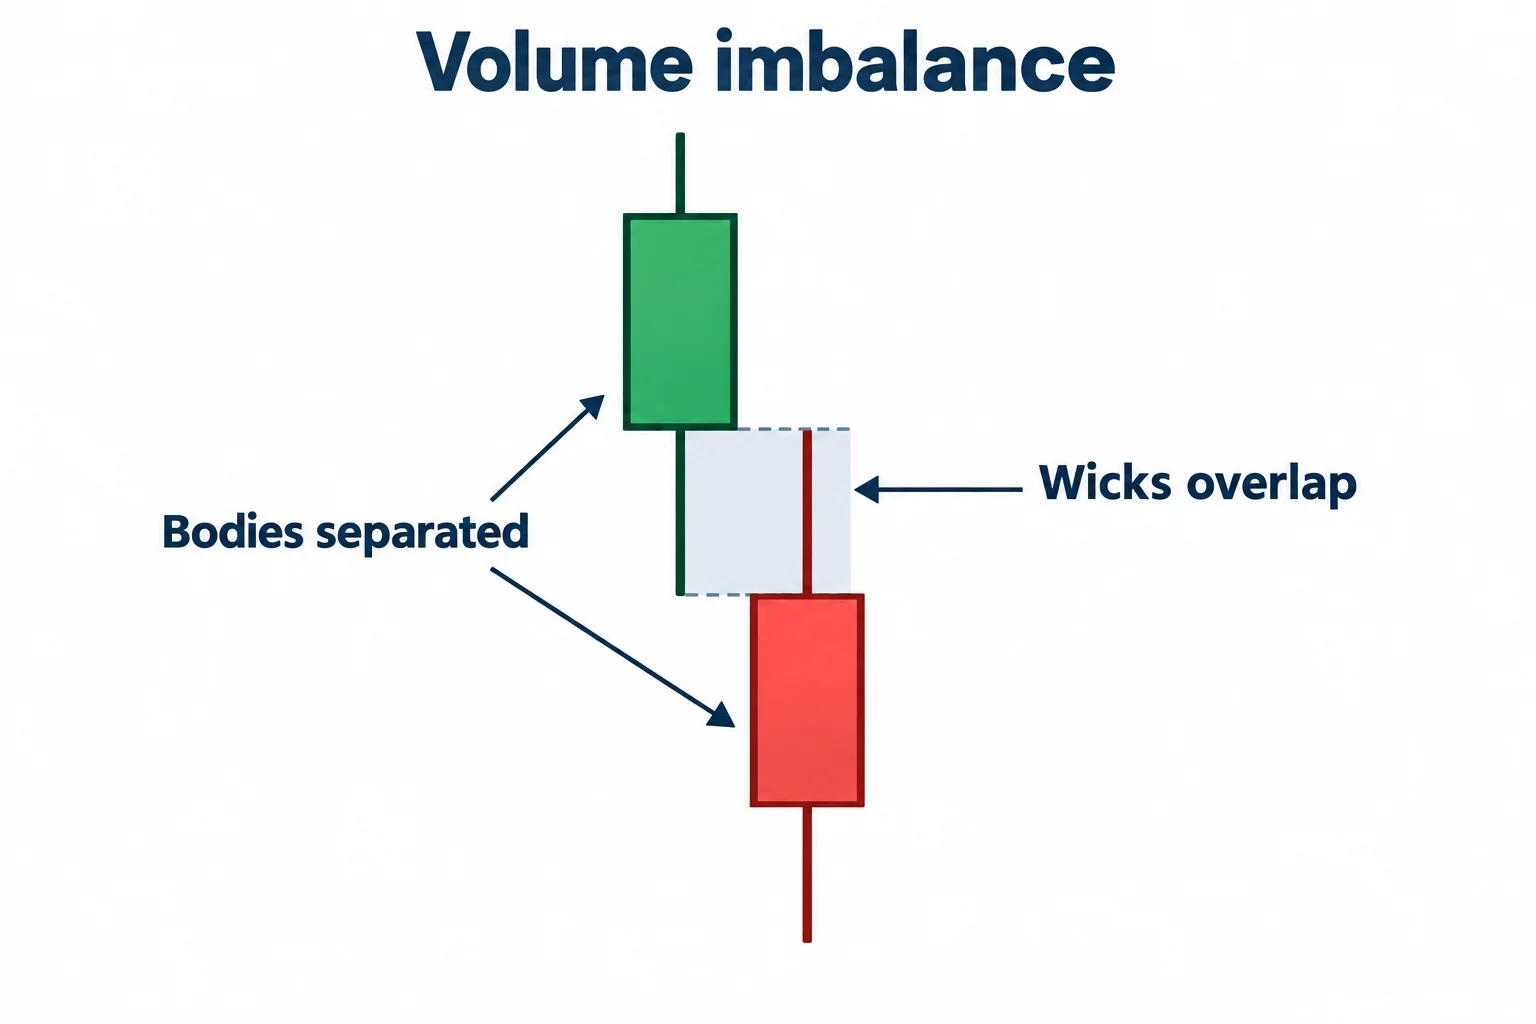
He opens on the daily chart of the March 2023 Nasdaq-100 futures contract and points to an area he calls a volume imbalance. His definition is specific: a run of price action in which the candle wicks overlap but the candle bodies do not occupy the range, so the area is “closed in simply with the wicks, no bodies” (0:33). He says that is what drew his eye and that it became his expectation for the coming session, an anticipated run up into the shaded area, which he refers to interchangeably as the alignment balance, the volume of balance and the daily volume imbalance (1:51).
He is explicit that this is a directional premise rather than a promised destination, and he flags something he believes cost him precision. The session fell in a non-farm-payroll week and on an FOMC day, with the FOMC decision scheduled for 2:00 p.m. (4:16). He says he teaches students to concentrate on Monday, Tuesday and the hours up to the New York session during payroll weeks (2:37), that conditions after the Wednesday New York session tend to be choppier, and that he “forced myself into these conditions today” precisely to demonstrate how the repeating elements behave when their precision is degraded (3:15). Later he returns to the same point: he says he was incorrect about one low, and calls that typical of FOMC and payroll weeks, where his precision is “a little bit skewed” (30:21). His stated position is that targets in such conditions may not be filled perfectly or even touched (18:23), and he says plainly that a viewer should not be trading an FOMC session at all (37:10).
ICT Nasdaq Futures Daily Reference Level
He steps down through the 60-minute, 15-minute, five-minute and one-minute charts, marking relative equal highs that he treats as buy-side liquidity resting above the market (8:51). He notes his charts are set to New York time so that viewers can locate what he describes (9:44), identifies the low under discussion as Wednesday 4 January 2023 (10:02), and then scrubs back to 3 January to derive a specific anchor. He takes the high of a down-closed candle on that prior day and reads off a price level of 10,864.75, saying it lines up almost exactly with the low he cares about (10:41). This is the only price he states numerically in the review, and it is a level he read off his own chart.
He describes the delivery he was looking for as a sequence: price trades down into an area he classifies as a buy-side imbalance and sell-side inefficiency, which he treats as a form of fair value gap (16:20); it reaches a five-minute order block and consolidates; a later dip moves below a short-term low; and then price rises back through a short-term high, which he reads as a shift in market structure while price is still in a discount (20:45). He places that sequence inside the 10:30 to 11:00 a.m. window and references the 9:30 opening as the point price first went south and then returned to take the resting highs (16:50).
Why ICT Traded Nasdaq Instead of the S&P 500
The most transferable part of the lesson is the comparison. He opens TradingView’s compare tool, types in esh2023 (the March 2023 E-mini S&P 500 contract) and plots it beneath the Nasdaq chart, switching the overlay from a line to candlesticks (22:36). He then drags a vertical line forward from a shared low and describes what the two charts do at corresponding points: at one high Nasdaq is only slightly higher than ES, at another Nasdaq prints a lower high while ES prints a higher one, and at a third Nasdaq punches through a short-term high far more decisively while ES shows relatively flat highs (24:37).
His conclusion is that Nasdaq was the relative-strength leader and therefore the market he wanted to be long. He says he looks for the instrument that “wants to break out higher faster, stronger” rather than the flatter one, and he notes that a small gap which ES traded straight back through was left alone on Nasdaq (26:02 and 25:43). He stresses that this is his own reading of relative strength between correlated instruments and not the RSI indicator (20:45). The general practice (compare how two related instruments behave at the same reference points before choosing one) is checkable by any reader; the claim that it improves a defined setup is not tested anywhere in the recording.
ICT Nasdaq Trade Gaps and BISI
He expects the bullish fair value gap left behind by the structure shift to stay partly open, and says he wants it to act as a breakaway gap that is not completely closed in (27:51). A later, smaller gap he classifies as a measuring gap, and he uses it to project how far the move might travel. He describes the distance from the long to that point as essentially half of the move and targets the bulk of his exits just above a high because the gap has held (31:35). He calls the measuring gap “classic technical analysis” while saying he has not seen it explained well in books or courses (32:07).
He then names the imbalance type. He says the area is not a liquidity void (a term he associates with price levels where no trading occurred at all) but rather price that moved aggressively to one side and was delivered inefficiently on the other. His words are “buy-side imbalance, sell-side inefficiency,” and he coins the short form himself, saying he “made these names up for that very reason” (33:13). The generated captions garble the phrase elsewhere in the recording, and he only ever spells out the one term here, so the paired abbreviation does not appear in his own words. Any indicator, script or note set built on these labels is unofficial and untested here.
ICT Nasdaq Paper Trade Entry Risk and Pyramiding
The replay starts at 38:53 (38:53). He states that the account on screen is a paper-trading account of 100,000 and that the displayed risk is 2.1% of it. He tells viewers not to be discouraged by the dollar figure the platform shows (39:09 and 39:13). He says he goes long on the setup he had just outlined, then moves his stop to break-even after the resting highs have been run, on the reasoning that price returning below them would invalidate the idea (40:15).
He then pyramids into strength rather than taking one entry. He says he is looking to buy more of the position as price drops back into the fair value gap (41:28), refers to a sixth contract and says he wants to be in more of the position (44:16), and describes his position as reaching ten contracts at what he calls the final partial entry (46:55). He says ten is about as large as he wanted this trade and that he was looking for a run in the region of 600 ticks (47:17). During the replay he keeps a limit ready to add one further contract if price dropped into an institutional order-flow entry drill (a shallow move into a fair value gap that does not close it) (52:29).
ICT Nasdaq Trade Exit Strategy
Before the exits he annotates a rejection block above the market and states ahead of time that two contracts will come off above it (56:24). He calls the technique behind the scaling “running down equity”: instead of closing a planned partial in one click, he peels contracts off one at a time as candles expand into the liquidity he is aiming at, trying to extract more from the move (65:43), and repeats the same behaviour at each new high (67:30).
The numbered sequence he narrates runs as follows. Two contracts are taken off as a partial at the rejection block while the stop stays put (62:58). He then says he will take three off above the next level, which he gives as 11,018.25, but explicitly does not click three at once. He works the orders toward 11,048 instead (64:28 and 64:38). Once those are off he says he can consider moving the stop up, because the level is now below what he regards as a measuring gap (65:03). He then plans three more above the following level (65:30). He describes the contract count as it changes through the replay; the arithmetic is not stated in one place, so the running total in the captions should not be read as a verified record of a position.
His stated final objective is the daily volume imbalance, which he calls his trade terminus or final target (70:23). He hopes for a spike into 11,075.50 to fill the limit on the last contracts (71:53), and at one point says nine contracts were already banked with no remaining emotional stake in the outcome (73:11). That did not happen. The runner did not reach the imbalance, the lunch-hour retracement took his stop (78:47), and he uses the moment to argue for trailing a stop and protecting an already-developed move (78:54). He describes the trade as over 500 ticks for those who count that way (79:04).
One qualification he makes himself is worth keeping. Reviewing the replay, he says that at one point he should have peeled another contract off, and that he would have done so “if there was a funded real live traded account” (78:27). That is his own statement that the management being shown was not being executed on live money.
ICT Nasdaq Trade Result and US 100 Comparison
Near the end he addresses traders who cannot access the US futures contract. He says the US 100 CFD is not identical and does not mark to market perfectly, but is close enough to study and to operate in (6:46), and he then walks through the same session on that instrument. His reading there is that the same signatures appear (the one-minute imbalance, the shift in structure, a rejection-block partial, this-week high partials, and relative equal highs taken) while the daily volume imbalance was again not reached, though he says it was respected and that the CFD did better than the futures contract did against that level (86:17, 80:44 and 81:00).
He also shows what he calls the account history for the paper trade: from 100 up to a final figure of 121,185, which he describes as a 21.1% return on one trade (81:23, 81:28 and 81:30). Those figures are his own screen recording of a simulated account. They are not a verified performance record, they say nothing about live trading, and they should not be read as typical or repeatable. He says so himself in substance, calling the session “championship level” trading and saying that is not promised to viewers (69:59 and 81:30).
ICT Nasdaq Trade Entry Model
He closes by naming the framework: what he calls the market maker buy model. He walks the sequence through regional consolidation, a move back up into the consolidation, distribution and redistribution, a smart-money reversal, a low-risk buy, reaccumulation, and a return to the original consolidation where the buy-side liquidity sits (87:47). He says everything he used to go long in the Nasdaq futures came from this model as taught in his core content lessons and his sniper series, both of which he says are free on his channel (87:38). He also makes clear that the specific entries and adds he took are one way through the model rather than the only way, telling viewers not to be pushed into a single approach to entry, timeframe or market (88:38). Those are his claims about his own material; this article reports them and does not evaluate them.
Limits of the ICT Nasdaq Trade Recording
- No verified result. The account figures and the tick count come from a paper account shown on screen during the recording. No fill, cost, or independently checkable statement supports them, and the transcript cannot confirm the arithmetic of the contract count.
- No independent levels. The price level, the contract expiry and the session highs and lows discussed above are spoken by the speaker or typed by him on his own charts. The reviewer read the captions, not the charts, so none of them can be checked here.
- No edge measurement. The recording gives no frequency data. It does not say how often the pattern repeats, how often the imbalance is reached when it is named as a target, or how often the outcome resembles this example.
- No validated terminology. The labels (volume imbalance, buy-side imbalance and sell-side inefficiency, measuring gap, rejection block, order block) are the speaker’s own working vocabulary, not standardised exchange classifications or documented predictive rules.
- Unofficial derivatives. Any third-party indicator, script, note set or re-upload built on these concepts is unofficial and untested here.
Watch the ICT Nasdaq Futures Recording
Deep Learning On Nasdaq Futures Trade – January 04, 2023
The Inner Circle Trader · uploaded 4 January 2023 at 10:00 p.m. Pacific (5 January in UTC) · about 92 minutes. This is the primary source for this article; every timestamp link above points into it.
The video is not embedded here because playback on other websites has been disabled for it. That was checked directly on 15 September 2026 from a BestProps page origin: the embedded player loads and returns “Playback on other websites has been disabled by the video owner” instead of playing, at both desktop and mobile viewport sizes, so no empty player is left on this page.
ICT Nasdaq Futures Trade Resources
These are the sources checked for this article. The publisher’s own channel and site are the first-party record of what ICT releases; the platform page explains the embedding restriction above; the regulator page is general material about trading systems marketed to the public. None of them assesses the speaker, verifies a statement or a level in the recording, or tests the framework described.
- Deep Learning On Nasdaq Futures Trade – January 04, 2023 The Inner Circle Trader (primary source; watch page read 15 September 2026, 92m40s)
- The Inner Circle Trader (official YouTube channel) (read 15 September 2026)
- The Inner Circle Trader (publisher’s own site and free library) (read 15 September 2026)
- YouTube Help (Embed videos & playlists) (read 15 September 2026), platform guidance on embedded playback, relevant to the restriction noted above.
- CFTC: Fraud Advisory: Commodity Trading Systems Sold on the Internet (read 15 September 2026), general guidance on how hypothetical or simulated trading results are presented to the public.
This is independent educational commentary on one speaker’s own chart review. It is not official ICT material, it is not a tested trading system and it is not investment advice. Every result mentioned above is reported from the recording as the speaker’s own account of a simulated trade. Leveraged futures trading carries substantial risk.