
Key takeaways
The Inner Circle Trader’s official YouTube recording follows a live NQ futures short built around a move below the prior low at 15,289.25 into sell-side liquidity, an inefficiency and an order block, with ICT explicitly saying he was not calling the day’s low.
Read the full summary
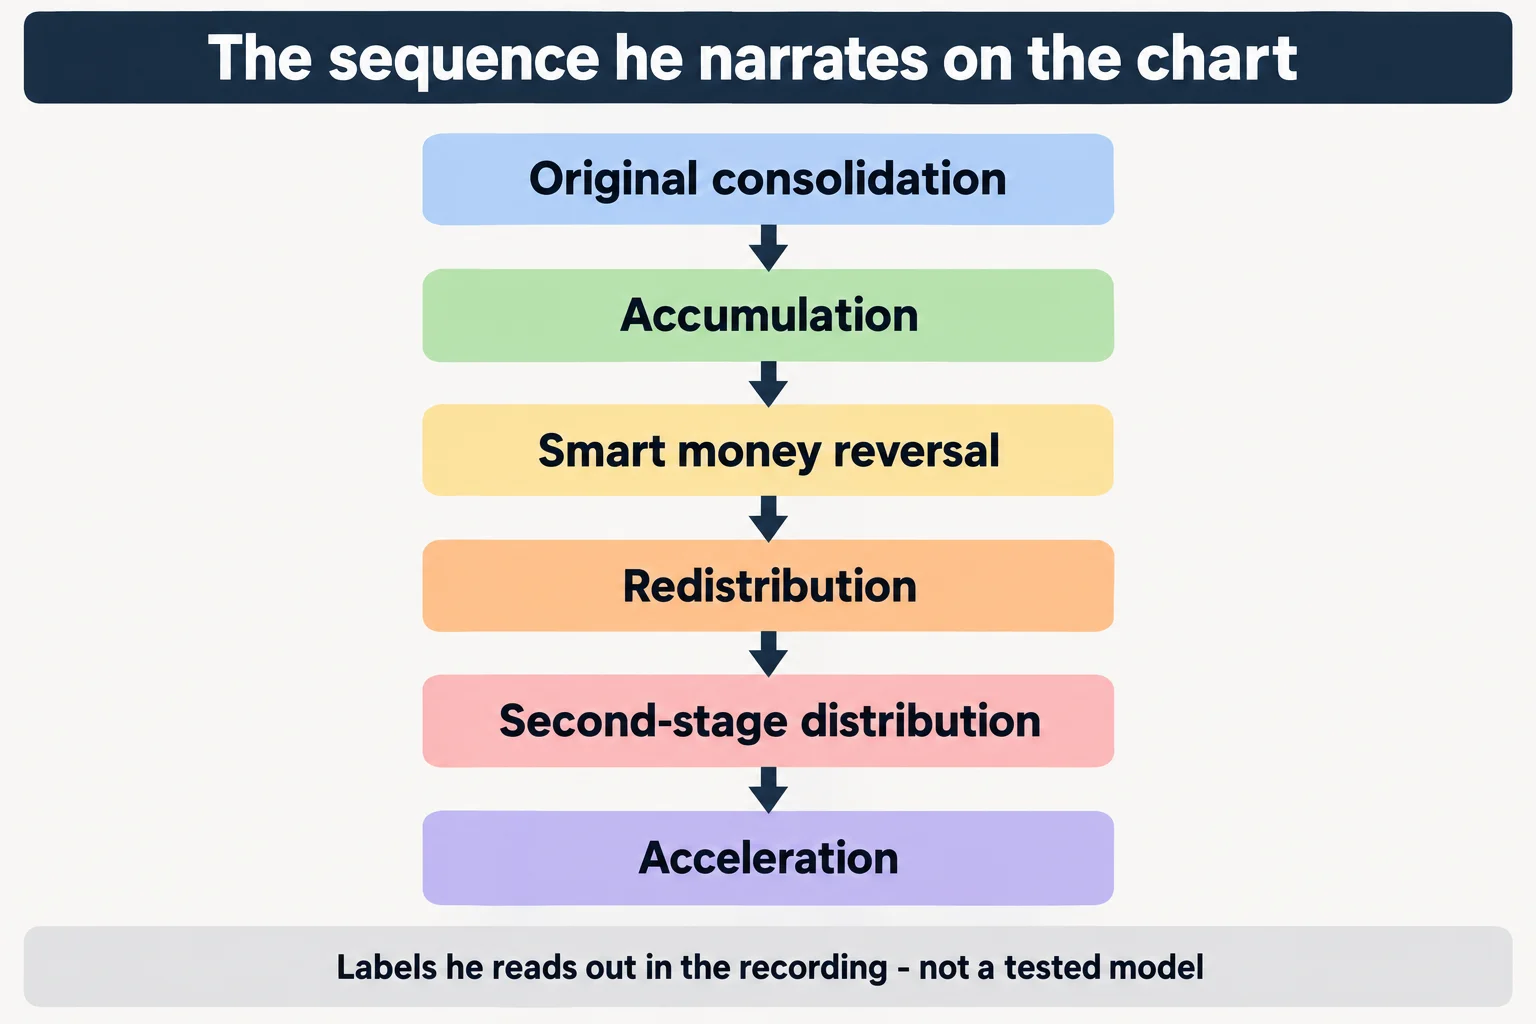
The Inner Circle Trader’s official YouTube recording follows a live NQ futures short built around a move below the prior low at 15,289.25 into sell-side liquidity, an inefficiency and an order block, with ICT explicitly saying he was not calling the day’s low. He took multiple partial exits, retained about $500 on the balance in case he was wrong, added one contract during a test of the buy-side imbalance, first trailed his stop above the mean threshold of the last up-close candle and later moved it above a rejection block, accepting either a target fill or stop-out. His chart sequence was original consolidation, accumulation, smart money reversal, redistribution, second-stage distribution and acceleration, while the final objective combined two consecutive down-close candles with a fair value gap. He highlighted the New York final hour beginning at three o’clock and stated that five ES handles equal 20 ticks while 20 NQ handles equal 80 ticks. ICT reported a $26,240 NQ day and said the displayed fills were not market replay, but the recording provides no independent account verification, risk per trade, trade count, win rate or drawdown data. The roughly 39-minute video was published on 7 July 2023, relies on machine-generated captions and presents ICT’s assumptions about resting stops and scripted price behavior without order-book, volume or positioning evidence.
How we researched this article
BestProps used document-based research from primary firm sources, checked September 24, 2026. The complete source list, scope, limitations, and commercial-state record appear near the end of this article.
The recording is a live trading session, not a lesson built after the fact, so a lot of it is waiting. He says as much himself at 34:57, explaining that he speeds these sessions up because watching them in real time is “like watching paint dry”. What survives the time compression is his reasoning at the moments he acts: where he thinks liquidity is resting, what he expects price to do with it, where his stop goes and why, and what he says he will do if the read fails.
ICT Live NQ Futures Chart Reading
He opens the chart work by reading out the order he has the day’s price action in. From 7:35 he lists an original consolidation, a run up for accumulation, then (as he says them at 7:43, 7:49, 7:50 and 7:52) accumulation, smart money reversal, redistribution, second-stage distribution and acceleration. Immediately after that run of labels he begins a sentence the captions render as “regional consolidation with…” before breaking down; that line is garbled in the source and is not reconstructed here.
At 7:27 he says the immediate expectation is acceleration lower, with a sell-side reference just below, and he adds a caveat at 8:07 that price could stretch a little further than he expects “depending on how overzealous it gets going into close”. Throughout, the sequence labels are his reading of a chart he is annotating. The recording does not measure whether the day actually followed that template.
ICT NQ Futures Trade Targets
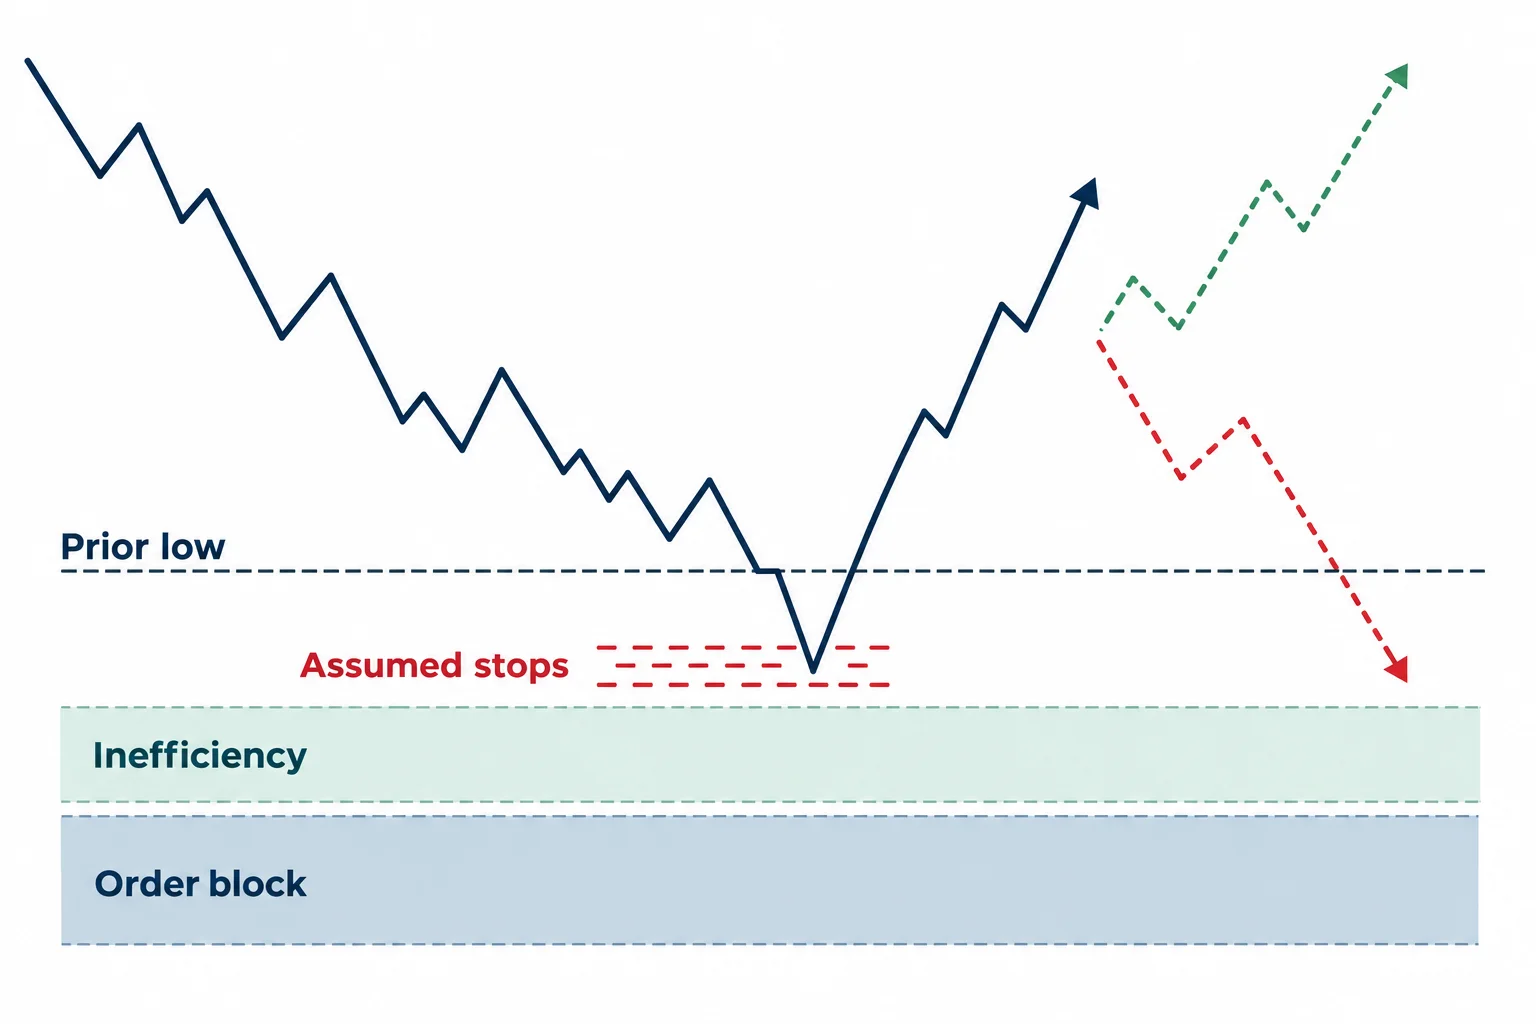
The one hard price level in the middle of the recording is 15,289.25. At 21:53 he calls that a prior low, sitting just before the run up, and at 22:02 he says stop-loss orders are sitting right below it. His argument for why price would want to deliver there is at 22:18: traders selling at a low price just under that low would be the counterparty for buying lower, and in one move price could take that liquidity and reach into the inefficiency and order block he has marked (22:25 and 22:29).
That is his framework for where resting orders sit. The recording contains no order-book, volume or positioning data, so the claim that stops are there is an assumption in his model rather than a measurement. He also keeps the target narrow on purpose: at 24:25 he says “I’m not saying it’s the lowest of the day, but that’s all I’m looking for”, and he repeats the same scope at 24:31, the completion of that particular run, inside the fractal he is reading.
He also answers the obvious counter-argument himself. At 22:54 he says he does not trust the doji candles because they promote the idea that price is going to turn and go higher, and at 23:02 he states flatly that this is not the case, then describes where he wants price to run instead. By 23:49 he describes the drop so far as neatly delivered, notes at 23:56 that an inefficiency had also been repriced, and says at 24:09 that this leaves it a “green light” for lower prices.
ICT Live Trade Management
Before the main short, he describes an attempt that went the other way. Starting at 8:17 he says he was actually trying to take a losing trade. He says the question comes up a lot, and at 8:30 that he will have to create some kind of drawdown later in the year so he can teach how to resolve one. At 8:46 he says he set the stop very close expecting it to be bumped, at 8:50 that it instead started working in his favour, and at 8:54 that he closed it and sold short on the way down, adding at 8:56.
The exits follow immediately: he says he will take three off at 9:16, takes one more at 9:23, and points to a final target that he says will close out the week (9:36 and 9:45). Further partials follow as the position runs, and at 14:25 he says around 500 will be kept on the balance “just in case” he gets it wrong, after which he says at 14:35 that the next two might fail quickly.
His stop is explained twice, and both times the logic is the same. At 14:42 he says the stop is rolled to just above the mean threshold of the last up-close candle, that he is fine with being stopped there (14:51), and at 15:04 that the same candle area is a favourite place for a trailing stop. He allows a retracement up into the inefficiency above, even one that bumps the bottom of the buy-side imbalance, and calls that permissible (15:12 and 15:17). At 16:01 he adds a contract while price tests the bottom of that same area.
The later stop move uses a different reference. At 36:47 he rolls the stop down to what he calls the rejection block on a closed candle, and says at 36:55 that he is comfortable if it stops him there. He links that level to the reason the original limit order existed (price had traded to the sell-side liquidity in what he calls the market maker sell model) and says the two remaining contracts are being framed on the small area above (37:02 and 37:09).
ICT Live Trading in the Final Hour
Time gets as much attention as price. At 23:31 he notes that the last hour of the New York afternoon session begins at three o’clock, and later he returns to it directly: at 29:49 he says to notice the time, at 29:52 says three o’clock, and at 29:57 asks whether what sits below is the liquidity under 15,289.25, with an inefficiency beneath that (30:03 and 30:04).
He frames the position as one he does not want to babysit. At 30:16 he says he does not want to see price come back up to bump the bottom of the old buy-side imbalance again, and at 30:26 that it either reaches his limit order or it stops him out and he is content with that. The same two-outcome framing recurs at 33:32, where he says that if price fails to move away from a pair of up-close candles he has to accept he may be stopped out, and at 35:51, where he says he is leaving the orders he has in place and that if they get filled it completes his week.
He also explains what he was watching for as confirmation. At 33:10 he points to a small separation between two up-close candles (the low of one and the high of the other), notes that price went up into that area twice before running below the opening of the second candle, and says at 33:28 that he wants to see price move away from the pair. His last stated objective before the close is an order block formed by two consecutive down-close candles, measured high to opening, with a fair value gap in the same area (35:30, 35:35, 35:37 and 35:45).
ICT Mentorship Trading Lessons
One aside is arithmetic he says he taught previously: five handles, or five points, equals 20 ticks in the E-mini S&P, and the equivalent on the Nasdaq is 20 handles, or 80 ticks (20:34, 20:41, 20:45 and 20:49). That is contract arithmetic, and the exchange contract specifications are the place to check it.
The other is the language he uses about the chart itself. At 21:27 he asks whether what he has drawn looks random, and answers with a run of words (engineered, coded, scripted, authored) (21:31, 21:33, 21:35 and 21:37). He returns to it at the end, saying “here we are… just like it was explained in source code” (37:51 and 37:55). Those are claims about how price is generated, and the recording offers no independent evidence for them; they are reported here as his words, not as established fact.
He also applies the psychology point to himself rather than only to students. At 31:55 he describes a stop sitting above recent highs and says that if it takes him out and price then goes to the target, that is fine, because at 32:12 it is nice to be in a position where being right is not the only acceptable result. At 32:22 he puts it as: if it reaches your target, wonderful; if it does not, you have already taken something off multiple times. The general form of that arrives at 33:47. No emotion, no reason for concern and no excitement about being right, just a continuous balancing act a trader has to maintain (33:52).
ICT Live Trade Claims and Limits
At 38:01 he reports a $26,240 day, confirms at 38:41 that the figure is dollars, and corrects himself at 38:44 to say it was on the NQ rather than the ES. He then shows the fills and argues they cannot be market replay, because he could not pull them up again after a screen change or an account reset (38:22 and 38:30). Earlier, at 25:15, he had said he would change the chart so viewers could see it was not market replay.
A caption record can carry what he said; it cannot authenticate an account, a fill or a net figure. There is no statement in the recording, no risk-per-trade figure, no trade count, no win rate and no drawdown profile, and the $26,240 is a self-reported number about one day. This should not be read as a verified result or as a reason to copy the trade.
Some things are referenced but are not in this recording. He points to a further session two days later, saying he will teach “the macro” on the Sunday at 2 p.m. (38:53), and he refers back to teaching the five-handle concept previously (20:34). Neither is contained here. There is also an ordinary domestic detail worth noting only because it dates the recording to a home setup: from 7:01 he apologises for a dryer audible in the background while he is recording in his kitchen area.
ICT Mentorship 2023 Transcript
The source for this article is the video’s own automatic captions, which are machine-generated and not human-checked. They misrender several ICT terms and one number format. The level is rendered as words (“fifteen thousand two eighty nine and a quarter”) and is written above as 15,289.25, which is what those words mean; “Bison balance”/“Bison efficiency” is used for buy-side imbalance or efficiency; “cell side” and “cell stops” for sell-side and sell stops; “SMP” for the E-mini S&P; “Order block” and “inefficiency” are rendered consistently enough to keep; and one stage label at 7:55 is too garbled to normalise and is not guessed at. The reviewer did not see the video, so every chart level, candle reading and structural claim in this article is reported as the speaker’s own description of a chart he was annotating.
Watch the ICT Live Futures Recording
ICT Mentorship 2023 – July 07, 2023 Live NQ Futures Trading
The Inner Circle Trader · published 7 July 2023 at 5:25 p.m. Pacific · about 39 minutes. This is the primary source for this article; every timestamp link above points into it.
The video is not embedded here because the owner has disabled playback on other websites. That was checked directly on 15 September 2026: the player loads and returns “Playback on other websites has been disabled by the video owner” instead of playing, on both desktop and mobile viewport sizes.
The watch page was read on 15 September 2026: playability status OK, not unlisted and not private, 2,343 seconds long, published 7 July 2023 at 5:25 p.m. Pacific. The inventory used to queue this post lists the video under a UTC date of 8 July 2023, which is one calendar day later than the Pacific publication date; the title, the watch page and the recording itself all point to Friday 7 July, and he refers to the session as Friday while describing the weekend lesson as upcoming (24:39 and 38:53). The channel is The Inner Circle Trader on YouTube, and it is the first-party record of what it uploads; it takes precedence over any reupload or third-party archive.
ICT Futures Trading Resources
These are the sources checked for this article. The regulator and investor-education pages below are general material about leveraged retail trading and about the futures contracts involved; they are not assessments of ICT or of anything said in the recording, and none of them verifies a statement made here. Any ICT, smart-money or third-party indicator, script, note set or transcript circulating outside the publishing channel’s own upload page is unofficial and untested here.
- [1] ICT Mentorship 2023 – July 07, 2023 Live NQ Futures Trading, The Inner Circle Trader (primary source; watch page read 15 September 2026, 39M03S)
- [2] The Inner Circle Trader, official YouTube channel (read 15 September 2026)
- [3] CFTC, Fraud Advisory: Commodity Trading Systems Sold on the Internet (read 15 September 2026)
- [4] Investor.gov, Glossary: Futures (read 15 September 2026)
- [5] Investor.gov, Glossary: Leverage (read 15 September 2026)
This is independent educational commentary on one speaker’s framework and his account of one trading session. It is not official ICT material, it is not a tested trading system and it is not investment advice. The only profit figure in the recording is the speaker’s own self-reported $26,240 day, which is not verified here. Leveraged index futures trading involves substantial risk and is not suitable for everyone.