
Key takeaways
In ICT Mentorship 2023 – August 19, 2023 Weekend Commentary, ICT reviews the US Dollar Index, EUR/USD, the September S&P futures contract and Nasdaq futures on weekly, daily and intraday charts, and the through-line is uncertainty rather than a forecast.
Read the full summary
In ICT Mentorship 2023 – August 19, 2023 Weekend Commentary, ICT reviews the US Dollar Index, EUR/USD, the September S&P futures contract and Nasdaq futures on weekly, daily and intraday charts, and the through-line is uncertainty rather than a forecast. He states he is neutral on the Dollar Index (1:07), reduces its outlook to two competing draws that he rates as 50/50 (4:55), and says he will wait for Monday’s behaviour and close before forming a view (6:34). He is not bullish EUR/USD and describes a conditional path through a level the captions render as 1.0865 before sell-side liquidity (12:03). He says shorts are “better for me” on the S&P while price stays below the referenced weekly high (14:15). He restates his “TGIF” rule of thumb — a week that closed lower tends to retrace roughly 20% to 30% of its weekly range late Thursday or Friday (15:45). Nasdaq is framed off a weekly bearish breaker with an intermediate-term objective measured in months (22:18). His closing instruction is to dress charts, backtest and journal for months before risking money, and specifically not to attempt a funded account in the summer months (27:58).
How we researched this article
BestProps used document-based research from primary firm sources, checked September 24, 2026. The complete source list, scope, limitations, and commercial-state record appear near the end of this article.
This is a weekend review recorded before the new trading week opened, and it says so. Everything directional in it is a conditional expectation stated over charts he was annotating, not an observed outcome, and the recording contains no win rate, sample size, backtest or account statement. The captions do not let a reader verify any chart, level or execution. It is also not investment advice.
ICT Mentorship August 19 Weekend Commentary: the Dollar Index
He opens by describing his own method rather than a trade. Most of the analysis is done on the daily chart, he says, while the weekly chart is used to establish bias (0:19). On the weekly Dollar Index he had previously been looking for price to be drawn above a short-term high where sell stops rest, but he is not convinced it will continue up to take out the next high, and the absence of inefficiency beneath current price makes a bullish read sit badly with him (0:32). His stated conclusion is a single word: neutral (1:07).
The rest of the Dollar Index section is about what he does with that neutrality. He says he does not always have a trustworthy higher-time-frame read, sometimes has to wait for Monday or the middle of the week, and may never get one that week — in which case he falls back on small intraday scalping (1:26 and 1:39). In the current instance he says plainly that he does not know what price will do and that it may simply go sideways (1:55). He then gives the reason he is comfortable sitting still: August is the month in which he says he hurt himself financially most in the early part of his career, and he has since developed a comfort with dialling back the amount of action he takes (2:33).
He is explicit about the limit on his own forecasting. He says he never knows how a market will open on a Sunday, calls that a weakness in his ability to read price, and says he has to submit himself to the uncertainty rather than try to predict something nobody can know (3:08). He describes the gap scenarios he likes to see if he is strongly bullish or, conversely, bearish into a level where buy stops would be — and stresses these are procedures and things he would like to see, not events that will necessarily occur (3:37). Forcing a trade simply because the week has opened “screams gambler” and impulsiveness to him (4:29).
That leaves the Dollar Index with two candidate draws on the week — a nearby short-term high for premium, or a lower inefficiency for discount — which he rates as 50/50 (4:55). On the hourly chart he notes the body of price staying inside an inefficiency while the action reached into a small volume imbalance and an order block and pulled away, and says the overall picture has no definitive direction and could range between the referenced high and low through Monday (5:18). The information he wants next is what the market does and how it closes on Monday (6:34). On the 15-minute chart he sets out a conditional sequence: drop to take out relative equal lows, retouch the older hourly inefficiency, then — if a rally develops — trade above that inefficiency, treat it as an inversion fair value gap, find support and expand through the high toward the weekly swing high (6:44). All of that is framed as a scenario he would like to see, not a call.
Why ICT Mentorship Recommends Less Trading in August
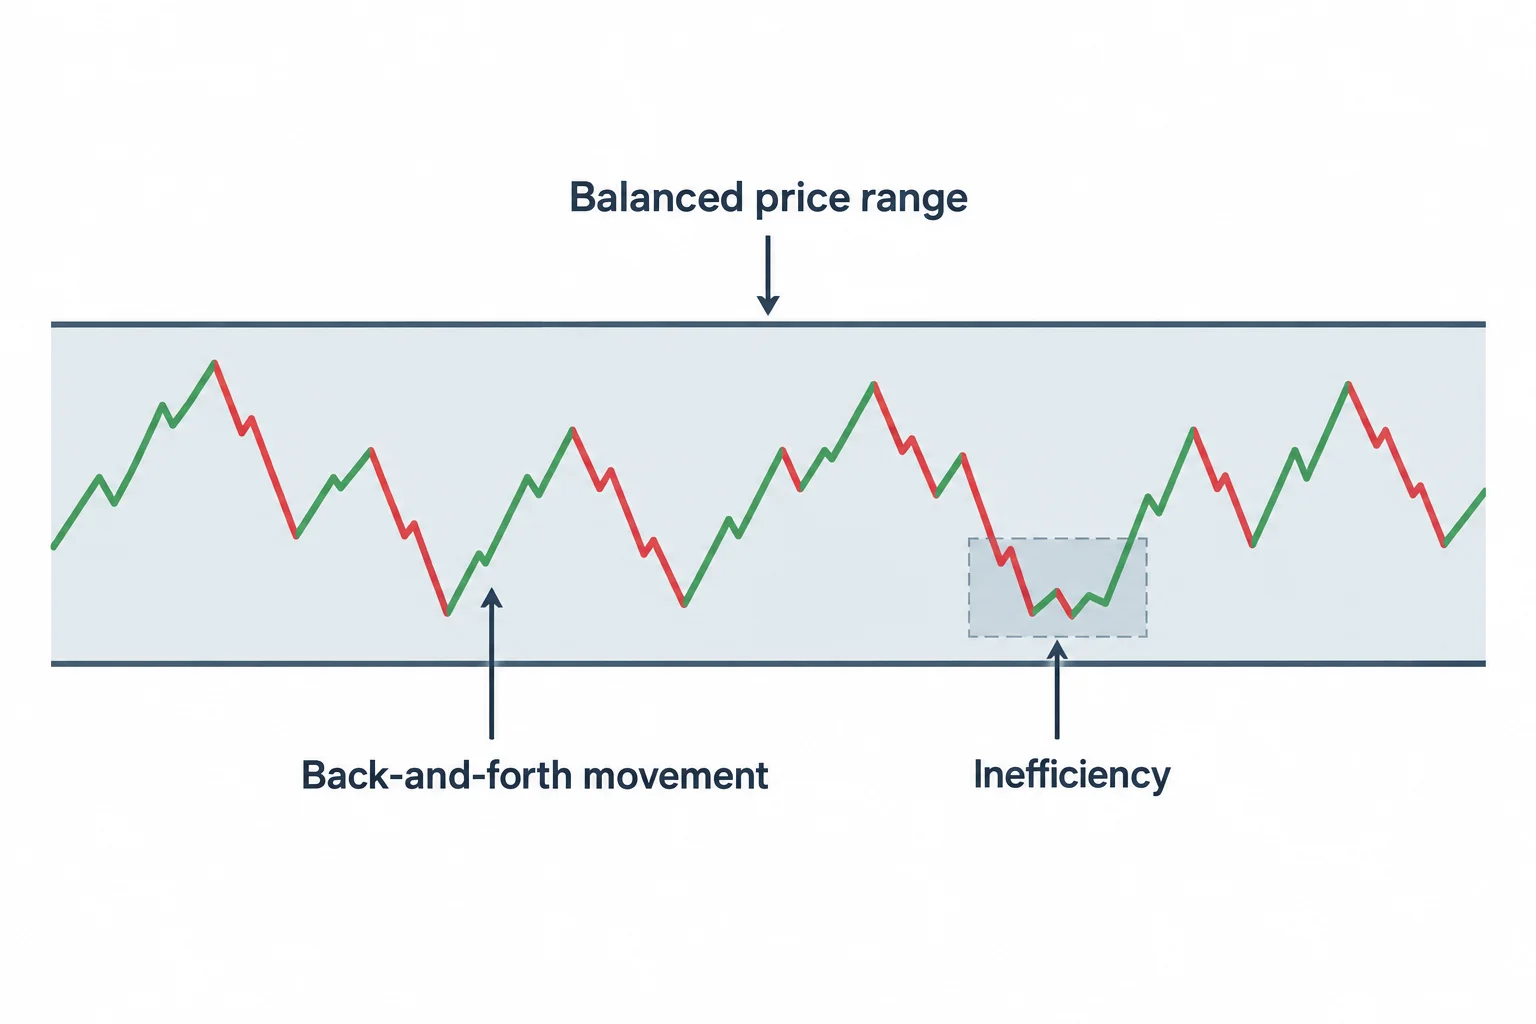
A recurring theme is that late-summer conditions do not reward activity. He describes the daily chart as having spent time inside a balanced price range with a small inefficiency inside it (2:49), and during the EUR/USD section he points to back-and-forth daily movement as the classic August scenario — give and take rather than clean, sustained runs (10:24). In his description, that makes an intraday position genuinely hard to hold unless the entry was perfect, and trailing stops unusually tricky. His stated remedy is to avoid the over-complication by not trading, or not trading very aggressively, in that month.
He also places August inside a calendar. It is, in his framing, the last month of summer before the window he expects to be more interesting — September, October and November and into the December close — and he says the market has to be weathered to get there (2:25). Later he says he believes the coming fall will bring “a whole lot more favorable price action” than the choppy summer (28:31). That is a forward-looking statement about his own expectations, not a result, and nothing in the recording tests it.
A general educational point sits underneath: uncertainty can itself be an analytical conclusion. A market review does not have to produce a directional trade idea, and waiting, observing and writing down what would change a bias are legitimate outputs of the review.
ICT August Commentary on a Bearish EUR/USD Read
The EUR/USD discussion starts on the weekly chart (7:41). He describes price having traded up into a weekly level and then breaking lower, and he says he is not bullish on the pair (9:50). On the daily chart he reads a buy-side imbalance and sell-side inefficiency that became an inversion fair value gap and acted as resistance, with price still short of the deeper weekly inefficiency (9:56). His expectation is that price reaches below relative equal lows and digs into a nearby imbalance, with what happens after that left open (11:02).
On the hourly and 15-minute charts he says the picture is not clear and describes consolidation after a failed push toward the weekly inefficiency, with buy-side liquidity building above (11:13). From there he sets out two conditions rather than a signal. He would like to see price run up into the relative equal highs, wipe them out and sell off aggressively. If instead price breaks below an area he refers to as the 1.0865 level, it should trade through it and then return to it as resistance — and, for that to stay bearish, candle bodies on the 15-minute chart should not close back above it. If price does trade back above after breaking below, he says the same area may then behave as a conventional fair value gap, which is the bullish alternative (12:03). Asked what he would favour if the market were live at that moment, he says a run to the buy side — not as a breakout thesis, but so that price can reject, come back down, treat the area as resistance and continue lower (12:46). He repeats that this is how he teaches students to state expectations before a market opens, reminds viewers that it is Saturday, that the markets are not open and that no opening of the new week has occurred, and says whether he is right or wrong is irrelevant to the exercise (13:13).
ICT Weekend Commentary on S&P and Nasdaq Futures
The S&P section opens on the weekly chart of the September contract (13:54). He identifies an inversion fair value gap above and a lower level he thinks price may reach over the fall, and says he sees nothing that requires price to travel back above the referenced weekly high. Between that high and the lower level, his stated preference is to focus on shorts — with an explicit qualification that this is better for him, not an instruction to viewers (14:15).
He then connects the review to the prior week. He says Wednesday’s commentary had called for the market to trade up initially, create a swing and sell off, and that this is what happened; he was unable to record a Thursday or Friday review, so he commented on Twitter and executed instead, and he promises a separate teaching on the Friday live trades and why he placed stops where he did (14:37). He also says the review and his tweets were focused on lower prices and that neither he nor the reviews were looking for moves higher in the S&P or Nasdaq (15:22).
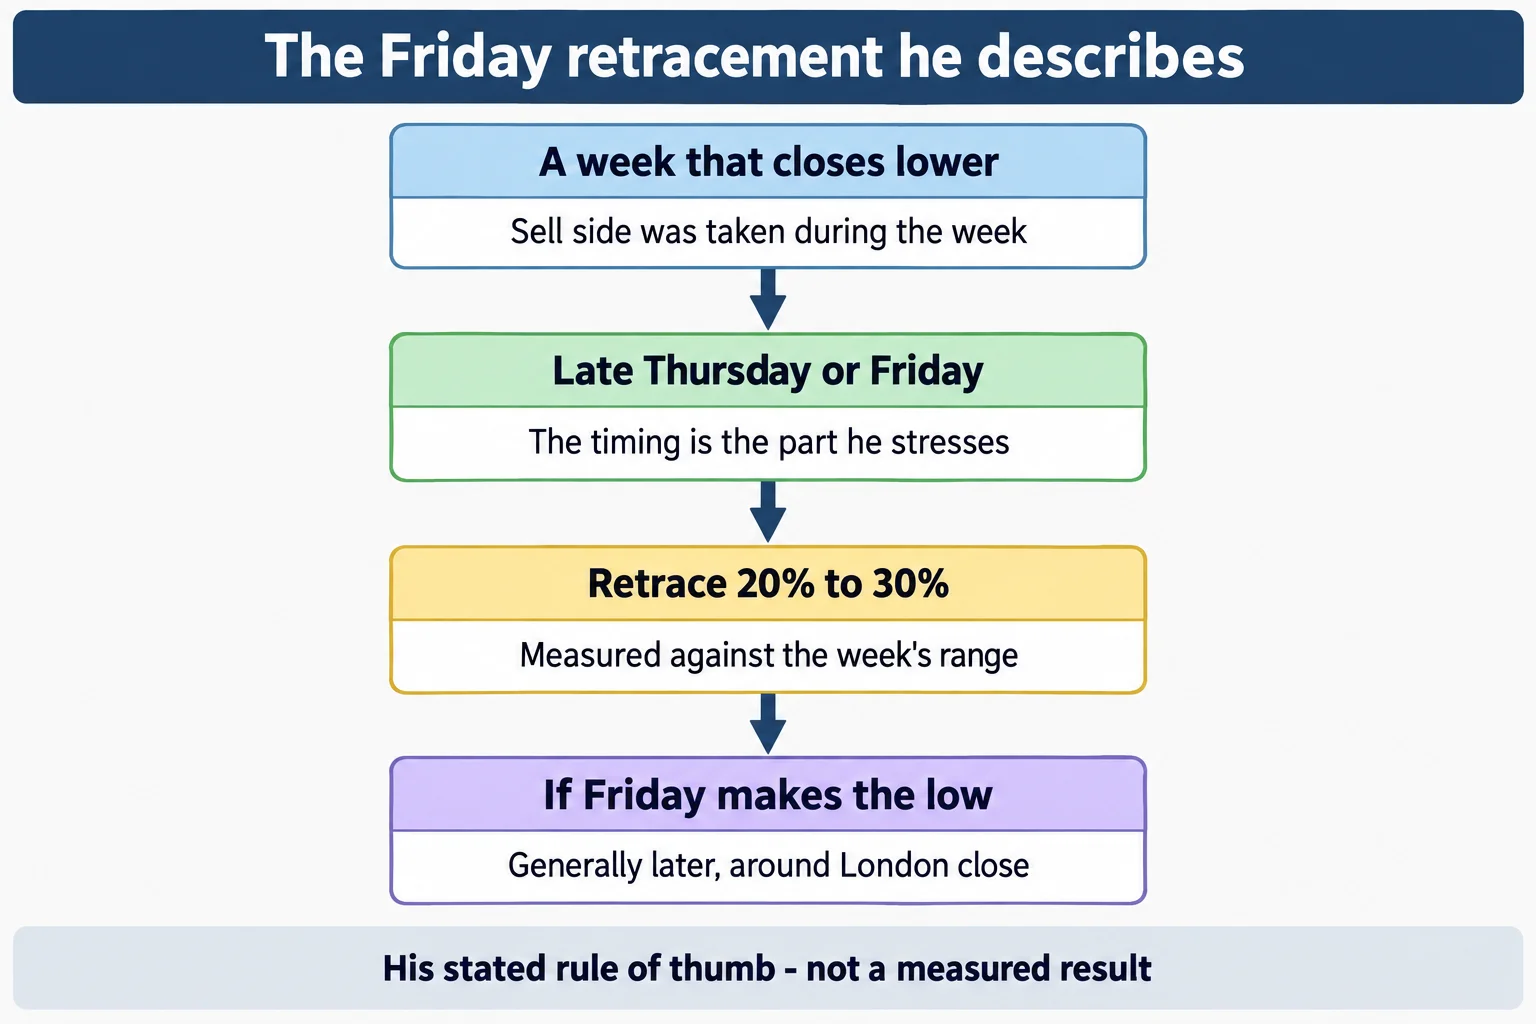
The “TGIF” rule of thumb gets its fullest statement here (15:45). In his description, a market that has declined through the week will generally retrace 20% to 30% of the weekly range on Thursday into Friday, or on Friday itself; if Friday makes the lower low of the week, the retracement tends to come later in the day, generally around the London close and the 10 a.m. to noon window, or in the afternoon session if price was consolidating through that period. He presents it as an expectation about how price retraces off a down week and how far it can come back from the lowest low made up to that point. He illustrates it with Friday’s rebound off the low. The recording states the rule; it does not measure how often it holds.
On the hourly S&P chart he walks through an inefficiency that price traded up into before breaking lower, a gap that was touched on Friday, and his stated view that the decline is not finished (17:07). The sequence he would like to see is a gap lower that attempts to fill and does not fill completely, aggressive trade below the prior low, and then a move toward an area the captions render as the “4,300 / 4,310” region (17:27). The caption digit grouping there is unreliable and the level is reported as spoken, not as a verified chart value.
The intraday teaching is where the section earns its length. On the five-minute chart he describes a shift in market structure after sell-side liquidity was taken, a rally back into an order block, and a down-close candle with a fair value gap beneath it that he calls a high-probability bullish order block (19:03). He explains why a particular fair value gap is selected: it sits over an old low where sell-side liquidity would be expected, and when market structure shifts back above such an area with inefficiency laid over it, price trading back above turns it into an inversion fair value gap for the breaker (19:39). He couples that with TGIF (20:00), says the market had been calling lower all week and “delivering like gangbusters”, and refers to viewers watching a live account “building and building” (20:12). He then returns to candle bodies: the bodies respected the gap while wicks deviated slightly beyond the line it defines, which he compares to allowing a “mohawk” outside the expected boundary, and he says it is the bodies and where they reside that carry the real storyline (20:28). A reference to a live account building is his own assertion about an account the listener cannot see; the recording contains no statement, fill or balance.
The Nasdaq review starts on the weekly chart (21:04). He points to a down-close candle that he treats as a bearish breaker, notes price trading up beyond the range defined by that candle’s high before delivering a down-close weekly candle, and applies his own 20% to 30% retracement measure to the week’s high-to-low range (21:35). That measurement is his rule of thumb applied to a past week, not a validated statistic. He says he expects continuation lower into the fall months (21:48), and frames the whole thing as an intermediate-term, quarterly objective — where he thinks price will reach over the next two to three months — aimed at a deep discount buy-side imbalance and sell-side inefficiency marked on the higher-time-frame chart (22:18). He then shows how the weekly breaker range can be carried down onto the daily chart to study reactions at its boundaries (22:38).
Two additional distinctions appear in that Nasdaq sequence. He says he deliberately leaves the ranges drawn on the charts so viewers can study how price respects higher-time-frame PD arrays in a top-down read, and insists this is not classic support and resistance (23:18). That claim — that the concepts are his own codified construction and that the algorithm follows them — is his assertion about his framework, and the recording offers no evidence for it beyond his reading of past charts. The second distinction is gap classification. He says the portion of a range he wants left open is the part that tells him whether to trust a breakaway gap or to treat the area as a measuring gap, with an expectation of drawing to roughly half the move measured from high to low (29:16). He also notes he did not include a four-hour chart on the S&P and gives a light-hearted reason for skipping it (29:41).
On the Nasdaq intraday charts he identifies an imbalance formed on the 8th as the only inefficiency on the hourly chart, notes price dug into it on Friday after trading below an old low (30:03), and describes what he wants next: trade below the consequent encroachment of a wick, treat that level as resistance, sell aggressively lower, and move toward an area the captions render as “14,420 to 14,430” (30:53). As with the S&P level, the caption grouping is unreliable and the numbers are reported as spoken. He then says the week was choppy, that Friday was a very difficult day to teach and point things out in advance, that he therefore left public commentary alone and did his own executions, and that he shared those executions on Twitter and posted a silent upload of his trading before this video (31:50 and 32:19). None of that material is in this recording and none of it is verified here.
The five-minute chart is, in his words, the backbone of what he was watching while trading the S&P — with the S&P on one side of his screen and the Nasdaq on the other, and he says he will explain in a follow-up why he traded the S&P rather than the Nasdaq (33:15). He closes the sequence with a bullish breaker, bodies respecting an inversion fair value gap, an order block, relative equal highs taken as buy-side liquidity, and price being driven higher into what he calls the TGIF objectives for the weekly range — the same 20% to 30% retracement of the week’s down-close candle, this time applied to the Nasdaq, before coming off the highs into Friday’s close (34:18).
ICT Mentorship Practice Before Trade Execution
The last major instruction is about preparation, and it is blunt. He says the only way to learn to see these arrays is to dress your charts repeatedly for months, that it will feel unproductive, and that the feeling is normal (23:34). He adds that anyone who rushed into trading before understanding the material should not complain to him, and that he mutes those complaints — while noting he is sympathetic to people who are struggling but cannot teach someone unwilling to follow instructions (24:12). The work he names is tedious backtesting, journaling, studying what price has done and writing down what it may do next, then comparing the expectation with what actually happened at week’s end (27:17).
He then adds a caution that matters directly to anyone using a prop-firm or funded-account route. He tells new viewers not to watch his videos and conclude they can trade a real-money account, and says that in August no one should be trying to obtain a funded account at all (27:58). He repeats it: don’t try to get a funded account in the summer months, and it is easier when the market is more fluid in spring and fall. The stated reasoning is the choppiness described throughout the review, not a rule with any measured outcome behind it.
A practical study routine that follows from the session would be:
- Start on the weekly chart and record whether a directional bias is genuinely clear, or says so when it is not.
- Mark the daily areas that could attract price in either direction, and write both the bullish and bearish conditions at each.
- State what should happen at a specific candle for the idea to remain valid — the recording repeatedly defines invalidation this way.
- Wait for intraday behaviour to confirm or invalidate the higher-time-frame idea rather than assigning confidence in advance.
- Journal the expectation before the week and compare it with the outcome at week’s end.
What the Recording Does Not Establish
The recording is a weekend review over annotated charts. It contains no win rate, no sample size, no backtest output, no drawdown profile, no risk-per-trade figure and no account statement, and no trade in it is identified as a real-money fill. The 50/50 rating on the Dollar Index, the 20% to 30% retracement and the reference levels are his stated reads and rules of thumb, not measured outcomes. Where numbers appear they are reported here as the captions render them, and the caption digit grouping for the S&P and Nasdaq levels is unreliable.
Several things are asserted verbally and cannot be checked from this source. He refers to a live account “building”, to executions shared on Twitter and to a separate silent upload of his trading, and he describes prior commentary from Wednesday and his tweets as having called for lower prices; none of that is contained in this recording. He also states that his concepts are his own codification that the algorithm follows, promotes forthcoming books on the subject and criticises existing third-party books and former students. Those are his claims, not findings, and this article reports them as statements made during the review.
Watch the original recording
ICT Mentorship 2023 – August 19, 2023 Weekend Commentary
The Inner Circle Trader · uploaded 19 August 2023 · about 35 minutes. This is the primary source for this article; every timestamp link above points into it.
The video is not embedded here because the owner has disabled playback on other websites. That was checked directly on 15 September 2026: the player loads and returns “Playback on other websites has been disabled by the video owner” instead of playing.
The watch page was read on 15 September 2026: playability status OK, not unlisted and not private, 2,091 seconds long, published 19 August 2023. The channel is