
Key takeaways
In ICT Mentorship 2023 – Market Review & When Wrong Is Still “Right”, ICT reviews the Dollar Index and EUR/USD and makes one argument the rest of the recording rests on: holding a wrong directional expectation is not the same thing as taking a loss, because he says he was neutral and never took the…
Read the full summary
In ICT Mentorship 2023 – Market Review & When Wrong Is Still “Right”, ICT reviews the Dollar Index and EUR/USD and makes one argument the rest of the recording rests on: holding a wrong directional expectation is not the same thing as taking a loss, because he says he was neutral and never took the trade (5:19 and 12:22). He lays out the conditions a EUR/USD short would have needed — bearish displacement lower, then a retracement back into a fair value gap — and says none of it formed when price rallied instead (13:45, 13:54 and 14:22). The second half turns to the E-mini S&P and to an execution he calls a Silver Bullet trade, which he reports netting over $10,000 on a five-contract add (30:03); that is a self-reported figure and nothing in the recording verifies it. He published the recording on 9 June 2023 and signs off saying he will be quiet on Twitter over the weekend.
How we researched this article
BestProps used document-based research from primary firm sources, checked September 24, 2026. The complete source list, scope, limitations, and commercial-state record appear near the end of this article.
Roughly the first half is a market review and the second half is trade management, but the thread running through both is a distinction he says critics miss: an opinion formed while looking at a chart is not a commitment to incur risk. He frames this himself as settling expectations (5:46), saying he is not trying to dazzle anyone with being correct but to teach viewers how to manage themselves (5:56), because the material has to stand as rule-based ideas once he stops posting (6:05).
The Dollar Index and EUR/USD, as he reviewed them
He opens on the weekly Dollar Index chart (0:35) and restates the condition he says he gave in the previous Wednesday’s commentary: he would keep a bullish dollar and bearish euro bias unless that low was taken out and price traded back into the inefficiency (2:50 and 2:54). Price did move down to that low, which he notes at 0:58, and he says at 2:57 that a trade below it followed by a return would have him treat the area as resistance instead.
One honest detail about the recording: he says he is screen-sharing Thursday’s data on a Friday, that the presentation will cover Thursday plus part of Friday, and that he has to be on the road so there will be no final review of the week (3:09 and 3:37). He also states plainly that he is not trading forex at all and is using the dollar as a risk-on/risk-off barometer rather than as an instrument, which he says at 1:03 and again at 10:53.
He works two price levels on the dollar by name: 104.54, which he calls the weekly mean threshold of a bearish order block he had been working with (4:43 and 4:45), and the daily order block opening price he says he mentioned at the time (4:47). He describes how he draws the breaker: high, low, higher high and down-close candles, using the lowest close rather than one wick, expanding that range to the right (3:48, 3:53 and 3:59). He summarises that reading with an expression he says he has used for years: the volume narrative is inside the bodies, and the wicks do the damage (4:01).
The condition he set, and why he calls it predictive rather than reactive
At 7:35 he says the drop into the low has him potentially, though not entirely, shifting bearish, and that he wants more evidence on the daily chart — specifically price below the inefficiency and that inefficiency treated as resistance. The sentence he then uses is the one the article title comes from: he calls it an if-then clause, “if the market will do this then I will do that”, and he says at 8:07 that he is predicting rather than reacting.
He is explicit that the condition is what lets him do nothing. At 8:22 he says it is a condition for allowing himself to sit still and relax rather than rush into another trade idea, and he adds that many viewers need exactly that skill. He also names when he would be interested in acting: the London open, the New York open, or the New York close, and only where the dollar lines up with EUR/USD (13:27 and 13:40).
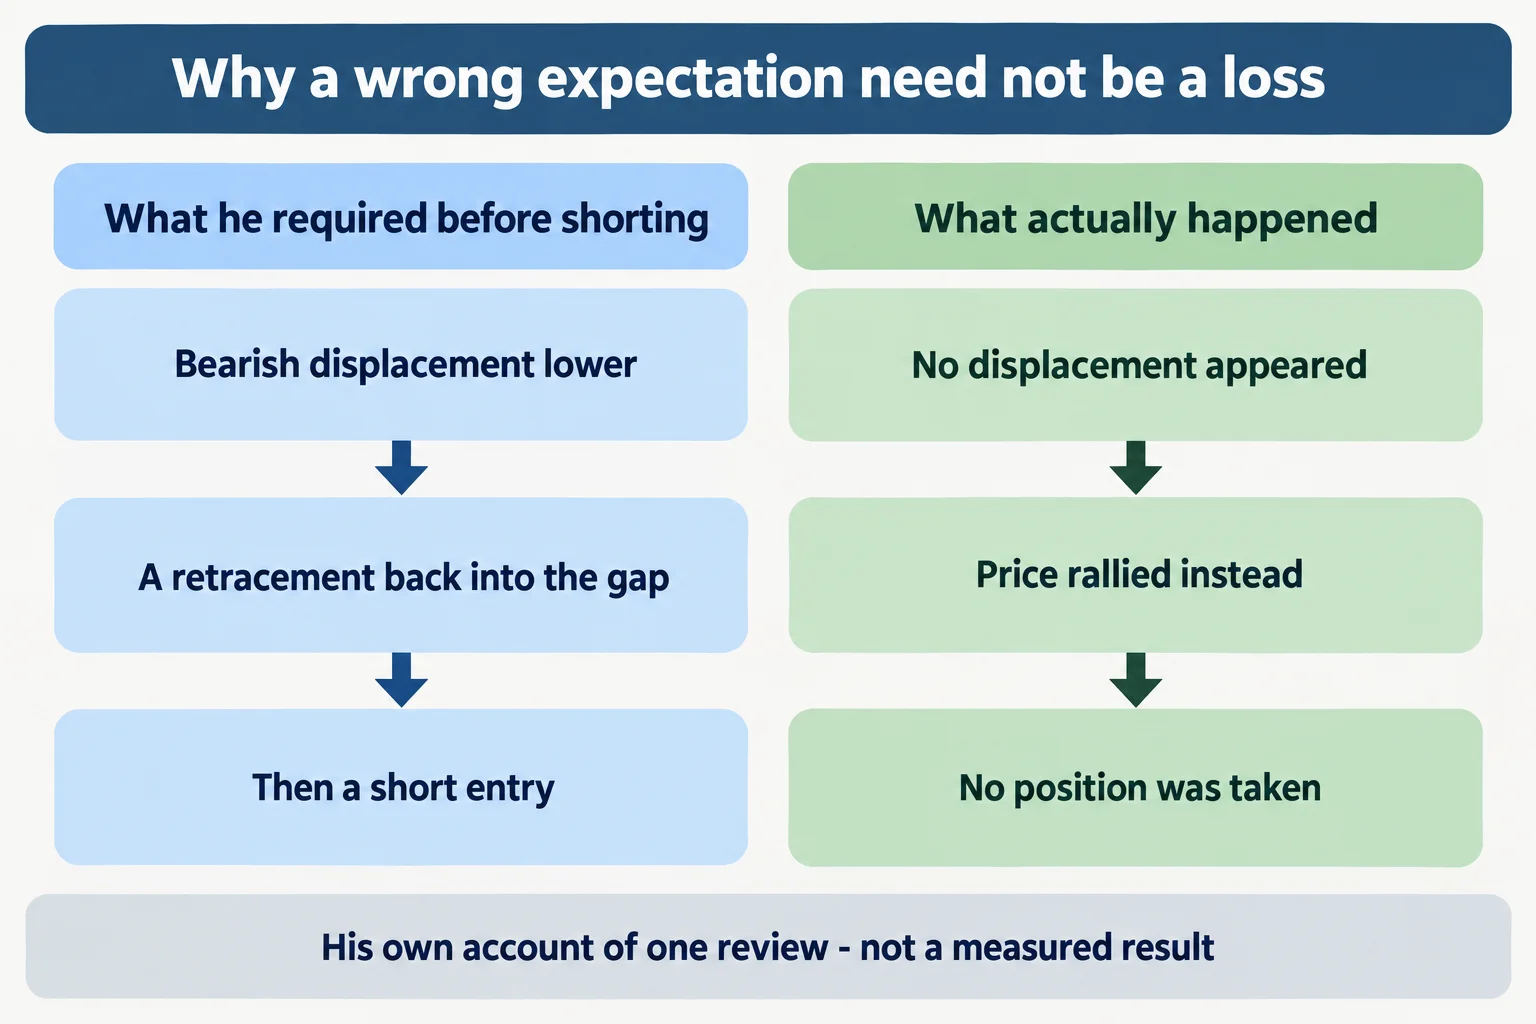
“Wrong in expectation” but not a losing trade
He makes the case using his own earlier call as the example. At 12:25 he reminds viewers that when he said he was neutral that meant he had no interest in taking trades, and at 12:59 he puts the test in the form he wants viewers to use: if the market does not present the conditions for that short to manifest itself, there is no reason to be upset. The specific mechanics he lists at 13:45 are the relative equal lows he was aiming for, and the question he asks immediately after is whether the market showed any displacement lower after Wednesday’s commentary, created a fair value gap and traded back up into it. His own answer, at 13:59, is no: price rolled up out of the area, came back down into an imbalance while he was asleep, then rallied and attacked the high.
That is where the phrase lands. At 14:22 he says the outcome was profitable in the sense that there was no monetary loss, but wrong in expectation, and at 14:30 that no ego is bruised because no setup failed — none appeared. He repeats the narrower version at 15:54, saying there was no losing trade and no missed opportunity for a short because it simply did not manifest and price went the other way, having said at 15:34 that no kind of losing trade did manifest. He then generalises at 16:16 into the point he wants remembered: the same reading that kept him out of a losing trade is the thing to credit, even though it also cost him the move he wanted to participate in.
The contrast he draws is between acting on a defined price condition and acting on something looser. At 16:35 he says the market will sometimes do things that were not anticipated and that part of it will be wrong, and at 16:59 he contrasts his approach with indicators or a “black box” that keeps issuing buy and sell ideas, which he calls randomness from his perspective. At 18:52 he argues the setup either manifests or it does not, and that if it does not, the trader either has to adapt, reverse or do nothing — noting at 18:59 that he was asleep while the move he wanted to trade happened.
He also addresses why he said anything at all. At 18:35 he says that with a gun to his head he has to give an opinion, at 18:49 that he would have preferred to see the market run those lows, and at 19:00 that it gave nothing to act on, so there was no reason for anyone to be upset. Whether the criticism he anticipates is fair is not something the recording settles; it is his account of it.
The E-mini S&P scenario he had described earlier
He then switches to index futures, which he says is where his focus has been (19:13). On the weekly E-mini S&P he notes that price did trade higher into the weekly gap with buy-side resting there and a volume imbalance beyond it, and that the Nasdaq had already traded into its secondary volume imbalance while the S&P had not yet taken out its high (20:42, 20:46 and 20:59). He says at 21:09 that unless it completely crashes he will keep looking for that high to be traded into.
The study he had set out two days earlier was precise: a wick on the hourly chart, the midpoint of it, which he calls consequent encroachment, identified at the 24 minute 5 second mark of Wednesday’s commentary (21:17, 21:28 and 21:41). He ties that wick to the weekly gap low and high and to the relative equal highs above, and repeats the line he says he used on Wednesday: that he never liked retail treating smooth areas as resistance, and that smooth edges like to be made jagged (23:05, 23:16 and 23:23).
His description of the outcome is that price dropped into the wick, cleared the relative equal lows, took the short-term high, dropped back in and then ran through the area he had marked — and he describes the move through the retail resistance as a hot knife through butter (24:52, 24:59 and 25:39). He frames the sequence as the payoff of analysis rather than a prediction newly made here: at 24:43 he invites viewers to check the earlier video and says he does not let comments appear on YouTube because of crypto advertising. He also says at 22:00 that this kind of wick midpoint does not appear in textbooks, and at 22:51 that it soon will because people will start writing books about it. He also concedes a presentation problem of his own at 28:09: he does not always say which time frame he is on, and says he is trying to do better about it.
The Silver Bullet execution he reports, and his rule about partials
He points viewers to a link in the comments for the recorded execution and says the trade ran in this price range on Thursday (25:48, 25:51 and 27:34). The levels he names are 42.90.50 on the hourly swing high where he says buy-side resides, and the inefficiency he wanted to use, with his limit order placed just below that level to allow for the spread (26:04, 26:10 and 29:49). He says the imbalance he traded was on a two-minute chart (28:16 and 28:18).
His account of the management is specific. He says he drew the gap out before price dropped into it and bought as it slammed in, then watched it trade higher and come back down, and that he was pyramiding with a five-contract addition (28:21, 28:26 and 28:34). The basis was what he calls his bullish breaker — price trading above a high and then retracing into it as a reason for the algorithm to reprice higher, an area price spent time in three separate times before it ran (28:39, 28:47 and 28:54). He took five contracts off above the short-term high at 42.88, which he says is also inside the older hourly imbalance, and explains the choice as proximity to the 42.90.50 swing high (29:04, 29:07 and 29:19). He then says the stop was hit on the remainder, after price reached the 42.90 level he was looking for, two ticks below the hourly old high (29:30, 29:40 and 29:43).
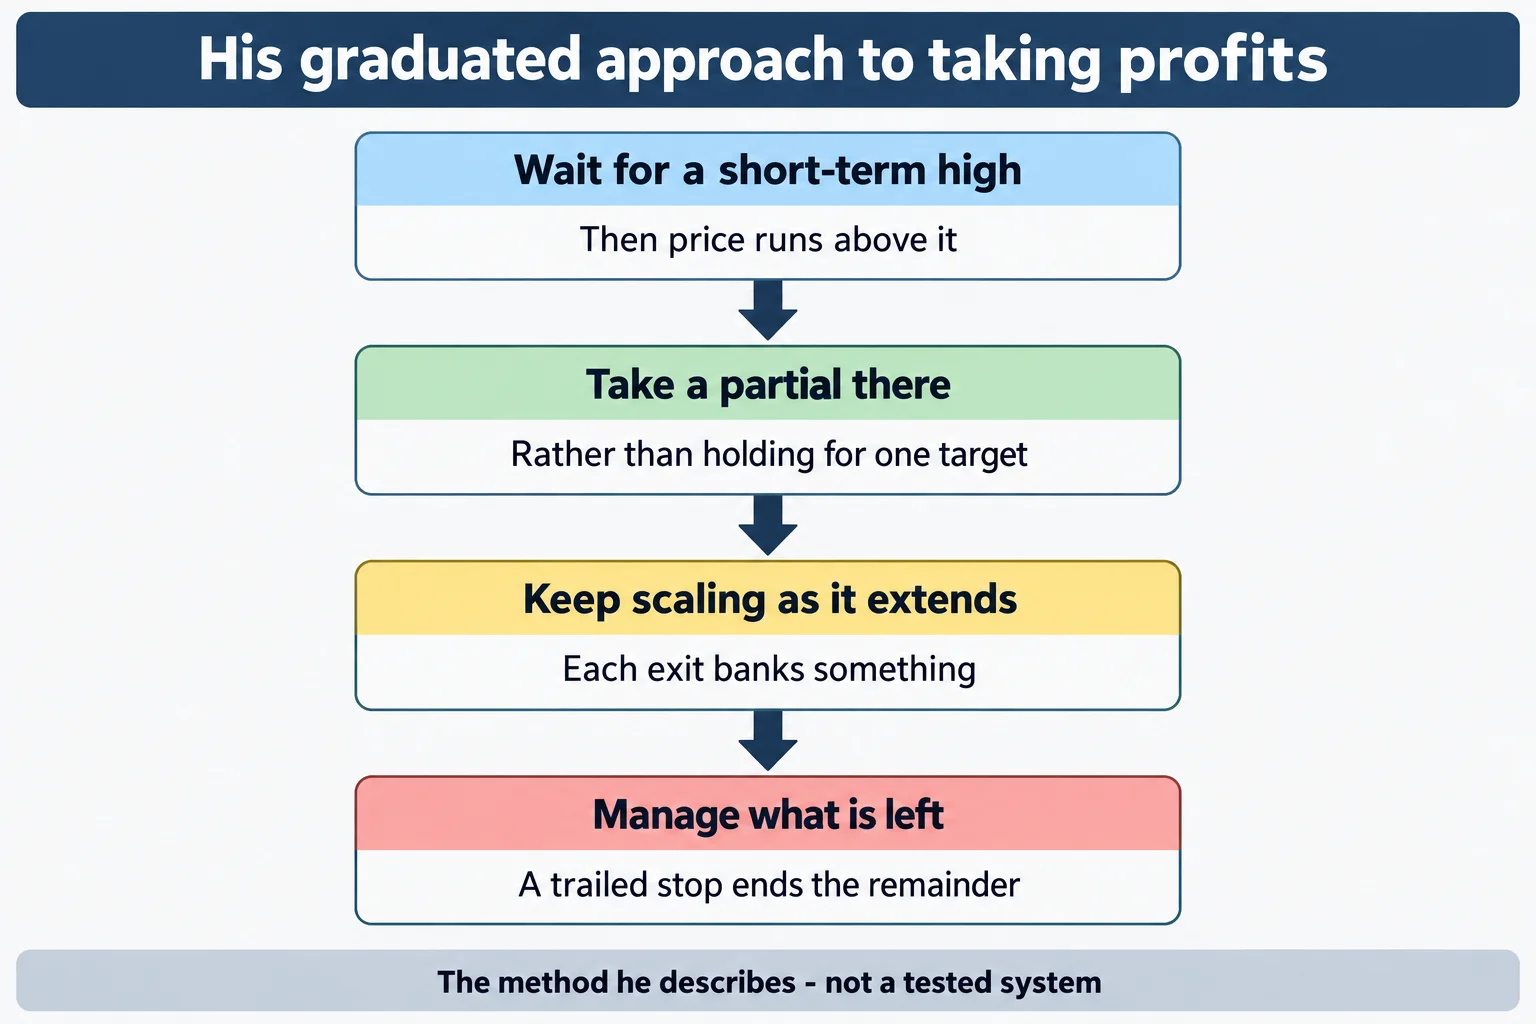
The rule he states while explaining that exit is the most reusable part of the recording. At 26:37 he says that when you are bullish and price makes a short-term high and runs above it, you want to take partials there, and he calls this running down equity as you approach a target or get three quarters of the way to an objective. At 26:42 he asserts that partials always pay and that no partial profit has ever failed to pay. At 26:55 he says this is what he teaches traders who are learning to find consistency, and at 27:03 that insisting on a single entry, single stop and single target is what makes learning frustrating.
He then reports the size of the result. At 30:03 he says the trade was over $10,000 in a single trade, and notes at 30:06 that by any standard that should be a good month, not just a trade. He immediately qualifies the framing himself: at 30:20 he says it is not meant to instil the idea that a trade has to be that large to be acceptable, that any profitability is good, and at 30:52 that a viewer does not need to trade that many contracts. He adds at 30:57 that one contract, one addition and an exit in the same place would be a fine outcome. He closes by saying he will be quiet on Twitter over the weekend with his family and will be back on Monday (31:10 and 31:16).
What the recording does not establish
Everything about the execution is his description. The recording contains no statement, no trade count, no risk-per-trade figure, no win rate and no drawdown, and the execution footage he points to is a link in the comment section to a post on Twitter — outside this video and not part of what is reviewed here (0:23 and 27:30). Captions cannot authenticate a fill, an account or a net amount, so the over-$10,000 figure is reported here as a self-reported claim about one trade and not as verified performance.
Two claims about the market also stand as his interpretation rather than as established fact. The first is that a wick’s midpoint matters because “it means something to the algorithm” (23:58 and 24:00) — a claim about how price is generated, offered without evidence in the recording. The second is the assertion that partials always pay (26:42); taking profit on part of a position does reduce the risk still carried, but that is not the same as the stronger claim that a partial cannot be the wrong decision. He also says at 31:19 that he will talk to viewers again on Monday, and the recording does not contain that follow-up.
On the transcript used here
The source for this article is the video’s own automatic captions, which are machine-generated and not human-checked. They misrender several ICT terms and expressions: “cell side” for sell-side, “bison efficiency” for buy-side imbalance or efficiency, “volume of balance” for volume imbalance, “inefficiency” for the imbalance he names, “cell stops” for sell stops, “consequent encroachment” rendered cleanly but abbreviated elsewhere as “the mm data”, and “42.90.50”/“42.88” for the two levels he reads out. Where the term is unambiguous from context it has been normalised; the level near 42.90 is written as he said it. The reviewer did not see the video, so every chart level, candle reading and structural claim here is reported as the speaker’s own description of charts he was annotating.
Watch the original recording
ICT Mentorship 2023 – Market Review & When Wrong Is Still “Right”
The Inner Circle Trader · published 9 June 2023 at 8:50 a.m. Pacific · about 31 minutes. This is the primary source for this article; every timestamp link above points into it.
The video is not embedded here because the owner has disabled playback on other websites. That was checked directly on 15 September 2026: the player loads and returns “Playback on other websites has been disabled by the video owner” instead of playing, on both desktop and mobile viewport sizes.
The watch page was read on 15 September 2026: playability status OK, not unlisted and not private, 1,887 seconds long, published 9 June 2023 at 8:50 a.m. Pacific. He records it on a Friday and says the charts shown are Thursday’s data plus part of Friday’s action, which is how the presentation dates itself inside the recording (3:09 and 3:37). The channel is The Inner Circle Trader on YouTube, and it is the first-party record of what it uploads; it takes precedence over any reupload or third-party archive.
Resources
These are the sources checked for this article. The regulator and investor-education pages below are general material about leveraged retail trading and about the futures contracts involved; they are not assessments of ICT or of anything said in the recording, and none of them verifies a statement made here. Any ICT, smart-money or third-party indicator, script, note set or transcript circulating outside the publishing channel’s own upload page is unofficial and untested here.
- [1] ICT Mentorship 2023 – Market Review & When Wrong Is Still “Right” — The Inner Circle Trader (primary source; watch page read 15 September 2026, 31M27S)
- [2] The Inner Circle Trader — official YouTube channel (read 15 September 2026)
- [3] CFTC — Fraud Advisory: Commodity Trading Systems Sold on the Internet (read 15 September 2026)
- [4] CFTC Learn & Protect — Forex Frauds (read 15 September 2026)
- [5] Investor.gov — Glossary: Futures (read 15 September 2026)
This is independent educational commentary on one speaker’s framework and his account of one review. It is not official ICT material, it is not a tested trading system and it is not investment advice. The only result figure is the speaker’s own self-reported over-$10,000 trade, which is not verified here. Leveraged index futures and foreign-exchange trading involve substantial risk and are not suitable for everyone.