
Key takeaways
ICT frames a “macro” as a short window — usually about 20 minutes — in which he expects price to begin reaching for liquidity or an inefficiency, and this lesson is explicit that the window carries no directional bias of its own.
Read the full summary
ICT frames a “macro” as a short window — usually about 20 minutes — in which he expects price to begin reaching for liquidity or an inefficiency, and this lesson is explicit that the window carries no directional bias of its own. Working through a July 2023 non-farm-payroll Friday on a Nasdaq chart, he builds the narrative on a daily bullish propulsion block, its consequent encroachment (the midpoint between that candle’s high and its opening price), an hourly fair value gap, relative equal lows and lower-time-frame order blocks. He names the 7:00–9:00 a.m. New York open kill zone, the 8:30 a.m.–noon morning session and the 10:00–11:00 a.m. Silver Bullet, then teaches two shorter windows in detail: 9:50–10:10 a.m. and 10:50–11:10 a.m. New York time. His non-farm-payroll profile — an initial run at one side, a reversal to the other, then the real move — is presented as typical rather than guaranteed, and he says that when a window produces no movement toward his mapped objective he stops looking for a setup in that session. Level readings, executions and results are his own account of his chart; the captions cannot verify them.
How we researched this article
BestProps used document-based research from primary firm sources, checked September 24, 2026. The complete source list, scope, limitations, and commercial-state record appear near the end of this article.
In ICT Mentorship 2023 – Algorithmic Price Delivery & Time Macros Intro, published on 9 July 2023 and running 35 minutes 49 seconds, ICT opens by describing the session as a lesson on the time elements of algorithmic price delivery and an introduction to ICT macros. His framing comes first: without context, knowing the specific times of day that carry a macro label does not help, and he spends the opening minutes on a chart narrative before naming a single window.
The source used here is the auto-generated English caption track for that recording, read in full. It supports what the speaker says about his own method and his own trading; it cannot confirm chart coordinates, order fills or outcomes, and this article makes no claim to have inspected the charts themselves.
A July 2023 non-farm-payroll Friday, and a Thursday candle
At 0:10 ICT sets the lesson up on a Nasdaq daily chart and says he wants to give context for how he used the macro on a Friday non-farm-payroll session. The publication date on the video is 9 July 2023; the session he reviews is the recent Friday in that same month, which is what the caption stream says rather than a date recovered from an inventory.
His entry point is a down-close daily candle he says he examined the previous Thursday. At 1:14 he points to its wick, and at 1:25 he says his eye goes immediately to the midpoint of a tail or wick: in his terminology that midpoint is consequent encroachment, because he treats the wick as a gap. From there, at 1:35, he notes that Friday opened and traded higher, coming close to that midpoint.
He also flags an important limit on what he says ahead of a release. Having said at 3:08 that he posted on Twitter before the 8:30 a.m. release favouring buy-side over sell-side liquidity and looking for the higher side to be run first, at 3:39 he says he was expecting an initial rally and perhaps a challenge of the high, and at 3:52 he qualifies how much that expectation is worth ahead of the release: “it’s a guessing game in the beginning.”
Why that candle counts as a bullish propulsion block
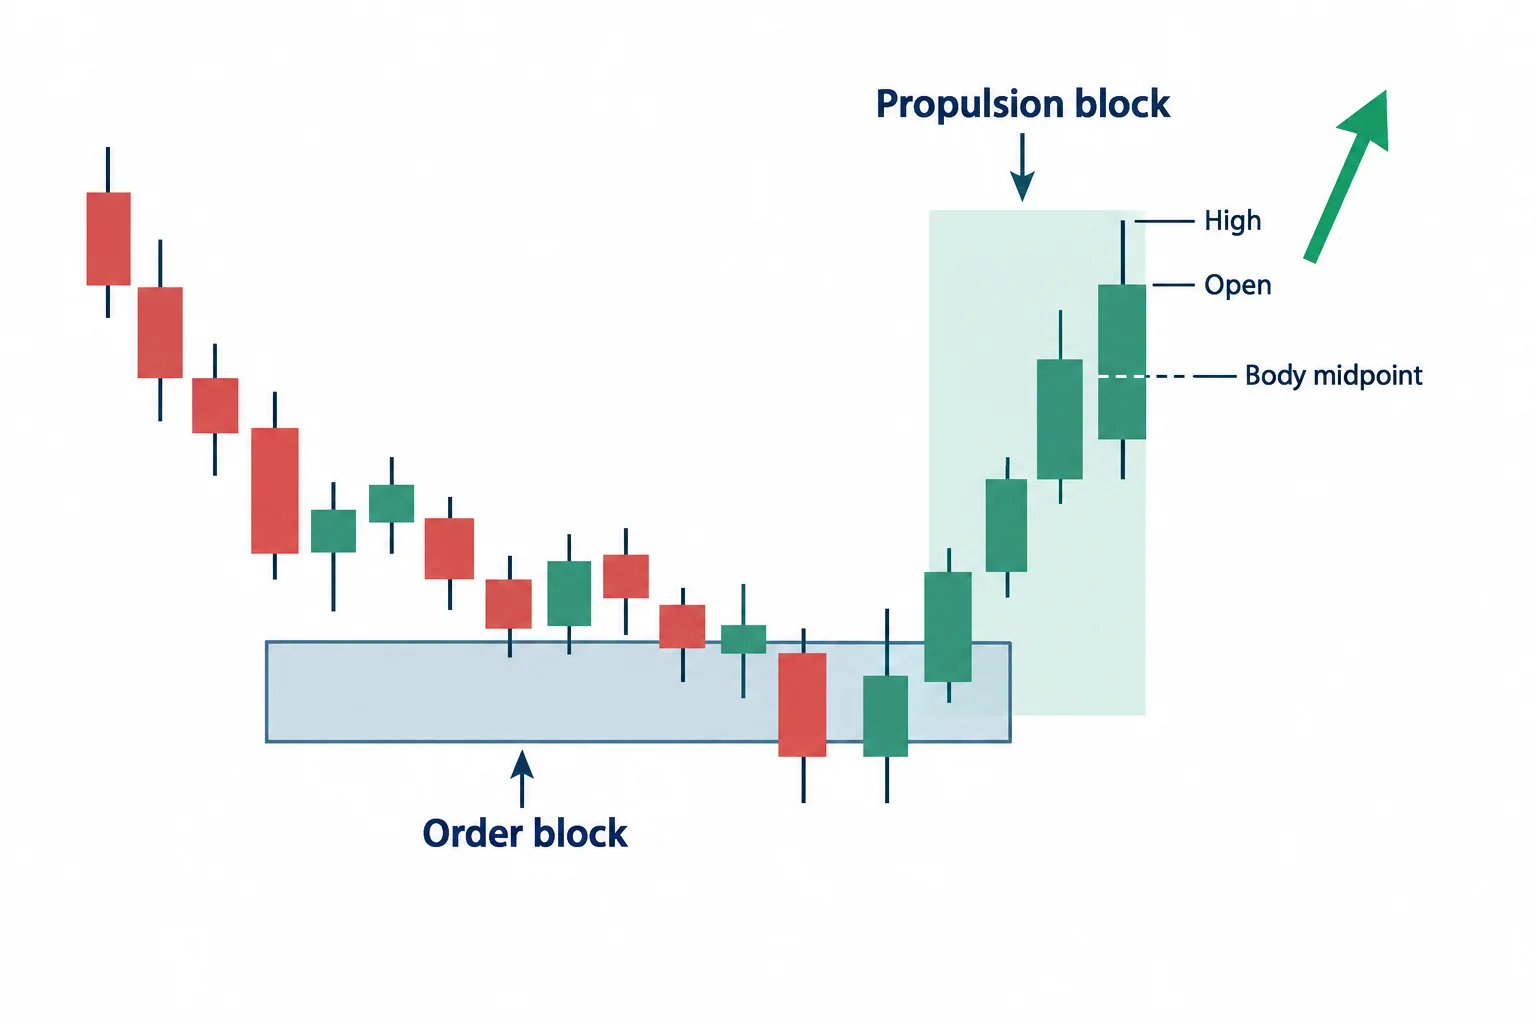
The definition matters because it is not the usual one. At 2:00 ICT says he is using the candle’s high and its opening price — expressly not the mean threshold of the body and not the mean threshold of the whole high-to-low range — and that this was the last down-close candle before the run up. He then classifies it more narrowly at 2:27 as a propulsion block, which he says works off an earlier order block: the later block digs into the earlier one, but he does not want to see price trade below half of the later candle’s body. In this instance it came close without getting there, which he reads as a reason to keep anticipating higher prices the next day.
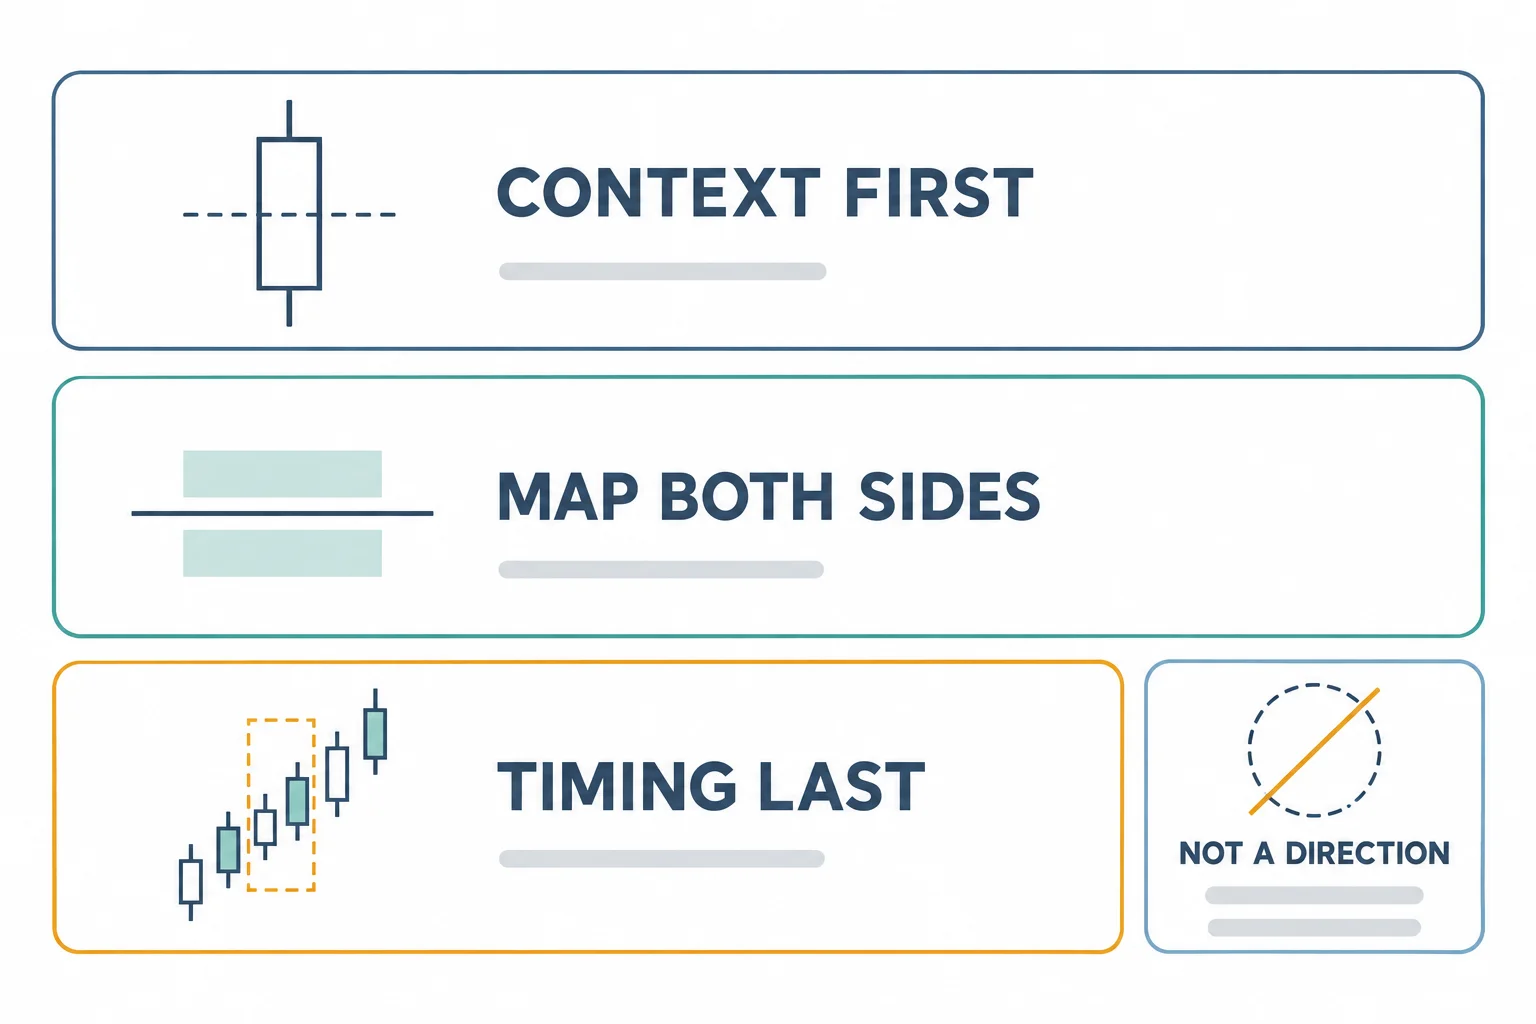
He is equally clear that the structure alone does not decide the session. At 5:22 he says the daily read gives him narrative — “absolutely crucial to understanding what a macro will do” — and at 5:33 he rules out the opposite reading of the lesson: a named time of day is not “a magic pill” that replaces understanding what price should likely do.
How he describes non-farm payroll typically performing
At 3:57 ICT describes the post-release behaviour he works from: after the 8:30 a.m. news hits, what he calls manual intervention can take both sides of the marketplace — buy side then sell side, or the reverse — before the real move develops, and he therefore treats the event as generally a whipsaw.
He also warns that the event degrades the very structures he teaches. At 4:36 he says breakers do not provide their cleanest rejection points around non-farm payroll, CPI and FOMC, and at 5:06 he notes that in other circumstances he would have treated the area as a bearish breaker, would not have expected it to be traded to, and would have read it as a balanced price range — before adding that this time he wanted the breaker to be utilised. That is a stated adjustment to his own default read, not a general rule.
By 17:23 he reduces the profile to three possibilities: an initial run at buy side, then sell side, with time then becoming the factor; or the mirror sequence; or a choppy session that does neither cleanly. Later, at 26:19, he stresses that the profile has to be incorporated before deciding whether a given move is or is not a continuation pattern.
Building the map from the higher time frame down
At 7:36 he describes his own top-down habit — premium and discount first, then price action — and then, at 7:44, reduces the first task to two questions: what inefficiency and buy-side liquidity sit above the market, and what inefficiency and sell-side liquidity sit below it. He warns against looking beyond plausible reach, and at 8:03 lists the reference points he considers quick rules of thumb: previous days’ highs and lows, session highs and lows, the highs and lows of the last three days, and the previous week’s high and low.
He then demonstrates why the same area looks different on different charts. At 9:17 he returns to the daily propulsion block’s wick high and opening price and to an hourly fair value gap shaded between those two levels; at 9:48 he measures half of that high-to-opening range as the consequent encroachment. He notes at 7:25 that the hourly gap barely resembles a fair value gap until the chart is dropped to 15 minutes, and at 12:30 that a three-minute view refines the imbalance inside the order block further.
His description of the sequence follows the same map. At 10:07 price drops after an initial run, trades back below the lows, but digs into the consequent encroachment of the daily bullish propulsion block; at 10:29 it takes buy-side liquidity into an inefficiency and then reverses toward sell-side liquidity; and at 10:42 he states the conditional he attaches to that pattern — the side taken first after the news is usually, not always, the false run. At 11:00 he walks through the trap sequence that conditional implies: buy-side stops, trapped longs, sell stops taken below recent lows, induced shorts, then the run for buy-side liquidity.
Why the example is Nasdaq, not ES
One detail is easy to miss and worth recording. At 8:25 ICT says the release is at 8:30 a.m. and that he is on a five-minute chart; at 8:38 he says he was watching Nasdaq rather than “so much” the ES. He then pre-empts the obvious question at 8:51: the choice was not because Nasdaq was the better instrument and not because a tool selected it, but because students had asked him to work on Nasdaq while he had spent most of the year teaching with the ES.
The windows he names, and the two he teaches here
The direct discussion of time begins at 13:33. At 14:18 he places macros alongside windows he has taught before: the 7:00–9:00 a.m. New York open kill zone from his forex lecture material, the 8:30 a.m.–noon New York morning session used in index trading, and the 10:00–11:00 a.m. Silver Bullet he introduced that year. At 14:50 he defines macros as specific segments of price action that are usually, though not always, 20-minute intervals, and says he will teach a few of them that year rather than all of them.
He then revisits the session with those windows overlaid. At 15:17 price runs up into the inefficiency during the release, drops aggressively through sell-side liquidity below relative equal lows, returns into the hourly fair value gap, touches its upper end, rises into the inefficiency and takes buy-side liquidity once more, leaving what he calls weak relative equal lows.
At 16:29 he states the premise behind all of it — that these markets are driven by high-frequency algorithms and are not meant to be easily understood — and acknowledges that much of the material will go over the heads of viewers looking for a simple indicator-based answer.
The 9:50–10:10 a.m. macro
ICT introduces the first window at 19:41, described as a ten-minute interval into the 10 o’clock hour, 9:50 to 10:10. He immediately anticipates the objection: at 19:56 he tells first-time viewers that what he is about to show will look cherry-picked in hindsight, and points to videos on his Twitter feed where he says he executed during these times, adding that he had recently used both the 10:50–11:10 and the 9:50–10:10 windows in examples.
His description of what the window specialises in comes at 20:22: the market’s approach to the first 30 minutes of trading after the 9:30 equity open, which he says is also the last threshold that matters when forex is still trading. He notes at 20:47 that when those markets are not moving together, the crack in correlation is itself a warning sign.
In the worked example, at 21:08, price is running into inefficiency and buy-side liquidity during this window. At 21:41 he reads the same stretch as a rally into liquidity followed by a rebalance of the inefficiency, and explains how he judges the rebalance complete — price worked back and forth inside it and then left it with candle bodies staying within it. That, he says, is how he reads candlesticks as narrative.
At 22:01 he poses the question the window is meant to answer — what will price deliver next — and answers it with the profile rather than the clock: because buy-side liquidity had already been taken and relative equal lows were left behind, and because he had been bullish on both the S&P and Nasdaq, he expected a drop to take the other side of the marketplace, using the hourly fair value gap and the consequent encroachment of the daily propulsion block as the levels (22:29). At 23:14 he summarises the day as a mostly quiet New York open kill zone, the 8:30 a.m. release, an overlap with the 9:30 open, a drop into the inefficiency, a move into the hourly gap, a chop, a return into the 9:50–10:10 inefficiency and then a protraction lower into liquidity.
Two clarifications follow. At 24:37 he says the macro is nothing more than a time window, specialising in the first 20 to 30 and then 40 minutes of the hour that begins at 9:30. And at 24:53 he adds that although the first 30 minutes is conventionally the opening range, the range does not have to take 30 minutes to form — it can form in 20 — and that the liquidity taken outside that range’s high and low is what helps indicate where price goes next.
The definition he offers is deliberately mechanical. At 25:41 he calls a macro a short list of directives the algorithm runs — a small list of orders it has to complete while seeking liquidity and inefficiencies — and frames the two functions of delivery as already met once price has traded into premium relative to the range and rebalanced an inefficiency.
The 10:50–11:10 a.m. macro
The second window appears at 27:57. Its rationale is structural rather than chart-based: at 28:07 he notes that it closes out the 10 o’clock to 11 o’clock hour, the first 90 minutes of trading, and at 28:16 that it precedes the New York lunch period, which he says has its own macro and usually runs for liquidity.
In the example, at 28:26, he reads a low, high, lower low sequence with two up-close candles as a bullish breaker that can be used to anticipate higher prices. At 29:06 he gives the two reasons he attaches to 10:50 specifically: it is ten minutes before 11 o’clock, and it is essentially the height of the London close for forex. At 29:19 he addresses the standard objection that electronic markets no longer have an open outcry lunch, and answers that it does not matter — he expects some measure of consolidation into the lunch period, and says the lunch hour will either run for liquidity or reverse, functions that have to be fitted to that particular day’s profile.
Timing is not direction
The most important limitation in the lesson is stated plainly. At 30:12 ICT says these windows are only the time aspect of when he anticipates the market will start showing animation, and that knowing the times of day is not enough on its own; inside them he expects price to start running for liquidity or inefficiency, and he tests that expectation.
That test has a defined failure response. At 30:51 he says that if a macro delivers no such movement — if price does not head toward the inefficiency or liquidity his analysis pointed at — then that is often his cue to stop looking and close the charts and trade the next session, because the absence of expected movement is itself information. He adds at 31:33 that macros also exist in the afternoon, in the lunch hour and in the London session, and that he presents these two because he had recently used them.
The analogy he uses for the mechanism is a fishing cast. At 31:50 he describes a macro as the beginning of a spooling event, where line runs off a reel to deliver the hook, weight and bait far from where the angler stands; at 32:27 he says that is what macros do — cast price away higher or lower. Note that this is his metaphor for market behaviour, not a mechanism the transcript can evidence.
He then guards the concept directly. At 32:35 he states that a macro “is not going to give you a direction,” and at 32:50 he dismisses the claim that a macro determines bias, listing what is still required: tape reading, a determined bias, knowing where liquidity is and how to work within higher-time-frame analysis.
His broader claim is stronger than the mechanics and should be read as his own position. At 33:26 he offers the lesson as proof that markets are algorithmic and operate on the basis of time first, argues at 33:38 that only an unexpected geopolitical shock would break that order, and at 34:03 says every asset class is driven by artificial intelligence following coded instructions and running on time. Nothing in the caption track establishes those propositions; they are the speaker’s interpretation of his own results.
What the recording shows at the end, and what it does not
From 34:21 the recording turns to where he executed, and he displays order executions on the chart over the course of the day before closing at 35:15 with a restatement of the concept: a macro is simply a time of day when price will begin to spool, reaching for liquidity or inefficiency.
That final stretch cannot be verified from the source used here. The caption track is largely music and short remarks over chart markup, so no entry price, size, fill or net result can be established from it, and none is reported above. The same caution applies to the level readings throughout: they are the speaker’s account of what his charts showed, presented here as his interpretation rather than as independently confirmed data.
What carries over beyond the terminology
Strip the vocabulary away and the session models a handful of practices that stand on their own:
- Write the level down numerically before describing what price should do at it; ICT says at 18:26 that he keeps levels in text notes rather than on his chart, and empties his chart of annotations unless he is recording.
- Separate a directional thesis from a timing window. The window tells you when to watch; the thesis comes from the higher-time-frame map and has to be stated separately.
- Treat an event that distorts your default read as information, not as a reason to force the pattern — as he does with breakers around non-farm payroll, CPI and FOMC.
- Define in advance what the absence of expected movement would mean, and accept it as a signal to stand down rather than to re-label the setup.
- Distinguish a stated conditional (“usually, not always”) from a rule; his own wording on the false run and on the opening range is deliberately conditional.
His stronger assertions — that the market is algorithmic, that time precedes price and that a macro proves it — are opinions about his own method. The caption transcript can neither substantiate nor refute them.
This is independent educational commentary on a published recording. It is not investment advice, not official ICT material, and not a tested system; futures involve substantial risk and no analytical framework guarantees a result.
Watch the original recording
This article draws on the timestamped English captions of ICT Mentorship 2023 – Algorithmic Price Delivery & Time Macros Intro, published 9 July 2023. The captions are auto-generated and misrecognise several terms of art — “consequent encouragement” for consequent encroachment, “not from payroll” for non-farm payroll, “FMC” for FOMC, “launch” for lunch — which have been normalised above only where the surrounding context makes them unambiguous. Where a caption is garbled beyond that, its content is omitted rather than guessed at. The chart markup is the substance of the lesson, so the recording is worth watching directly.
Watch the original lesson on YouTube
The video cannot be played inside another website. When its embedded player was opened and clicked on 15 September 2026, the player itself reported “Video unavailable” and “Playback on other websites has been disabled by the video owner.”, with no duration and no playback progress reported. The recording’s own watch-page data also reports embedding as unavailable, which is why no embed is reserved or left blank here. The lesson itself is available directly on YouTube.
Watch ICT Mentorship 2023 – Algorithmic Price Delivery & Time Macros Intro on YouTube ↗
Primary source and further reading
- The primary source: the original 9 July 2023 lesson — use the timestamp links above to compare each explanation with what he actually said.
- The Inner Circle Trader YouTube channel — the publisher’s own channel, where this lesson and the mentorship months it references are posted. Unofficial reuploads and summaries are not the source used here.
- YouTube’s “Embed videos & playlists” help page — platform documentation relevant to the disabled-embedding notice above.
- CFTC Learn & Protect — the US regulator’s investor-education and fraud-warning material. A general reference; it is not a statement that this recording or this article complies with, or violates, any particular rule.
This is independent educational commentary. It is not official ICT material, a tested trading system, or a claim that any reported result can be reproduced.