
Key takeaways
In ICT Mentorship 2023 Market Review – July 09, 2023, ICT reviews the Dollar Index, EUR/USD and the E-mini S&P 500 and spends the second half of the recording on a study method rather than a forecast.
Read the full summary
In ICT Mentorship 2023 Market Review – July 09, 2023, ICT reviews the Dollar Index, EUR/USD and the E-mini S&P 500 and spends the second half of the recording on a study method rather than a forecast. On the Dollar Index he reads a trading range with sell-side liquidity resting below, says he favours a run below the low and calls what happens after that the important part — acceleration points lower, a rejection keeps price in the range (1:20 and 1:38). EUR/USD is treated as the inverse, with a weekly inversion fair value gap as prospective support and higher prices preferred only while that structure holds (8:10 and 10:02). On the E-mini S&P he names 4,400 on a closing basis as the line he did not want to see lost and 4,300 as the area his attention would move to if it were (16:56 and 17:32). The main teaching is how he marks a session gap — the separation between the previous settlement and the next 9:30 a.m. New York open — keeps its low, midpoint and high as three sensitive levels, optionally adds 25% and 75%, then switches to electronic-hours data and studies how price delivered inside that range (21:01 and 20:43 and 25:50). He states throughout that the levels are his readings of charts he was annotating, and the recording contains no results.
How we researched this article
BestProps used document-based research from primary firm sources, checked September 24, 2026. The complete source list, scope, limitations, and commercial-state record appear near the end of this article.
The session is a weekend review of a holiday-shortened week. It ends with him saying he is adopting a wait-and-see posture into Sunday’s open and the Monday 9:30 opening (18:27), and the recording contains no information about what price did afterwards — so nothing here should be read as a forecast that was tested.
ICT 2023 Dollar Index Market Scenario
He opens on the weekly Dollar Index chart (0:31). His description: price has worked up into the mean threshold and upper close of a bearish order block several weeks earlier, a fair value gap sits below, and an area of sell-side liquidity rests beneath a short-term low, with more liquidity further down (0:38 and 0:49 and 0:53 and 1:53). His characterization is a trading range in which price twice failed to get above the imbalance (0:56 and 1:40).
The conditional structure he sets out is worth separating from the direction. He says he favours a run below the low, and that the reaction there is what he will be reading — if price accelerates through it, the larger liquidity pool below becomes the longer-term draw; if it trades below and then rejects, price may simply stay inside the range for longer (1:20 and 1:28 and 1:29). On the daily chart he notes the weekly mean threshold does not look clean when transposed, which is the point he uses to justify the method: higher-time-frame price-delivery arrays have to be carried down onto the lower charts rather than re-derived from them (1:38 and 1:43 and 1:56). He also flags a possible bearish breaker — a high, low, higher high — that he says could pull price back up into the block before another decline, and says he is watching the Sunday open and Monday trade for that reason (2:19 and 2:32 and 2:39).
He restates the preference plainly at 2:49: gone to his head, he favours a run below that low, and if it accelerates, the liquidity resting there is the likely longer-term draw. That phrasing — “gun to my head” in the captions — is his way of marking a low-conviction lean rather than a prediction, and the same construction recurs later in the review.
ICT Holiday Timing and the Week’s Power of Three
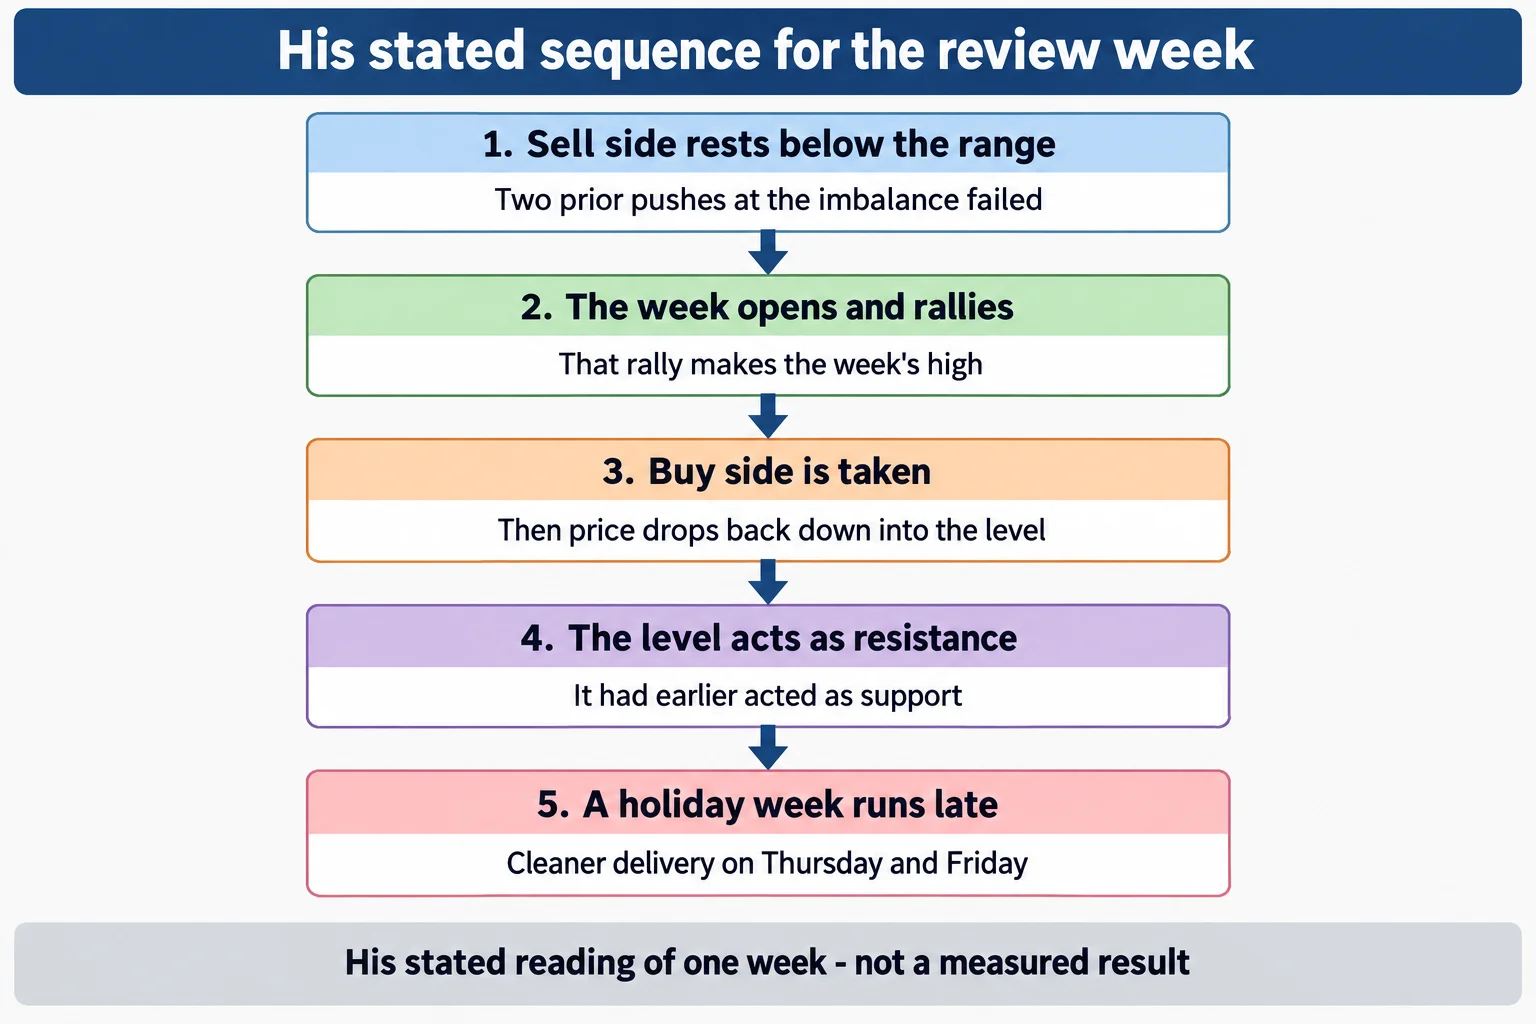
From 3:07 he walks the hourly Dollar Index and frames the reviewed week with what he calls weekly power of three: an open, a rally that makes the week’s high, and then a decline in the latter part of the week (3:07 and 3:25 and 7:05). He attributes the timing to the 4 July holiday and the lighter volume around it, and says he had already expected cleaner price action towards the end of the week (3:14 and 3:22 and 3:29 and 4:05). He marks the Thursday New York midnight open and says he prefers to have a position before Wednesday in a nonfarm-payroll week (3:50 and 4:15).
What he then describes is a level changing role. Price returns to the Monday New York midnight opening price and works around it repeatedly, then runs higher and takes the buy side above a high, before dropping back with candle bodies holding near the high of the weekly fair value gap (4:39 and 4:48 and 4:54 and 5:00). He says that once the new candle opened and started trading lower, that whole advance could be read as a run on liquidity, and that he would watch whether a subsequent rally is held at the consequent encroachment of that candle — a level he refers to as the high of the weekly volume imbalance, rendered in the captions as a number near 103.42 (5:08 and 5:17 and 5:33). The caption digits there are unreliable and the level is reported as spoken, not as a verified chart value.
He also explains what he calls an immediate rebalance, and it is one of the more concrete distinctions in the recording. Price hit the lower end of the weekly fair value gap as resistance, broke sharply below, and then the very next candle rallied back up to the previous candle’s low — leaving no fair value gap between them. In his words, that immediate rebalance is very powerful, and it indicates sudden, urgent delivery toward a specific level of liquidity or inefficiency rather than ordinary drift (5:45 and 5:58 and 6:15 and 6:32 and 6:44). He ties this to the payroll Friday drop: the displacement below the low happened on one candle and the next opened and rallied back to its low, with the liquidity taken during that session (6:44 and 6:54).
On the 15-minute chart he extends the Monday New York midnight opening price through the whole week, identifies a fair value gap that price traded into during the New York open and the 8:30 payroll report, and points to consecutive up-close candles forming a bearish order block whose close marks the level price subsequently rallied back to exactly (7:21 and 7:28 and 7:36 and 7:43 and 7:51). He calls this the change in the state of delivery, and says the algorithm will refer back to that price (7:56 and 7:58). He then says everything he would expect from the Dollar Index would be reversed on EUR/USD (8:10).
ICT 2023 EUR/USD Market Outlook
The EUR/USD section (8:17) begins with the weekly volume imbalance he says he has been flagging for months. Price retraced into a bullish order block, rallied, created a fair value gap, and traded down into it multiple times; his stated condition is that this area should act as an inversion fair value gap — trade above it, find support in it, and then reach for buy-side liquidity and eventually the weekly volume imbalance (8:20 and 8:31 and 8:42). He names the draw as the area around 111.11 to 111.50, adds that how far into the weekly volume imbalance price gets remains to be seen, and calls it the longer-term draw (8:48 and 8:54 and 8:58).
On the daily chart he points to relative equal highs as buy-side liquidity, the weekly volume imbalance above, and the same weekly fair value gap now treated as an inversion fair value gap whose logic is support rather than resistance. He is explicit that price does not need to come back down and touch it again — that is something he would like to see, and if it happened it would prompt him to consider tape-reading or demo-trading it (9:01 and 9:10 and 9:23 and 9:27). He adds a level he does not want to see lost — the high of the candle that forms the low of the buy-side imbalance, and the consequent encroachment below it — and says that as long as price stays above all of it he is bullish on EUR/USD (9:41 and 9:51 and 10:03).
He also introduces an order-block method point here. On the hourly EUR/USD chart he describes what he annotates as a repulsion block, then says the area he is actually marking is a two-hour order block — the full high-to-low range of two hours of time, represented on the hourly chart (10:41 and 10:45 and 10:55). He says his order-block work involves toggling through timeframes that are not standard — including intervals below 15 minutes and as small as a 30-second, 15-second or 5-second chart — and that it all rests on a top-down read (11:06 and 11:26 and 11:41 and 11:51). The qualification he attaches is the important part: an order block should not be identified by a single up or down candle, because its position in the price-delivery continuum and the surrounding context have to be understood first (12:07 and 12:13 and 12:18). He says he will teach order-block theory in book format rather than in videos (12:25 and 12:30).
On the 15-minute chart he shows a breaker — swing low, swing high, then a lower swing low — and notes that inside that high-low-low range sit an order block, a breaker and a buy-side imbalance outside of efficiency. In his framing any one of those could serve as the reference, and he presents them as alternatives for the viewer to choose between rather than as a single mandatory signal (12:41 and 12:51 and 13:02 and 13:09 and 13:15). He describes price opening, trading down into the breaker, rallying through the weekly inversion fair value gap, and says he would have enjoyed seeing price come back down to touch that gap once more — the same behaviour the earlier example showed (13:21 and 13:30 and 13:36).
The New York open section adds timing to the location. He describes the 15-minute drop during the New York open kill zone — which he puts at 7 a.m. to 9 a.m. New York local time — into the daily bullish order block and the consequent encroachment of a buy-side imbalance, with the 8:30 news embargo lifting at that point. On his reading that drop hit two arrays at once and offered a confluence of an order block, a consequent encroachment and a daily order block inside the kill zone (14:09 and 14:22 and 14:35 and 14:56). He then says to think of the midpoint of the shaded area: as long as price is above it, he is looking for higher prices and specifically for buy-side liquidity or the weekly volume imbalance (15:19 and 15:24).
ICT 2023 E-mini S&P 500 Market Opening
The E-mini S&P section starts at 15:33. On the weekly chart he notes a weekly volume imbalance price has not yet reached and says price traded about halfway into the previous down-close candle, which he likes but frames as a reason to watch rather than a top call (15:33 and 15:41 and 15:47). He expects a retracement into the range followed by expansion up into the weekly volume imbalance over roughly the next two weeks, and states plainly that the expectation is based on what was on the chart before Friday’s close and could change on the Sunday open or with Monday’s trade (15:59 and 16:04 and 16:11 and 16:18).
On the daily chart the levels are explicit. He points to a fair value gap price worked off, a volume imbalance below, and a last down-close candle, and says he would not want to see anything below 4,400 on a closing basis; until that is taken out he does not want to try to pick a top (16:39 and 16:56 and 17:01 and 17:07). He then defines the two-sided map: as long as the order block stays intact the read holds, and if it is lost his attention goes to the sell-side imbalance outside of efficiency around 4,300 (17:20 and 17:32 and 17:33). He says he does not see that yet, favours a little lower inside the volume imbalance, and notes the chart looks heavy — while repeating that it could equally come back up and make a higher high into the weekly volume imbalance before giving up entirely (17:41 and 17:56 and 18:17).
On the hourly chart he switches deliberately to electronic trading hours and says he will move between the two data sets, because that is how he gets a better picture of what price is trying to do (18:47 and 18:52). He works the buy-side and sell-side imbalance classifications and a fair value gap, describing a fill of upside delivery into a small area and then continuation toward another discount array or sell-side liquidity (19:05 and 19:22 and 19:31 and 19:37). He notes price had not taken out a low and says he would like to see a gap lower, a trade up into the low of the inefficiency, and then a rip into the sell-side liquidity — and if it accelerates lower, he points to a more refined area below the relative equal lows where sell side is residing (19:48 and 20:03 and 20:11 and 20:18).
ICT Mentorship Lesson on Reading Session Gaps
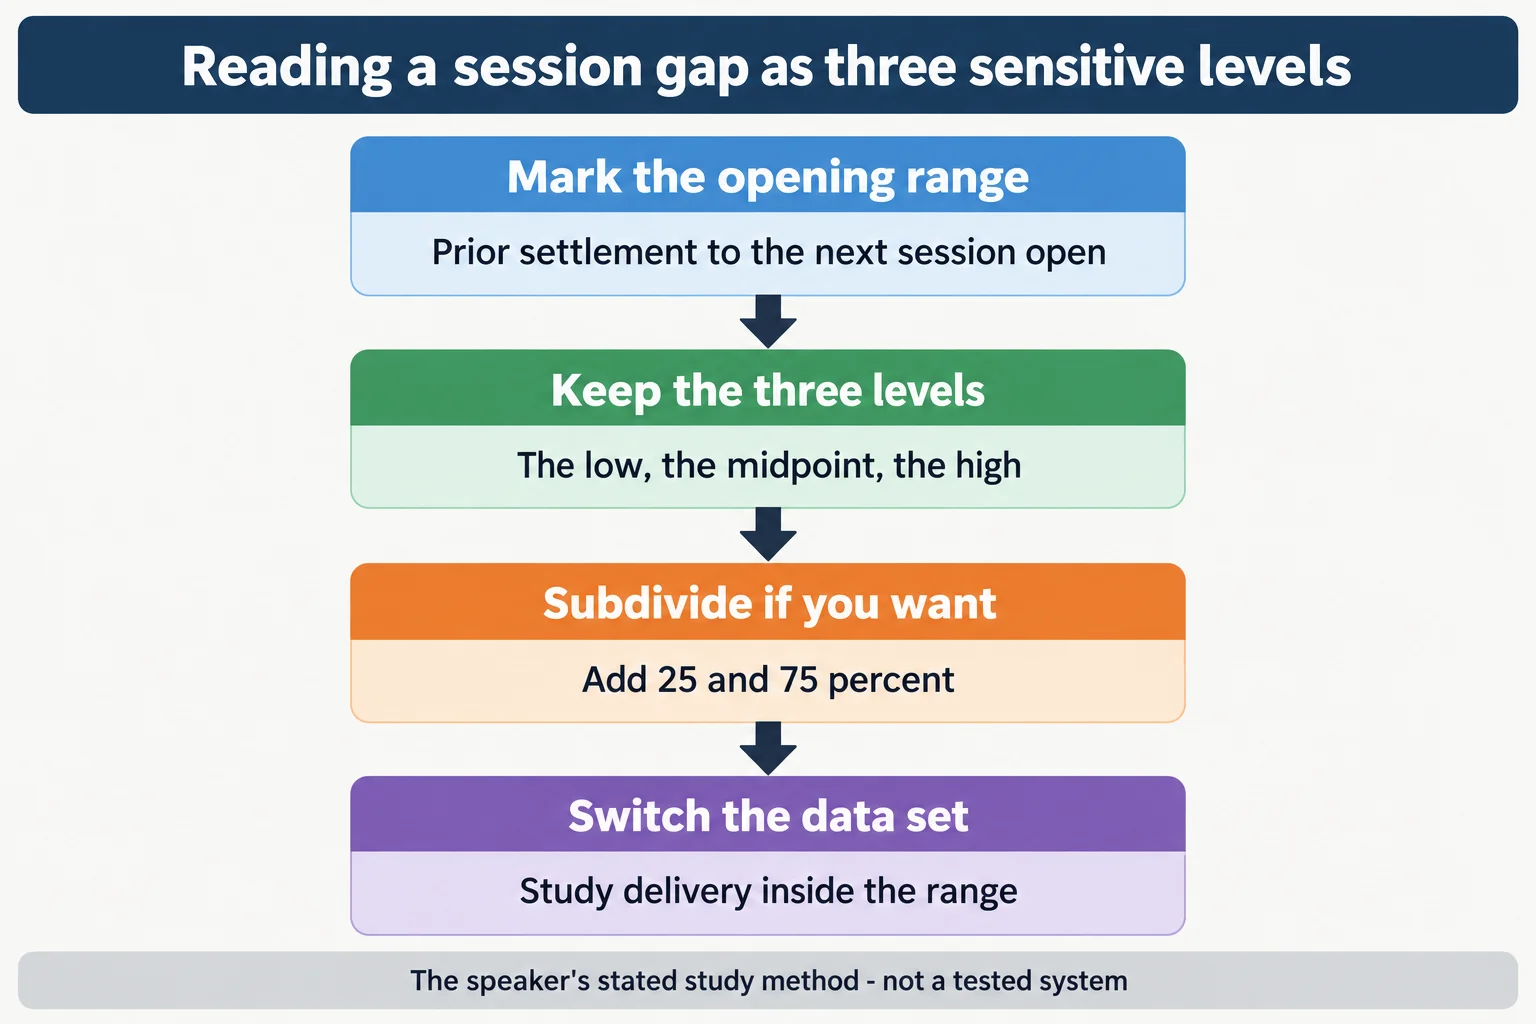
The teaching section begins at 20:43. He switches the S&P hourly chart from electronic trading hours to regular trading hours, and says regular trading hours is where the gaps appear. He defines the opening range as the distance between the previous day’s settlement price and where price opens at 9:30 a.m. New York local time — the settlement price of the previous day to the 9:30 open, whatever separates them (20:43 and 20:52 and 21:01 and 21:05). His key statement is that this opening range gap acts and performs in the same manner he would expect from a weekly volume imbalance (21:16 and 21:18).
He then explains the idea with what he calls a paint-roller analogy: treat the white background as a wall you are repainting, and the areas of missing paint as the parts of price where candle bodies never delivered. Concretely, a gap is the separation between one candle’s opening price and another’s where no body exists, and he extends those areas forward in time because they will eventually be offered to both buy side and sell side — upside and downside delivery (21:29 and 21:38 and 21:41 and 22:02 and 22:18). The qualifier he adds is that partial delivery matters. Where price has already covered part of a gap, what remains is the portion that has not been offered, and he marks that residual separation between the high and the next candle’s opening price as the real inefficiency (22:30 and 22:35 and 22:57 and 23:09).
He is also precise about why a gap does not stop mattering once price has crossed it. His claim is that the algorithm refers back to three price points inside each inefficiency — the low, the midpoint he calls consequent encroachment, and the high — and that those three specific levels are very sensitive. If a viewer wants to go further, he suggests splitting the same range into quadrants at 25%, 50% and 75% (23:51 and 24:03 and 24:07 and 24:20 and 24:26). He notes that the same electronic-hours data contains no gap at those points because price traded straight through them, and that this divergence between the two data sets is exactly what the exercise is meant to reveal (25:08 and 25:11). He also says not to display every inefficiency at once, because doing so defeats the tracking purpose (25:24 and 25:27).
He frames the whole thing as homework rather than a rule, and sets three assignments: take the marked ranges down to timeframes below the hourly chart and study how price delivered inside each one, checking London and New York session behaviour, both the morning and afternoon windows (25:36 and 25:50 and 26:58 and 26:52). He says the purpose is for the viewer to discover the behaviour themselves rather than be handed it (25:28 and 25:33). He also states the claim behind the exercise: that these levels offer precision not just at the high and the low but at the consequent encroachment and at 75%, 50% and 25% of the respective ranges, and that this is not something he believes appears in existing books — a distinction he attributes to how he reads gaps relative to retail practice (24:08 and 24:11 and 24:22 and 24:31). That is his claim about the method, and nothing in the recording tests it.
ICT 2023 Intraday Market Takeaways
The last third maps session liquidity around payroll Friday. On the 15-minute chart he refers back to a tutorial he published on classifying liquidity pools, then labels a sell-side pool from Thursday’s New York PM session and buy-side and sell-side pools from London sessions, and walks the payroll Friday sequence: a rally that takes the Thursday New York PM buy-side liquidity, a rip lower that takes the London session sell side, a rally back up, a return to a bullish order block, another push higher into the Thursday London buy-side pool, and then an afternoon reversal all the way back down to the rejection block and the original sell-side pool (27:16 and 27:29 and 27:40 and 27:49 and 27:57 and 28:04 and 28:13 and 28:16). He notes it was interesting that price did not take out that low, concludes there is unfinished business into Sunday’s opening, and repeats that he would like to see a gap lower and how price trades below the low if at all (28:21 and 28:26 and 28:28).
He flags a small gap he says could act as a speed bump on the way down — price could run into it, bounce back up into the range, and take the low out at a later time — and repeats that it is a matter of wait and see on Sunday’s opening price and Monday’s trade (28:33 and 28:44 and 29:03). The five-minute chart repeats the same liquidity pools and he labels one sequence a classic optimal trade entry that starts an accumulation and rally into the Thursday London buy-side liquidity before the reversal (29:10 and 29:16 and 29:21 and 29:31).
He then names a pattern on the regular-hours five-minute chart as what he calls a classic ICT market-maker sell model: accumulation, reaccumulation, a reversal low-risk sell, distribution, redistribution as a second distribution stage, and then an aggressive sell-off into sell-side liquidity (29:40 and 30:46 and 30:58 and 31:05 and 31:11). He identifies a breaker inside the same area — a high, low, higher high — and gives a specific rule about gap closure: when a breaker sits inside a range being considered for a gap closure, the down-close candle’s low is the point to weigh, and he says that level was respected (31:08 and 31:25 and 31:46 and 31:51 and 32:04 and 32:10).
On the one-minute charts he compares the S&P and Nasdaq and says a higher low on one against a lower low on the other is why he elected to trade the Nasdaq, after students asked him whether he could work that market (32:19 and 32:25 and 32:31). He says he went long and then short in it, that he did not capture the final afternoon leg lower because he did not have time to manage it to the close, and that he recorded live executions on his channel covering Friday’s afternoon Nasdaq session (32:33 and 32:43 and 33:13). He describes the SMT divergence there — the S&P rallying and Nasdaq following after a lower low against a higher low — and says a short-term low helped him time a potential intermediate-term high (33:20 and 33:23 and 33:28 and 33:35).
One anecdote in that section is worth reporting plainly, because it is the closest the recording comes to discussing a loss. He says he deliberately tried to place a trade with an extremely tight stop so that he would be stopped out