
Key takeaways
The Inner Circle Trader’s ICT Mentorship 2023 ES Review Precision Results is a roughly 24-minute YouTube self-review claiming the June E-mini S&P delivered through buy-side liquidity into an old weekly imbalance, but it shows no account figures, independently verified fills, position size, trade count, win rate, risk, or net profit and loss, with executions instead…
Read the full summary
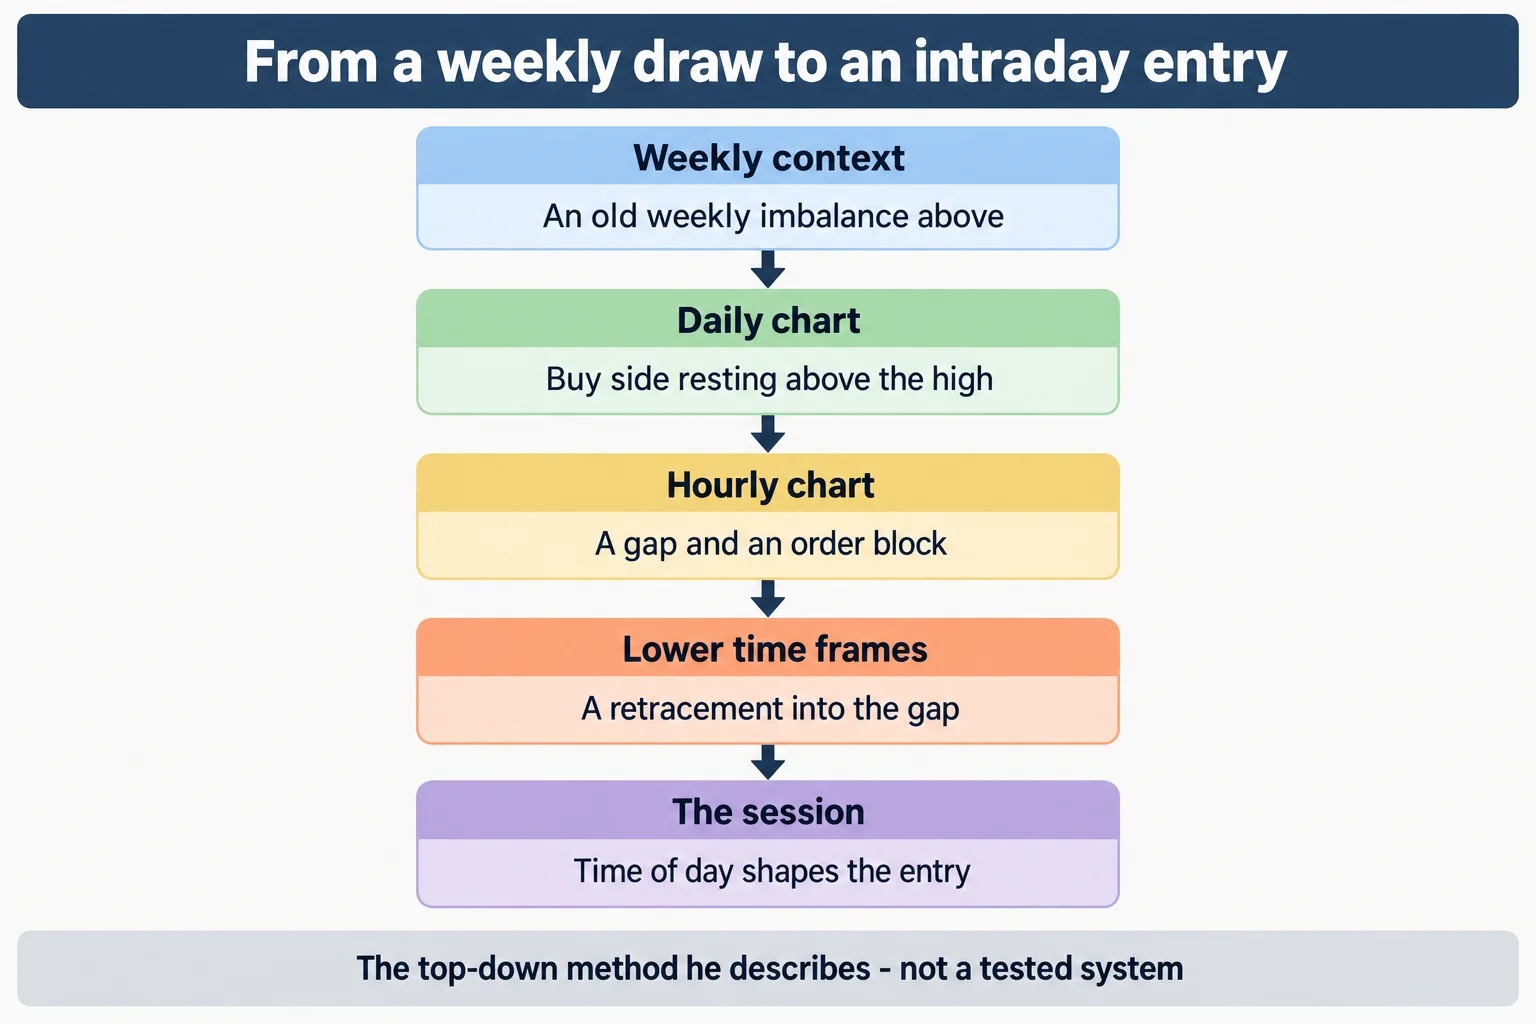
The Inner Circle Trader’s ICT Mentorship 2023 ES Review Precision Results is a roughly 24-minute YouTube self-review claiming the June E-mini S&P delivered through buy-side liquidity into an old weekly imbalance, but it shows no account figures, independently verified fills, position size, trade count, win rate, risk, or net profit and loss, with executions instead attributed to Twitter. The method starts with a weekly liquidity target, moves through daily, hourly, 15-minute, 5-minute, and 1-minute charts, and uses New York session timing for entries. ICT favors the individual June contract over TradingView’s continuous series because he says it preserves inefficiencies lost when continuous data is compressed into weekly candles. His complete model combines a structured breaker, fair value gap, optimal trade entry or consequent encroachment, and institutional order flow entry drill. He describes two 1-minute longs after relative equal lows were cleared, taking partials and moving each stop above break-even before both were stopped, while trading by phone from a car. New York lunch runs noon to one p.m., the PM session runs two to four p.m., the Silver Bullet provides two claimed chances during a rally, and the market-on-close macro runs three fifteen to three forty-five p.m., with the final 15 minutes potentially producing only 5, 8, or 10 handles after the higher-time-frame target is met. He states an exit level of 42,14.75 from an opening-range-gap projection at negative 11 standard deviations, with price reaching the 42,15s, but the article concludes that precision results is ICT’s own framing rather than verified performance.
How we researched this article
BestProps used document-based research from primary firm sources, checked September 24, 2026. The complete source list, scope, limitations, and commercial-state record appear near the end of this article.
Two things date and shape the recording. He says he is reviewing a session he traded while travelling, watching everything on a phone from a car rather than at his desk (19:11 and 19:17), and he repeatedly points viewers at the previous evening’s recording and at executions he says he posted on Twitter rather than showing them here (0:34 and 18:49).
ICT Mentorship 2023 Call and Expected Result
He puts the previous evening’s chart back on screen and says the only change is that he removed some gradients and arrows (2:27 and 2:28). The stated expectation was to draw above the buy side and into the old weekly imbalance (0:43). His check on the weekly candle is that it expanded in the direction he expected, that buy side above the high was taken, and that price traded inside the weekly volume imbalance (0:56, 1:00 and 1:02).
What he says he is not doing is also worth recording, because it is the part of the recording most obviously aimed at how someone studies. At 2:56 he says he is not trying to pull every concept he has ever created into one model, but is looking for one simple question (where is price going to draw to next) and at 3:49 that the work for a beginner should be journalling and going back through old data for repeating patterns rather than hunting entry patterns. He makes the hindsight point explicit at 4:13, saying he cannot manipulate a daily or weekly candle that was shown before the fact, and returns to it at 4:34. That is his argument about his own prior publications; it is not independent verification of the outcome.
Why ICT Mentorship 2023 Uses the June Contract
He answers a question he says people were raising on Twitter (1:04 and 1:08): his reason for not using a continuous TradingView contract is that the individual delivery month preserves inefficiencies that a continuous series will not show once it is compressed into weekly candles (1:11, 1:16 and 1:55). He notes the contract he is showing is the June contract, and that it was trading before it became the front month (1:40 and 1:45).
He extends that into an argument about time-based charts generally. He says people who claim time-based charts are useless are wrong, and that time is the root of where price goes because in his terms the algorithm runs on time first (2:04, 2:13 and 2:16). The practical point underneath it is uncontroversial even where the theory is not: an individual contract and a continuous series are built differently, so which symbol and month a chart used should be recorded. The claim that price delivery is algorithmically time-first is his assertion and is not established by this recording.
ICT Mentorship 2023 Fair Value Gap Entry Model
He works the same area twice, once on the higher time frame and once on lower ones. On the first pass he says price would draw up into the fair value gap and then into the buy side and the shaded weekly volume imbalance, and that while price had been consolidating he expected a drop into the imbalance before going higher (4:59, 5:02 and 5:21). He names the run that initialises the move the institutional order flow entry drill, and defines it at 5:48 as a partial entry into a fair value gap (whether that gap is a buy-side or sell-side imbalance). He then classifies the gap on the chart as a buy-side imbalance which he calls inefficient because it only offered buy side into a single candle (6:24 and 6:40).
He then points to the same delivery in detail: a drop into that candle’s low, a rally that creates another buy-side imbalance from one candle’s high to the next candle’s low, the breaker in the same region, and a daily fair value gap whose midpoint he calls consequent encroachment (the same thing, he says, as the optimal trade entry he has taught for years) (6:38, 6:49, 6:51 and 7:19). He adds that once price trades above that candle’s high the range becomes what he calls a balanced price range, which for him justifies expecting the buy side above and the weekly imbalance beyond (7:26, 7:33 and 7:38).
The term he uses for the combination is a “complete model” (12:21 and 12:24). What he is describing there is a structured breaker (which he defines as a low with a high to its left and a higher high to its right, so that once the low is broken the level is in play), plus a fair value gap, plus an optimal trade entry, plus what the captions render as a “very shorter block”, which is a caption error and is not reconstructed here (12:25, 12:30, 12:32 and 12:52).
ICT Mentorship 2023 Morning Trading Session
On the 15-minute chart he walks through the morning. He calls the early move a Judas swing and defines it in the recording as a fake move, then says it created a three-drives pattern and that he took two trades there which he says he shared on Twitter (7:51, 7:57, 8:01 and 8:06). He notes the three-drives pattern again at 8:34, and describes the drill running after sell side was taken, then a short-term reversal pattern he calls classic price action that suggests some measure of retracement (8:39 and 8:41). His stated reason for expecting more upside despite that pattern is unfinished business at the weekly imbalance (8:56).
He also explains the pair he was trading. At 9:01 he notes how strongly the Nasdaq has run, at 9:13 calls the approach a “sick sister” concept of trading the lagging pair in sympathy, and at 9:16 says he traded the Nasdaq that day as well and points viewers to Twitter for those executions. None of that is shown or verified in the recording.
His account of the one-minute executions is the clearest description of management he gives. At 11:10 he describes the same imbalance refined on a one-minute chart, dropping into the fair value gap and clearing relative equal lows. He then says he went long into a fair value gap, took partials, rolled the stop to better than break-even and was stopped, went long again above the highs, took partials, rolled the stop again and was stopped a second time (11:28, 11:31, 11:35 and 11:41). He says the reason he was positioning himself that way was that he would be away from the charts in the afternoon, driving with his wife and using only his phone, and he states plainly that this is not something viewers should do (11:51, 11:55 and 12:06). That is a self-imposed handicap he acknowledges, and it is the reason two entries were stopped rather than held.
ICT Mentorship 2023 Lunch and Afternoon Windows
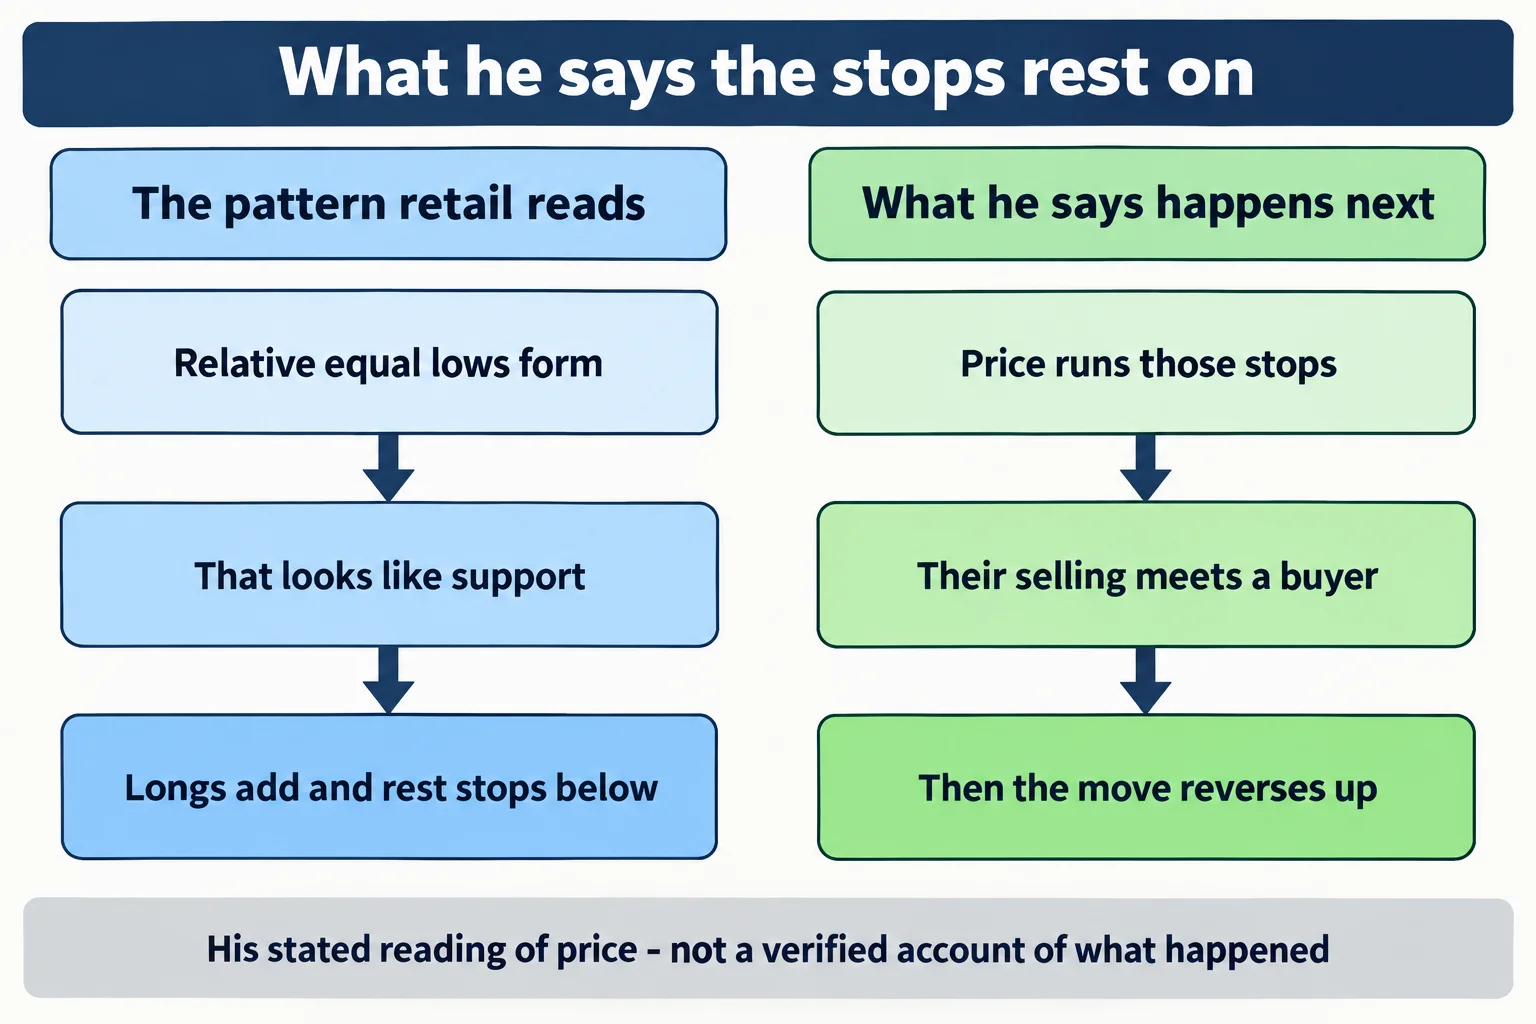
He builds the midday narrative deliberately. After the run down to the old imbalance a consolidation forms, which he notes is not surprising because it is New York lunch; relative equal lows then form, and he says that entices traders to read support, so long holders chase it up into the breaker at the mean threshold of a large down-close candle before price shifts lower and runs the sell side (13:07, 13:13, 13:20, 13:25 and 13:36). He calls it a stop hunt and the macro for the lunch hour, gives the window as the hour between noon and 1 p.m. New York local time, and answers the people who say nobody trades lunch by saying the algorithm reprices to those stops and is using time (13:43, 13:46, 13:56 and 14:04).
The two afternoon windows he names are the ones he uses elsewhere in the series. The PM session runs 2 p.m. to 4 p.m. New York local time, and within it he calls the Silver Bullet the point at which you get “two chances” as price rallies, followed by the market-on-close macro at 3:15 to 3:45, described as another opportunity to run liquidity that has not yet been engaged for that day (14:54, 14:57, 15:02, 15:07 and 15:15). Later he restates the macro window and adds the caveat that once the higher-time-frame liquidity target has been met, price usually will not spool up again, so the last fifteen minutes between 3:45 and 4 p.m. may only produce a small move of a few handles, which he puts at five, eight or maybe ten (19:16, 19:28 and 19:34).
The day’s structure is also described in his own terms at 16:40, where he calls the daily candle a “power three”: a small move lower after the 9:30 open, a rally to the high of the day and a close near it. He links that to the opening range gap, which he defines at 17:14 as the difference between the previous day’s close and the 9:30 open, and says the 9:30 open was essentially near the low of that shaded gap (16:44 and 17:23).
ICT Mentorship 2023 Exit Price and Result Limits
He names one specific level for his own exit. At 18:22 he describes projecting the opening range gap the way he says he taught with the Central Bank dealer’s range and the Asian range, producing an overlap at negative 11 standard deviations, with price coming in at 42,14.75. He says that level is why he took his exit at that low, that price went just above it into the 42,15s, and that this was the high of the day (18:28, 18:32 and 18:45).
That is as far as the evidence in this recording goes. He says the executions are on Twitter rather than in the video (18:49), and the recording contains no account figure, no trade count, no win rate, no risk per trade and no profit or loss statement. The exit level is stated and the reasoning for it is stated; whether the trade happened, at what size and at what net result is not something captions can establish, so nothing here should be read as verified performance. The phrase in the title is his own label for his own review.
ICT Mentorship 2023 Stop Placement Explained
The last third of the recording is the part he presents as theory rather than review. He says none of it is random or conjecture, but a logic for why price moves and when, and that the approach starts with a draw on liquidity (simply where price is going next), adding that without that skill he does not think anyone is profitable regardless of method (20:04, 20:17, 20:28 and 20:41). He then asks who benefits if price goes higher, and answers with the mechanism he wants understood: relative equal lows look like support to retail, longs place orders above that pseudo-support and stops beneath it, price is taken down to engage those sell stops, the resulting rush of selling is bought by what he calls smart money as the counterparty, and the move then runs back up into the buy stops and beyond (20:50, 21:01, 21:09, 21:15 and 21:49).
He extends that into a distribution story: the people who were momentarily lucky do not take partials, their stops rest above as buy stops, and smart money sells part of its long position into that breakout demand to distribute (21:55, 22:05 and 22:12). His stated rule from it is that he teaches students to sell long positions partially above old highs and to cover shorts below old lows, and he adds that the market does not follow retail patterns, moving averages or breakout strategies (22:52, 22:55 and 23:04). These are claims about who is on the other side of retail orders. The recording offers his reasoning for them and no data on positioning, so they are reported here as his framework rather than as established fact.
ICT Mentorship 2023 Transcript Notes
The source for this article is the video’s own automatic captions, which are machine-generated and not human-checked. They misrender a number of ICT terms and phrases: “Judah swing” for Judas swing, “by seven balance” and “volume of ounce” for volume imbalance, “cell side” for sell-side, “by side” for buy side, “consequent encouragement” for consequent encroachment, “sick sister” for what is usually called the sick sister or pair-sympathy concept, “Oracle entry drill” for order flow entry drill, “market on closed Mac or” for market-on-close macro, and “very shorter block” at 12:52 which is too garbled to normalise and is not guessed at. The reviewer did not see the video, so every chart level, candle reading and structural claim here is reported as the speaker’s own description of charts he was annotating.
Watch the ICT Mentorship 2023 Recording
ICT Mentorship 2023 – ES Review Precision Results
The Inner Circle Trader · published 18 May 2023 at 6:51 p.m. Pacific · about 24 minutes. This is the primary source for this article; every timestamp link above points into it.
The video is not embedded here because the owner has disabled playback on other websites. That was checked directly on 15 September 2026: the player loads and returns “Playback on other websites has been disabled by the video owner” instead of playing, on both desktop and mobile viewport sizes.
The watch page was read on 15 September 2026: playability status OK, not unlisted and not private, 1,418 seconds long, published 18 May 2023 at 6:51 p.m. Pacific. The queue for this post carries the video under a UTC date of 19 May 2023, one calendar day later than the Pacific publication date; the watch page and title both point to 18 May. He describes the session being reviewed as Thursday and refers to the previous evening’s recording throughout, which is how the recording dates itself (0:24). The channel is The Inner Circle Trader on YouTube, and it is the first-party record of what it uploads; it takes precedence over any reupload or third-party archive.
ICT Mentorship 2023 Resources
These are the sources checked for this article. The regulator and investor-education pages below are general material about leveraged retail trading and about the futures contracts involved; they are not assessments of ICT or of anything said in the recording, and none of them verifies a statement made here. Any ICT, smart-money or third-party indicator, script, note set or transcript circulating outside the publishing channel’s own upload page is unofficial and untested here.
- [1] ICT Mentorship 2023 – ES Review Precision Results (The Inner Circle Trader; primary source; watch page read 15 September 2026, 23M38S)
- [2] The Inner Circle Trader (official YouTube channel; read 15 September 2026)
- [3] CFTC (Fraud Advisory: Commodity Trading Systems Sold on the Internet; read 15 September 2026)
- [4] Investor.gov (Glossary: Futures; read 15 September 2026)
- [5] Investor.gov (Glossary: Leverage; read 15 September 2026)
This is independent educational commentary on one speaker’s framework and his review of one session. It is not official ICT material, it is not a tested trading system and it is not investment advice. The recording contains no profit or loss figure and none is reported here. Leveraged index futures trading involves substantial risk and is not suitable for everyone.