
Key takeaways
ICT reviews the June 2023 E-mini S&P futures contract across weekly, daily, 15-minute, three-minute, and one-minute charts, identifying 4,244 even as a possible upside draw while warning it might not be reached that week.
Read the full summary
ICT reviews the June 2023 E-mini S&P futures contract across weekly, daily, 15-minute, three-minute, and one-minute charts, identifying 4,244 even as a possible upside draw while warning it might not be reached that week. He transposes weekly order-block and volume-imbalance levels downward, uses the opening of a down-closing weekly candle when its upper wick is short, and divides fair value gaps into high, low, 25 percent, 50 percent consequent encroachment, and 75 percent levels using a Fibonacci tool, explicitly distinguishing this from quarters theory. His retrospective May 17 bullish Silver Bullet example begins with a 9 thirty Judas swing below a short-term low, followed by a market-structure shift and entry from a fair value gap formed between 10 and 11 New York time, with roughly ten handles from 4,130 to 4,140 available while his teaching rule takes profit at five. He reads the session through Power of Three as open, manipulation, long accumulation, premium distribution, and close, citing confluence at the low from the opening range gap low, daily discount fair value gap consequent encroachment, and new day opening gap. TradingView regular trading hours exposes the opening range gap between the prior close and 9 thirty open, while Forex Tester is mentioned for market replay. ICT emphasizes detailed historical chart journaling, higher-time-frame bias, level transposition, event times, liquidity, constructive notes, and studying one market or two correlated markets, claiming every profitable student followed this process. The 28 minutes 25 seconds YouTube recording by The Inner Circle Trader contains no executed trade, verified result, fills, slippage, independently measured charts, or substantiated student performance, so all setups, levels, Twitter references, and outcomes are ICT’s retrospective interpretations rather than tested evidence.
How we researched this article
BestProps used document-based research from primary firm sources, checked September 24, 2026. The complete source list, scope, limitations, and commercial-state record appear near the end of this article.
He frames the video as a short review that folds together things he taught in the 2022 and 2023 mentorship, and he works top-down: weekly, then daily, then 15-minute, then three-minute and one-minute. This article paraphrases what he says, written from the timestamped captions of the recording and not from independent market data.
ICT 2023 Higher Time Frame Market View
On the weekly chart of the June 2023 ES contract he points to an area above price that he says he had been mentioning on Twitter and in earlier sessions, and notes that Nasdaq futures had already delivered into a comparable area (0:23). His stated expectation was for the weekly candle to expand upward into that high and into the weekly volume imbalance, with Thursday and Friday’s action doing the work (2:01).
He is specific about a charting choice. On a down-closing weekly candle he uses the opening price rather than the candle high, and he explains the reason: when the upper wick is a short stub relative to the candle’s entire range, he prefers to use the opening price instead of the high (1:36). On the daily chart he carries the weekly blue order-block area forward and says those levels will transpose into the lower time frames, warning viewers not to be confused by that (2:20). He identifies relative equal highs inside the weekly volume imbalance and names 4,244 even as a draw he likes, while saying plainly that price may not get there that week (3:20).
ICT Mentorship Fair Value Gap Levels
One of the more practical sections starts at 4:47. He takes a daily fair value gap and draws its gradient levels: a dotted line at the midpoint, then the lower 25 and the upper 25, then the high and the low of the gap itself. He calls the midpoint consequent encroachment (5:00). If you have watched this channel’s other ICT write-ups the vocabulary will be familiar; what matters here is that he is using the internal levels as a way of organising observations about where price reacts, not as a claim that each level must hold.
He then says explicitly that this is not quarters theory, and that the levels come from transposing and watching how price respects them (5:27). On the 15-minute chart he shows the market respecting those gradient levels and explains how to reproduce them: drop a Fibonacci tool across the high and low of any fair value gap or gap of any kind and enable the 50, 25 and 75 percent levels (8:03).
ICT May 17 Silver Bullet Market Example
The review narrows from the 15-minute chart to a three-minute chart and then to one minute. He describes this as the way he teaches students: start at the higher time frame, refine downward until the imbalance or the model becomes visible (11:44). He notes that he had introduced the ICT Silver Bullet setup in a Twitter Space audio discussion and that the video published just before this one is the first video presentation of it (11:58), and he points viewers there for the detail of that time-based model.
For May 17 he walks the morning sequence in order: a buy-side liquidity pool above, a 9:30 drop that he calls a Judas swing, that drop clearing a short-term low, a shift in market structure at a short-term swing high, and a fair value gap that forms between 10:00 and 11:00 New York (13:23). Because his bias was bullish, he describes trading into that gap as a Silver Bullet long, entering from that candle’s low and running to the high. He asks whether the move offers ten handles and answers that it does, because 4,140 to 4,130 is essentially ten handles, and notes that the level has still not reached the higher reference above 4,144 (14:20). He adds that the way he teaches that model, profits are taken at five, and says this is how he teaches his son to work with it (14:27).
He then reads the subsequent reversal. Once price reaches the buy-side liquidity he says it comes straight back down and takes out sell-side liquidity, which he describes as a run on stops that lets what he calls smart money accumulate new longs while trailed stops are hit (14:45). What price comes back into, in his reading, is the daily discount fair value gap, and more specifically the upper quadrant, the 75 percent level of that range (15:05). He pauses on the distinction between a gap that has merely been revisited and one that has become balanced: he says an imbalance is not balanced simply because price touches it, and that it becomes a balanced price range only after price has been delivered outside the range, failed to go lower, respected it, and then left (14:58).
ICT 2023 Market Opening Range and Power of Three
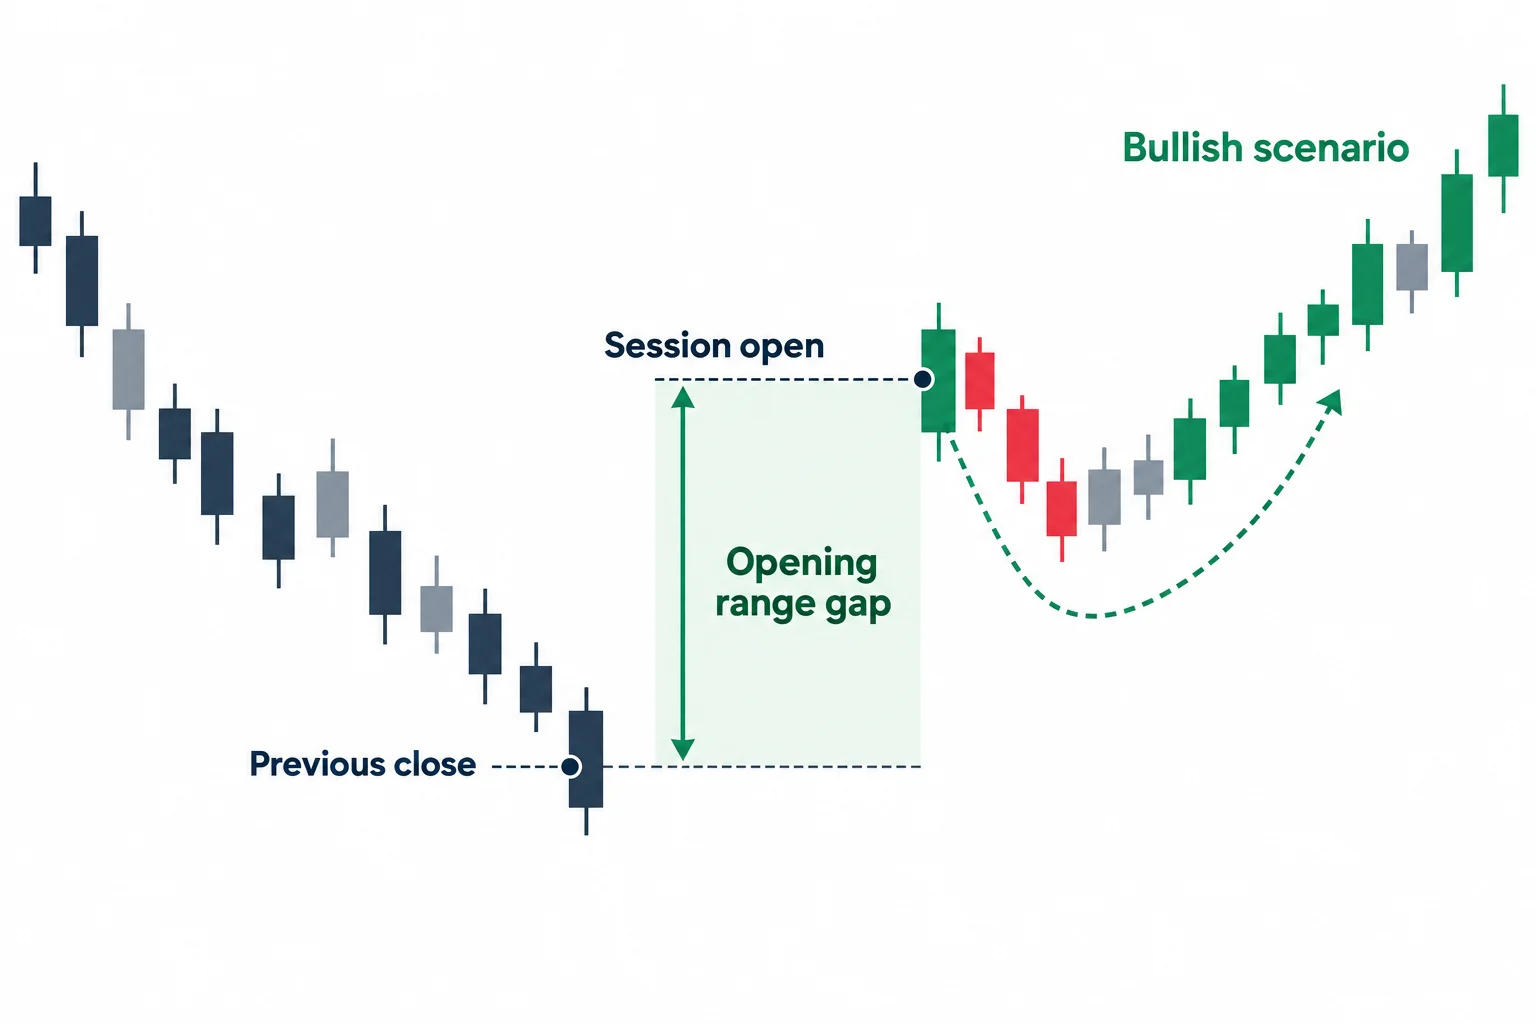
At 16:16 he moves to the one-minute chart and shows how to expose the level he wants to talk about: toggle TradingView from electronic trading hours to regular trading hours with live data (16:42). With regular trading hours selected, the chart shows what he calls the opening range gap, which he defines as the separation between the previous session’s closing price and the price where the market opens at 9:30 (17:10). He notes that he has been using this since 1996 and says he does not claim to have created it (17:20), and that it is one gap he likes to see used (17:37).
He gives the bullish, bearish and consolidating versions of the same level. If price gaps higher while he is bullish, he expects price to trade back down to the gap, reprice it, and then move higher away from it after the fill (17:27). If the context is bearish, the same gap can become a trade lower: a fill, then a false run, then a break lower. If the market is consolidating and has already met a higher-time-frame objective, he says the gap can simply be used all day without producing follow-through (18:21). In his own words, a gap fill does not carry only one implication, which is worth noting against the common summary that the gap “has to” behave a particular way.
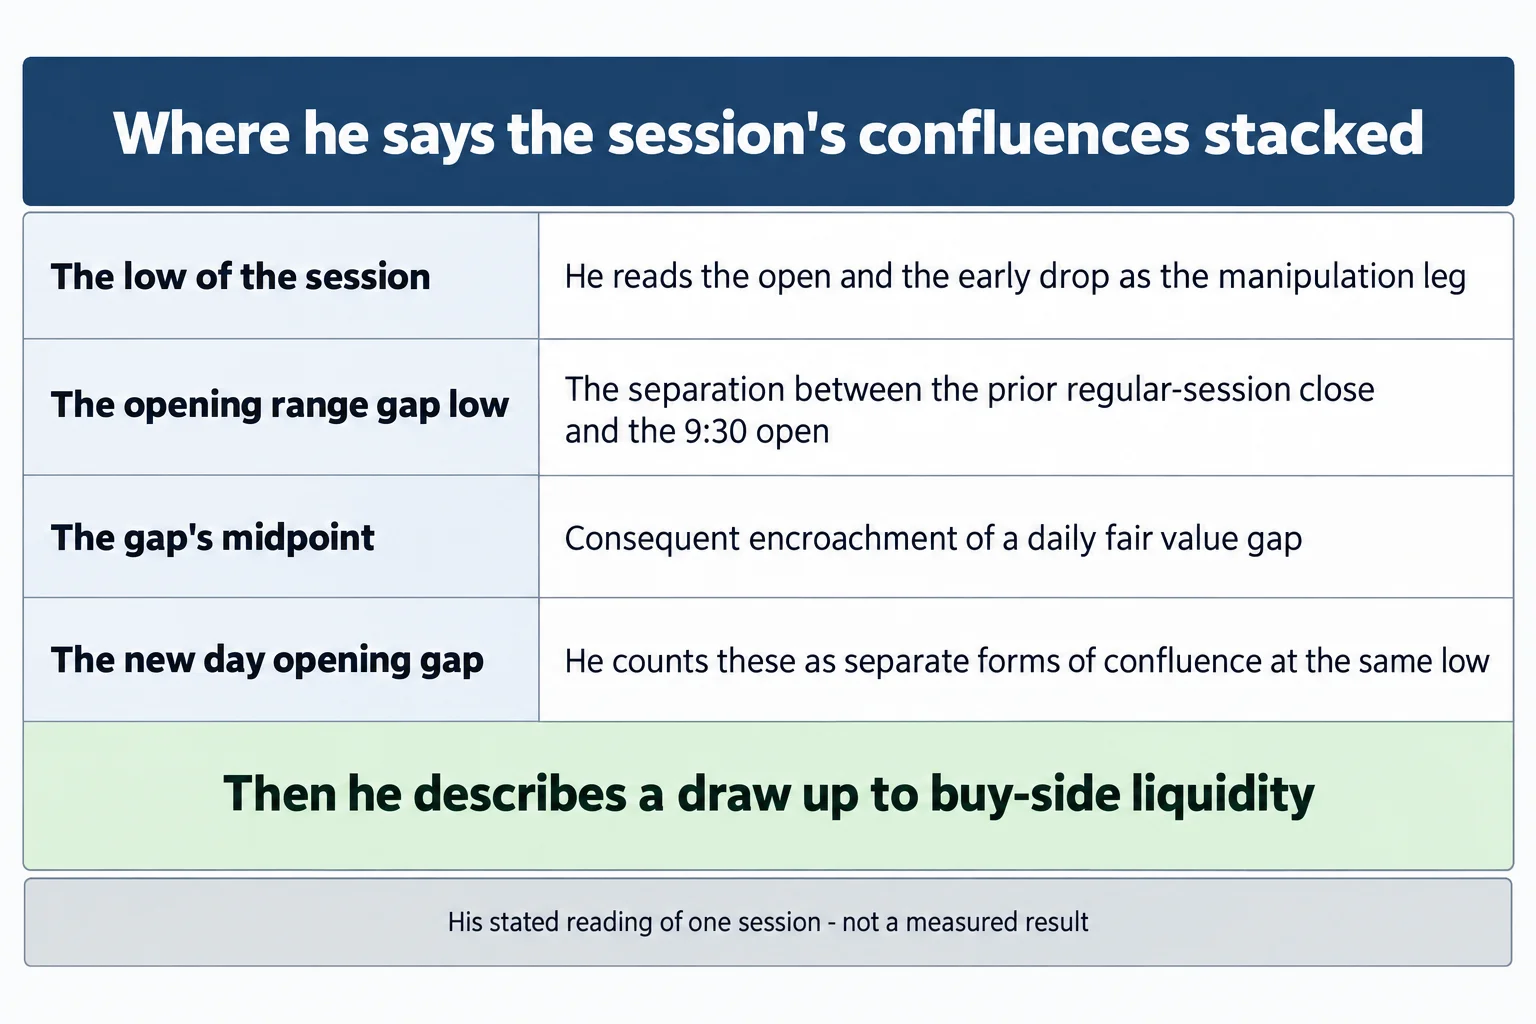
He then reads the reviewed session through his Power of Three model at 20:20: the range opens at 9:30, trades down in what he calls the manipulation leg or Judas swing, then accumulates and distributes into a premium. He describes the opening bell as typically seeking to reprice back toward the previous session’s close, says that drop created the low of the day, and says the market begins running higher once price meaningfully moves above the opening price (20:45). He lays out the model as open, manipulation, accumulation of longs, distribution into a premium, and the day close (21:28).
The confluence list for that low is the part he emphasises: the opening range gap low, the consequent encroachment of the daily discount fair value gap, and the new day opening gap all lining up at the same place, which he counts as several independent reasons for the reaction he shows (21:41). He adds that he had drawn the buy-side liquidity objective on Twitter on May 16, 2023 and that the day’s high was booked at the daily premium fair value gap high (21:51). He also says a trader using retail logic would not see the confluences he is pointing at, and that when price is not going after stops or repricing an inefficiency it consolidates and frustrates traders, which he says is what the preceding days and weeks had looked like (23:11).
ICT Mentorship Market Chart Journaling Process
A substantial part of the recording is about study habits rather than a setup, and it starts at 8:48. He contrasts two practices. Market replay, which he describes as practising forward on previously recorded data and using tools such as Forex Tester, has its place but is not what he is showing here (9:00). What he shows instead is going back through old price data, annotating each time frame, recording when key events occurred, and building the review into slides or a journal (9:15).
- Start with a higher-time-frame directional premise and stick with the narrative while you work (25:05).
- Transpose the important zones down through the time frames rather than re-drawing them at each level (2:20).
- Mark the levels, the liquidity, and the time of day that each event occurred, then record the detail rather than a scribble (24:00).
- Include everything you observe, and use constructive wording rather than telling yourself you were stupid or that something does not work (27:06).
- Study one market, or two if they are closely correlated, so the work stays detailed (27:39).
He is emphatic that this is the part that produces results in his view, saying the journal you write is the most useful trading manual you will ever read because it is built from your own annotations and snapshots, and that every one of his profitable students did that kind of work (24:27 and 25:03). He also compares the practice to other technical disciplines that train on historical or post-mortem cases. Two things are worth separating here for an independent reader: the study method is a habit recommendation, and the claim that profitable students all used it is his assertion about people this article cannot observe. Nothing in the recording establishes how any student performed.
What the ICT 2023 Market Recording Does Not Prove
This is a narrated review of a historical chart, produced and explained by its author. The captions are YouTube’s automatic ones rather than a checked transcript, and they garble some of his terms: “fair value gap” is rendered as “forever you got” or “everybody got”, “consequent encroachment” once as “consequence encouragement”, “Judas swing” as “Judah swing” or “judo swing”, and “buy-side” as “by side”. Normalisations here are limited to places where the surrounding context is unambiguous. The recording contains no chart images this article can measure and no executed trade: the Silver Bullet entry and the entry price are drawn descriptions on his own charts, and the captions do not document fills, slippage, or what happened after the reviewed session. His references to Twitter posts cannot be checked from the recording and are reported as his statements. Every level, structure and confluence above is his reading of a chart he was annotating, and the reviewer of this article saw none of it. If you want to study the session, compare the stated times and levels with properly configured historical data, and treat a retrospective explanation as different from tested evidence. This is educational commentary, not investment advice or a performance promise.
Watch the ICT Mentorship 2023 Market Recording
ICT Mentorship 2023 – ES Market Review May 17, 2023
The Inner Circle Trader · published 17 May 2023 · about 28 minutes. This is the primary source for this article; every timestamp link above points into it.
The video is not embedded here because the owner has disabled playback on other websites. That was checked directly on 15 September 2026: the player loads and returns “Playback on other websites has been disabled by the video owner” instead of playing.
The watch page was read on 15 September 2026: playability status OK, not unlisted and not private, 28 minutes 25 seconds long, published 17 May 2023 at 7:31 p.m. Pacific. The inventory used to schedule this article lists the same video under the date 18 May 2023, a UTC calendar day later than the publish timestamp; those are two dates for one upload rather than a contradiction, and the title itself names the session date of 17 May 2023. The channel is The Inner Circle Trader on YouTube, which is the first-party record of what it uploads and takes precedence over any reupload or third-party archive.
ICT Mentorship 2023 Market Resources
These are the sources checked for this article. The regulator and investor-education pages below are general material about system-based and leveraged retail trading; they are not assessments of ICT or of anything said in the recording, and none of them verifies a statement made here. Any ICT, smart-money or third-party indicator, script, note set or transcript circulating outside the publishing channel’s own upload page is unofficial and untested here.
- [1] ICT Mentorship 2023 – ES Market Review May 17, 2023 (The Inner Circle Trader; primary source; watch page read 15 September 2026, 28M25S)
- [2] The Inner Circle Trader (official YouTube channel; read 15 September 2026)
- [3] CFTC, Fraud Advisory: Commodity Trading Systems Sold on the Internet (read 15 September 2026)
- [4] CFTC Learn & Protect, Forex Frauds (read 15 September 2026)
- [5] Investor.gov, Glossary: Leverage (read 15 September 2026)
This is independent educational commentary on one speaker’s framework and his review of one session. It is not official ICT material, it is not a tested trading system and it is not investment advice. No profit or loss figure is stated anywhere in the recording and none is reported here. Leveraged index futures trading involves substantial risk and is not suitable for everyone.