
Key takeaways
In ICT Mentorship 2023 – Proper Learning & The Importance Of Journaling, an 86-minute lesson, ICT argues that journaling is the step most students skip: he says everyone he calls a profitable student went through this process before demo or paper trading, and that no amount of watching videos, buying books or copying his examples…
Read the full summary
In ICT Mentorship 2023 – Proper Learning & The Importance Of Journaling, an 86-minute lesson, ICT argues that journaling is the step most students skip: he says everyone he calls a profitable student went through this process before demo or paper trading, and that no amount of watching videos, buying books or copying his examples substitutes for personally annotating old price action (0:46, 1:15, 5:01). He demonstrates a top-down journal on a Nasdaq continuous contract, working the monthly, weekly, daily, four-hour and hourly charts while labelling every PD array by the time frame that produced it (10:51, 27:26). He also prescribes writing old annotations as though you had anticipated the outcome, which he describes as conditioning the subconscious rather than an accurate record (12:21).
How we researched this article
BestProps used document-based research from primary firm sources, checked September 24, 2026. The complete source list, scope, limitations, and commercial-state record appear near the end of this article.
This is a retrospective explanation of a lesson about method and study habit. It does not document a trade from entry to outcome, it contains no chart values or performance record, and the claims he makes about his former students are his own account rather than measured findings. The captions are automated and mis-render his vocabulary in places, so his terms are quoted as the captions have them.
Why he treats journaling as the missing step
He opens by calling the topic briefly covered but not to be discounted, and says every profitable student he has ever had found their consistent model through this process – day traders, short-term traders, position and swing traders alike – and that they spent time on it before attempting demo or paper trading (0:25, 0:46, 1:15). That is his assertion about his own students, not a measurement, but it is the premise the whole lesson rests on.
His diagnosis of the habit he is arguing against is specific: students watch a lesson on a single element and believe they understand the whole, then lose themselves in price action while looking for one component – \”one little cog in the wheel\” – whether that is a fair value gap, an order block, an optimal trade entry or a breaker (2:27, 2:24). His stated remedy is a well-rounded approach built by the learner going into their own charts, which he says will not come from watching his videos, someone else’s videos, or his live trades (2:39, 2:51).
He also pre-empts the objection he expects, saying he can already imagine viewers thinking they have heard this before and do not have time because they need to make money – which he connects to the same people later complaining that they cannot find their model or read price action (3:03, 3:11).
His definition of backtesting, against replay reports
He defines backtesting for his purposes by what it is not: not taking a trade, and not going back through a forex or market replay or a NinjaTrader market replay report to look at numbers (3:55, 4:02). His objection to posted replay reports – how many trades, long and short, with net results – is that unless the reader knows why that price action should have delivered the way it did, the numbers do not give them a procedure they can repeat (4:16, 4:44, 5:01).
What he says actually matters is how much time you spend in a chart with a real understanding of what you are looking for, rather than gazing at it; if candlesticks read like a foreign language to you, he says, it is because this step has not been done (5:34, 5:47). He explicitly declines to name journaling apps, saying he has no affiliation, takes no affiliate payments and does not want his recommendation to depend on one (6:07, 6:40).
The inputs he says are sufficient are narrow: where the inefficiencies are, where liquidity sits above and below, and the time of day and day of the week. He says you do not need volume, VWAP, point of control or an indicator, and that he does not use market profile, depth of market or volume plotted sideways, which he calls gimmicks (8:07, 8:19, 1:11:02). That is his stated position, presented here as his opinion rather than as an established result.
The worked example, from the monthly chart down
His example uses the Nasdaq continuous contract on TradingView, symbol NQ1!, chosen because the continuous series carries the higher-time-frame monthly history that a single delivery-month contract does not (9:05, 9:18, 36:01). He explains that the continuous contract rolls into the next nearby contract when the front month expires, and notes that a trader using actual futures trades that nearby contract rather than the continuous one (34:45, 35:23). He says the same approach applies to euro/dollar, the dollar index, the E-mini S&P or any commodity, and that the point is a top-down pass through the PD array matrix (10:36, 10:47).
Before he annotates anything he asks viewers to pause the video and identify for themselves what price referred to in the most recent monthly candles and what might be useful going forward, saying that skipping the pause means not getting the most out of it (11:11, 11:27).
On the monthly chart he labels a bearish breaker, noting that because it is also a down-close candle it can equally be called a mitigation block, and he says breakers are mitigation by default (12:59, 13:16). He then defines his shorthand in the same stretch: a sell-side imbalance/buy-side inefficiency is a fair value gap formed by a down candle, and the buy-side version is formed by an up-close candle (13:51, 14:04). Later he gives the memorisation cue: the sell-side one is \”sell off\”, the buy-side one is \”buy up\” (1:25:20).
His monthly journal entry, read out in the recording, is a good illustration of the language he wants: he says he was anticipating the September 2021 down-close candle to provide the characteristics of a bearish breaker, that it was long overdue after five months of buy-side delivery, and that with the recording made in August 2023 it was reasonable to anticipate August creating a down-close candle (16:35, 17:03). He then says plainly that this statement was true for him personally but may not be for the viewer, who might never have referred to that candle at all – and that in journaling you record as if you did (18:27, 18:44).
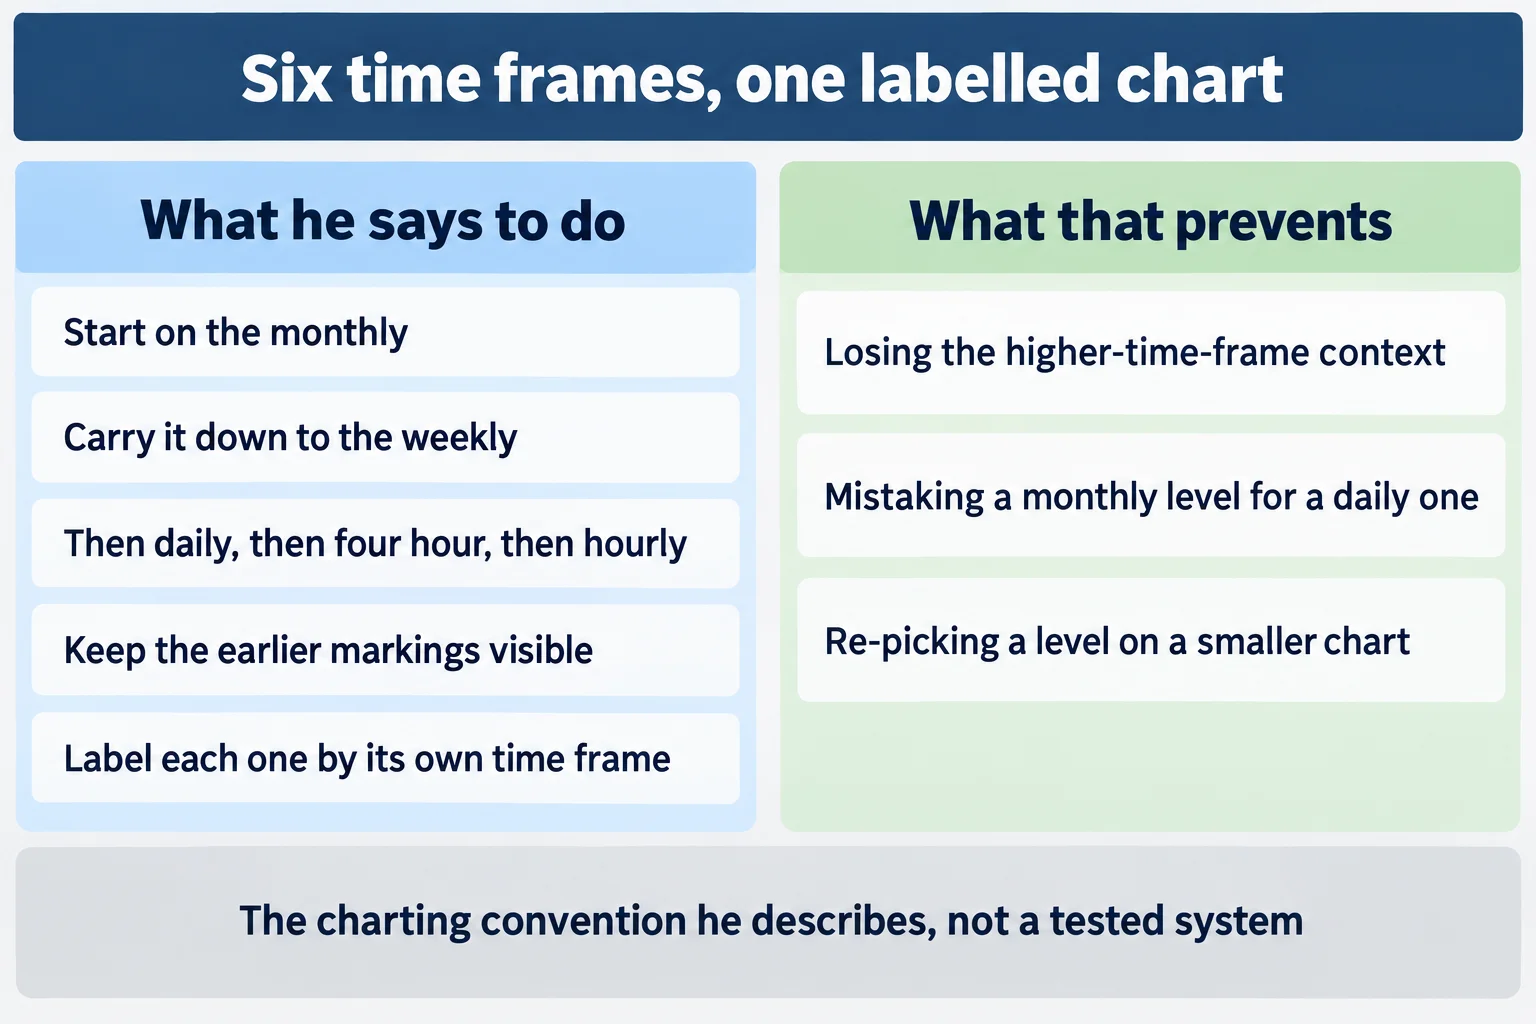
He moves the same markings down to the weekly chart by using TradingView’s option to show an annotation on all intervals, so a level drawn on the monthly appears on every smaller chart, and he stresses that each one must carry its originating time frame in its label so a monthly fair value gap cannot later be mistaken for a weekly or daily feature (26:37, 27:06, 27:26). He distinguishes consequent encroachment from mean threshold in the same passage: the midpoint of a gap or wick is consequent encroachment, while the midpoint of an order block is mean threshold (28:01, 28:26).
He is careful to separate observation from prediction while doing this. Looking at the weekly, he says the level might show sensitivity in the coming week, and then states that this does not mean price will reach it or trade through it – \”I don’t know that\” – so the answer is to wait and see how it trades (29:58, 30:20). The value he claims for the exercise is that the reader stops losing the story across time frames: the same candles read very differently on the daily, which is what he says trains the eye to see how lower time frames respect higher-time-frame arrays (33:39, 33:46).
A more advanced observation from the daily chart is what he calls nested arrays: a daily imbalance whose high sits not only at the high of a monthly fair value gap but also at that gap’s consequent encroachment, so two levels coincide (48:39, 48:50). He says this is the kind of convergence he used to point out in passing during recorded executions, and that he now deliberately leaves it for viewers to find in their own charts (49:36, 50:03).
The journal language he prescribes
This is the part of the lesson with the clearest practical instruction. He says to write annotations as though you saw the move coming, even when you did not, describing it as conditioning the subconscious by recording what he calls pseudo experiences so the brain recognises the pattern later (12:21, 12:29, 12:34). His monthly entry above is the worked example of that style, and he returns to it explicitly, saying you are \”tricking your subconscious\” by repetition and by rereading the entries (42:40, 42:58).
He pairs this with an instruction not to record certain things at all: no scary thoughts, no periods of confusion or of feeling that you do not know, and no language that communicates frustration (21:22, 21:28). He acknowledges some viewers will find this a waste of time and say they have money to make (21:41). What he offers instead is a specific reframing for a genuinely wrong expectation – if you thought buy-side liquidity would be taken and it went the other way, he suggests writing something like being grateful for the opportunity to learn why sell side was attacked over buy side that day (22:20, 23:40). He calls the journal a cheerleading vehicle and says it becomes the trading manual you wrote yourself (24:44, 24:51).
The analogy he uses to explain why the repetition works is watching a film you have seen many times: you already know the outcome, but you keep watching, and by repetition the pattern becomes familiar (43:02). He extends it to a relationship with price, describing the exercise as writing \”love letters to your future self\”, and says that without this part he does not think long-term consistency is possible (43:56, 44:01, 44:46). The last of those is a claim about what he believes is required, not a demonstrated finding.
Where this article departs from the prescription
ICT’s instruction to record old charts as if you had anticipated them is a learning technique he is recommending, and he is explicit that it involves recording something that did not happen at the time. A reader who also wants a factual record of their own decisions can keep the two separate: a dated log showing what you actually expected before the outcome, what would have invalidated that expectation, and what happened, alongside the annotated chart study written in his encouraging style. Both are useful, and mixing them means the dated log stops being a record of anything.
He is consistent with that distinction himself in one respect. When he narrates what the charts did, he repeatedly separates what he observed from what he could not know in advance, as with the weekly level where he says he does not know whether price will reach it or trade through it (30:20). What he does not provide anywhere in the recording is a measure of how often the patterns work, and nothing in the lesson reports a tested result.
His risk rule and the later time frames
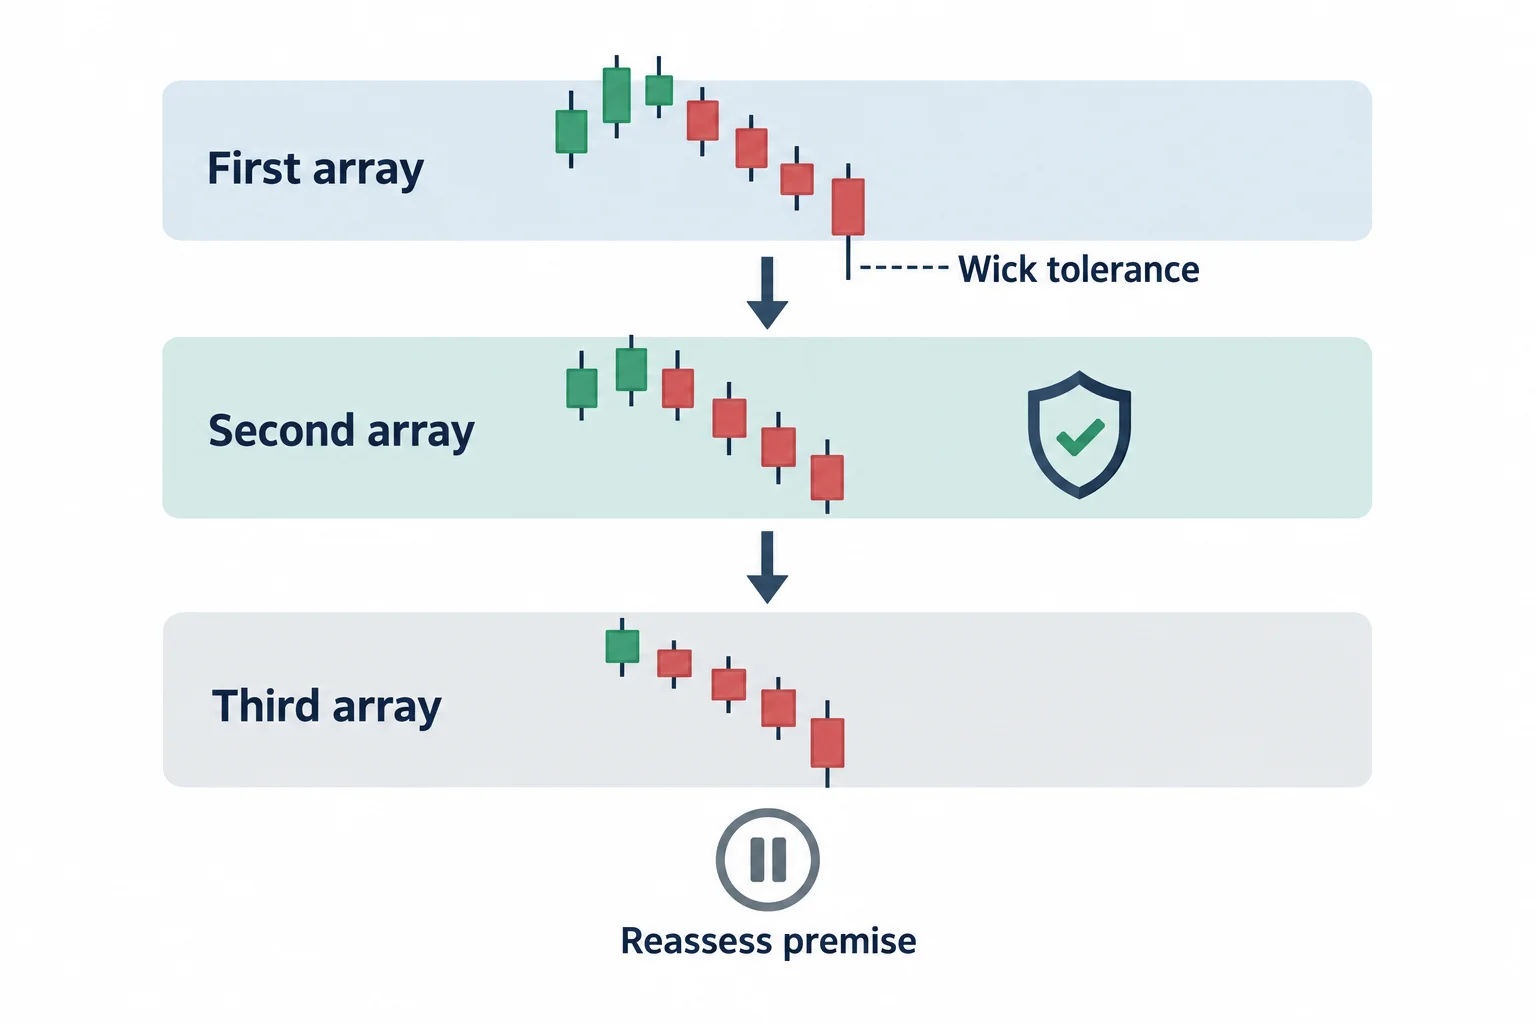
Partway through he states the one hard rule in the lesson. Having marked arrays on the monthly, weekly, daily and four-hour charts, he says he keeps a rule of three PD arrays: his first array can be touched and even wick beyond, the second he treats as a defence, and if price trades through three of them he assumes he is probably wrong and removes himself from risk if he has not already been stopped (1:02:49, 1:03:04). He illustrates it with a live Nasdaq trade he says he posted to Twitter, where one of his three arrays was breached and the second was being approached (1:03:17). The trade and the account are his own account of them; no statement or fill appears in the recording.
He also argues repeatedly that small violations of a level are normal rather than a reason to change a view, using the phrase \”coloring outside the lines\” and calling such a wick a \”mohawk\” that is permissible price action (58:19, 58:58, 1:02:19). His stated reason is that a stop placed just above such a level is often not enough, and that anticipating the small overshoot prevents being scared out of a view that is still intact (58:26, 59:08).
On the daily chart he walks a week of Nasdaq price action: a daily imbalance redelivered to, a Wednesday range that extended past the low of what becomes an inversion fair value gap, and Friday trading up into the inversion gap’s consequent encroachment, which he says became Friday’s high (59:00, 1:09:21, 1:14:00). He notes that an inversion fair value gap is narrative-based: the same area is only an inversion once price has already delivered to the sell side and pierced the range, which is why the label depends on context rather than on the shape alone (51:00, 52:00).
Two details in that walkthrough are worth keeping because they constrain how the example should be read. He notes the session was non-farm payroll Friday, that a new student would not necessarily be trading that day, and that it was \”not an easy short selling day\” (1:10:15, 1:09:41). And his closing remark on the payroll print is that it takes out the lows after taking buy side, running both sides of the marketplace, which he says he has taught before and that it \”delivered again like gangbusters\” (1:25:45, 1:25:52). That is his characterisation of one session, not a tested frequency.
On the four-hour and hourly charts he makes a point that is genuinely practical for anyone building this kind of journal: what looks like one inefficient area on the daily can be several back-and-forth passes on the four-hour, meaning there is no open inefficiency and no liquidity there at all, and the lower time frame shows a more refined rendition that the higher chart cannot reveal (1:13:50, 1:17:24). He calls the hourly annotation in his own journal the \”NQ continuous 60-minute journal entry\” (1:24:55).
He also says he keeps his levels as a plain numbered list on paper rather than relying on the chart, giving the sequence in the recording as 15,840, then 15,800, then 15,760 below it, and states that he does not need a chart to trade – just the paper and knowing the time (1:20:47, 1:21:02, 1:21:21). Those three levels are transcribed from the captions, which spell numbers inconsistently, so they should be treated as approximate, not as verified chart values.
What the lesson says about how long it takes
His duration estimates are unambiguous and are the most checkable content in the lesson. He says months of doing this are needed before it becomes comfortable, and that this is a daily practice rather than a week where you cram it all in one day (38:15, 38:22). He calls it a daily meditation and says every single day is a day you must journal, in whichever market you intend to specialise in (38:24, 38:28, 38:31). He connects it to market selection: he says he teaches focusing on one market, and that following many markets without a consistent model is a waste of time (15:15, 38:39). He also says the journal itself should be kept private and can carry personal notes for that market and time frame (15:03, 15:09).
The strongest claim in the lesson comes here, and it is worth stating plainly rather than repeating as fact: he says a student who refuses to journal will not be consistent, might get lucky occasionally, and will end up break-even or \”crash and burn\” without saying so publicly (39:03, 39:15, 39:23). That is a prediction about other people’s outcomes, and the recording offers no data behind it.
He adds that you should annotate everything after the fact rather than only the array you favour, and that the pattern which matters most to you will turn out to be whichever one your eye finds easiest – he gives the mitigation block as an example of an obscure one that may suit some students better than the popular choices (40:05, 40:10, 41:37). He lists order blocks, fair value gaps, the 2022 model and the time-based Silver Bullet as candidate components, while saying the model should be uniquely yours rather than forced (41:54, 42:00). He also tells first-time viewers directly that this lesson is not where to start and points them to his 2022 mentorship series for context (1:01:04, 1:01:19).
What this lesson does and does not establish
What the recording supports is that ICT said these things on this date, in this order, on this chart walkthrough, and that the timestamp links above mark where. It documents a study method, a labelling convention and a three-array risk rule as he states them.
What it does not establish is that any of it produces a result. There is no performance record, no chart data, no order ticket and no statistics anywhere in the 86 minutes. The claims about his former students, the prediction about students who do not journal, the frequency implied by \”delivered again like gangbusters\” and the assertion that the method cannot be learned without this step are all his own statements, presented here as his claims. Nothing here is a recommendation to copy the sequence, and no part of this method has been tested for this article.
Watch the original recording
Watch the original recording on YouTube
This video cannot be played inside another website. Its embedded player was loaded and clicked from a BestProps page on 15 September 2026 and reported “Video unavailable — Playback on other websites has been disabled by the video owner.”, staying on a “Watch on YouTube” prompt with no playback progress, while the public watch page plays normally. That is why there is no inline player here.
Watch ICT Mentorship 2023 – Proper Learning & The Importance Of Journaling on YouTube ↗
The recording runs about eighty-six minutes and is the only primary source used for this article. The channel is The Inner Circle Trader on YouTube.
Resources
These are the sources checked for this article. The CME Group page is the exchange specification for the Nasdaq-100 futures contract used in the example, and the two CFTC pages are general regulator material on hypothetical trading-system results and on retail forex fraud. None of them assesses ICT, this lesson or the charts he annotates, and none verifies the account comments he makes. Copies, notes and indicator bundles derived from his material circulate outside his own distribution and were not tested here.
- [1] ICT Mentorship 2023 – Proper Learning & The Importance Of Journaling – The Inner Circle Trader (primary source; watch page read 15 September 2026, 86M29S)
- [2] CME Group – E-mini Nasdaq-100 Futures Contract Specs (the exchange specification for the contract in the worked example; checked 15 September 2026)
- [3] CFTC Learn & Protect – Forex Frauds (states that two out of three retail foreign