
Key takeaways
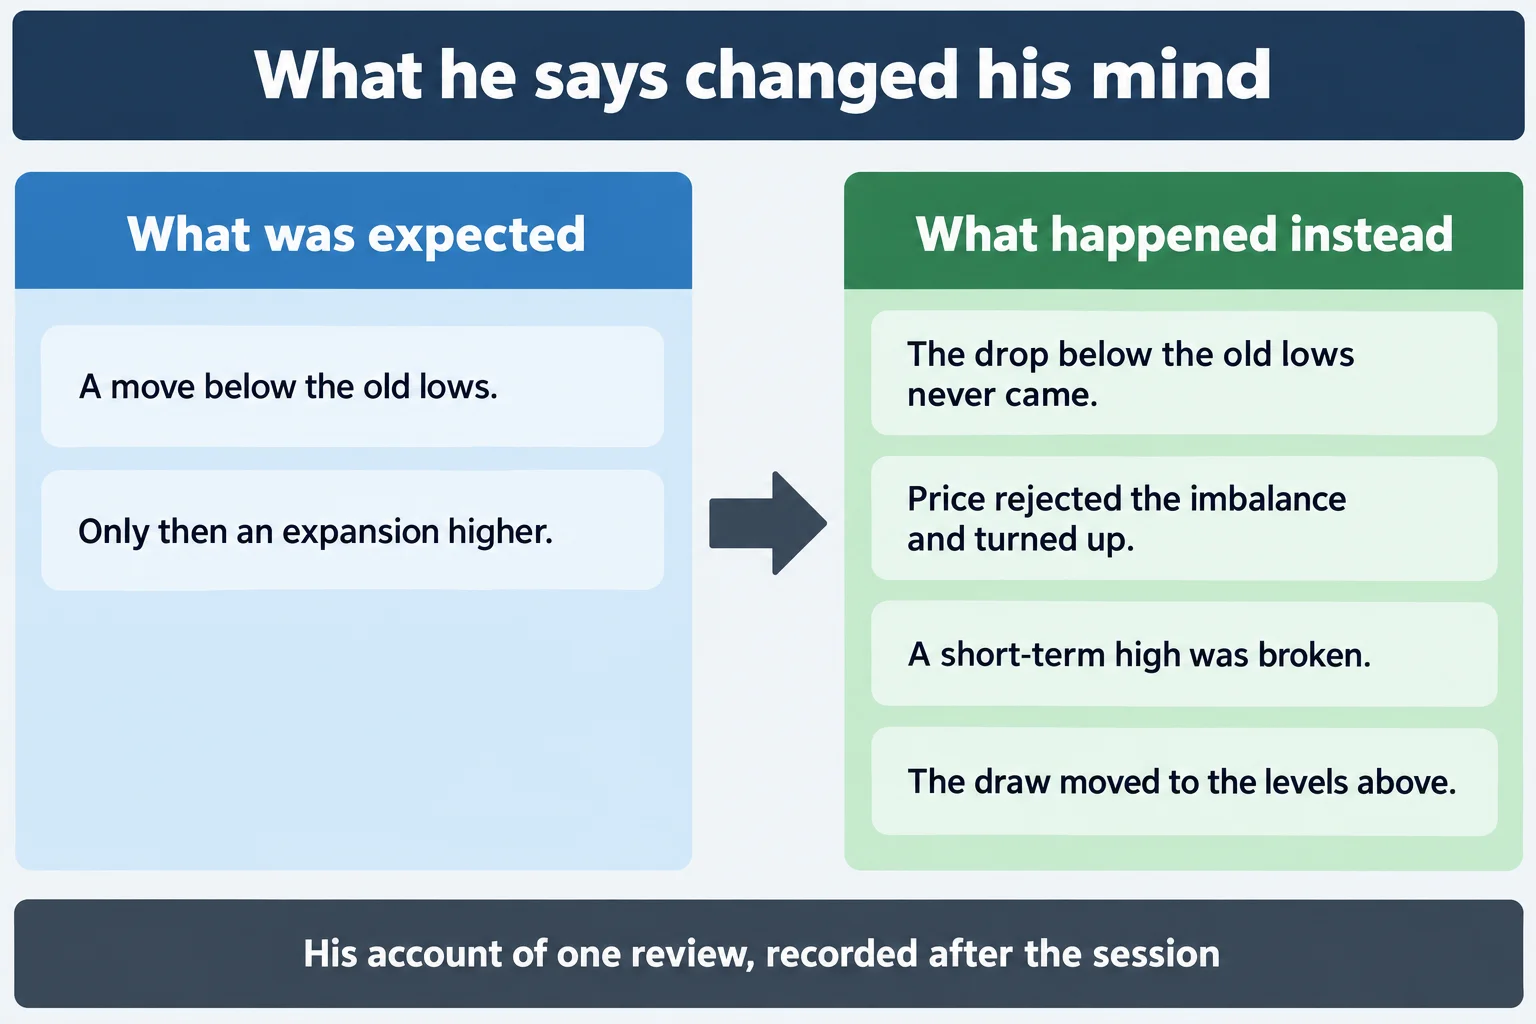
In January 2023 NonFarm Payroll Review & HTF Concepts (0:28), the speaker reviews Friday 6 January 2023 on the E-mini S&P only, saying he is skipping Nasdaq, and explains how he moved from an expectation of a drop under the relative equal lows to buying the retracement instead.
Read the full summary
In January 2023 NonFarm Payroll Review & HTF Concepts (0:28), the speaker reviews Friday 6 January 2023 on the E-mini S&P only, saying he is skipping Nasdaq, and explains how he moved from an expectation of a drop under the relative equal lows to buying the retracement instead. He had marked lows at 3822.50 and 3814.50 and says the Micro E-mini contract traded below the corresponding level while ES did not, which he calls an SMT divergence (1:34). His filter was the New York midnight opening price, which he states as 3847.50 on the 15-minute chart (5:51). When the drop below the lows did not happen and price rejected the five-minute imbalance, he says he left the lower target, waited for a short-term high to break, and then worked toward 3876.25, an old daily high at 3885, and 3896.25 (33:10, 33:52). He says he took ten contracts off a twelve-contract position and left two on with a limit order at 3896.25, and that he does not trade the Nonfarm Payrolls release itself, recommending simulated practice instead (33:20, 14:23). He defines Power of Three as accumulation, manipulation and distribution (40:38). Everything numeric below is his own narration as the captions recorded it; the source is a machine-generated caption file with no chart, order ticket or statement in it, so no fill, size or result is independently established.
How we researched this article
BestProps used document-based research from primary firm sources, checked September 24, 2026. The complete source list, scope, limitations, and commercial-state record appear near the end of this article.
The clip runs about fifty-seven minutes and is a review recorded on the Sunday after the session, not a live execution. It is the only primary source used here. The session under discussion is Friday 6 January 2023, the day of the January employment report.
What he says he had marked on the daily chart
He opens on the ES daily chart and says he will not be covering Nasdaq in this lesson (0:28). His starting observation is that price had been inside a trading range, and that within it a level he calls a volume imbalance sat above a short-term high and was a likely upside draw (0:42). The level he anchors that to is a gap between the closing price of one candle and the opening price of the next, and he dates those two candles to 15 and 16 December 2022 (2:30). He asks viewers to keep a level like that on the chart at all times and visible on every timeframe.
On the other side of the range he identifies lows at 3822.50 and 3814.50 and says he was watching them for a break, with 3814 as his target (1:12). He then reports what he treats as supporting evidence: the low printed 3819 on the front contract, while the Micro E-mini contract went below the 3814 level, which he calls an SMT divergence between the two symbols and offers as something to study rather than as a complete setup (1:17, 1:34). Whether those two symbols behaved as he describes is exactly the kind of claim a caption file cannot check, and the specific contract identifiers the captions render are not reliable enough to repeat as fact.
Dropping to the hourly chart he points to the relative equal lows as sell-side liquidity (2:48), and describes his plan for the release: a move below those lows into the stops, then a run back up toward the opposing buy side. He says a move below an old low that is then rejected is a stop raid in his vocabulary, and that the buy side he would then target sits above the levels overhead (3:56). He adds that if the move was going to extend far, the orange daily volume imbalance was the area it would reach into (4:11).
The midnight open as his filter
On the 15-minute chart he marks what he calls the midnight candle in New York local time and gives the price as 3847.50 (5:51). He calls that level the filter for Power of Three (6:23): if the idea was bearish, he wanted price to move above it and then back below before any selling opportunity, on the way toward the lower target.
He is emphatic about chart time, telling viewers to run New York time and arguing that the open printed by a daily candle on a charting platform is not the reference price the algorithm uses, while the midnight New York opening price is (23:01). He adds that a real-time data subscription is what makes his chart appear ten minutes ahead of a delayed feed, and treats that as evidence he is not working from replay. His confidence in the framework is not evidence for the framework, and the specific claim about which price an algorithm references cannot be tested from a transcript.
Why he says he does not trade the payroll release
He states flatly that he does not trade the Nonfarm Payrolls event, because he does not know what the employment number will do and the conditions are too manipulated for the precision he wants (8:13). He says he has shown students how the market can be traded after the first thirty minutes, and that this is useful for studying price action rather than something he advises. Where he does enter during a release, his instruction is explicit: use a simulated account, not live money (14:23).
That is the most transferable point in the clip and it does not depend on any of his levels: a scheduled high-impact release is a day he chooses to stand aside, and when he does participate he distinguishes practice from risk. He also notes at 8:30 that price had run above the level he was watching (7:48) and that beyond the lower target he had 3804 as another reference, which he says can be found as an old daily low (8:04).
The five-minute imbalance he calls a BISI
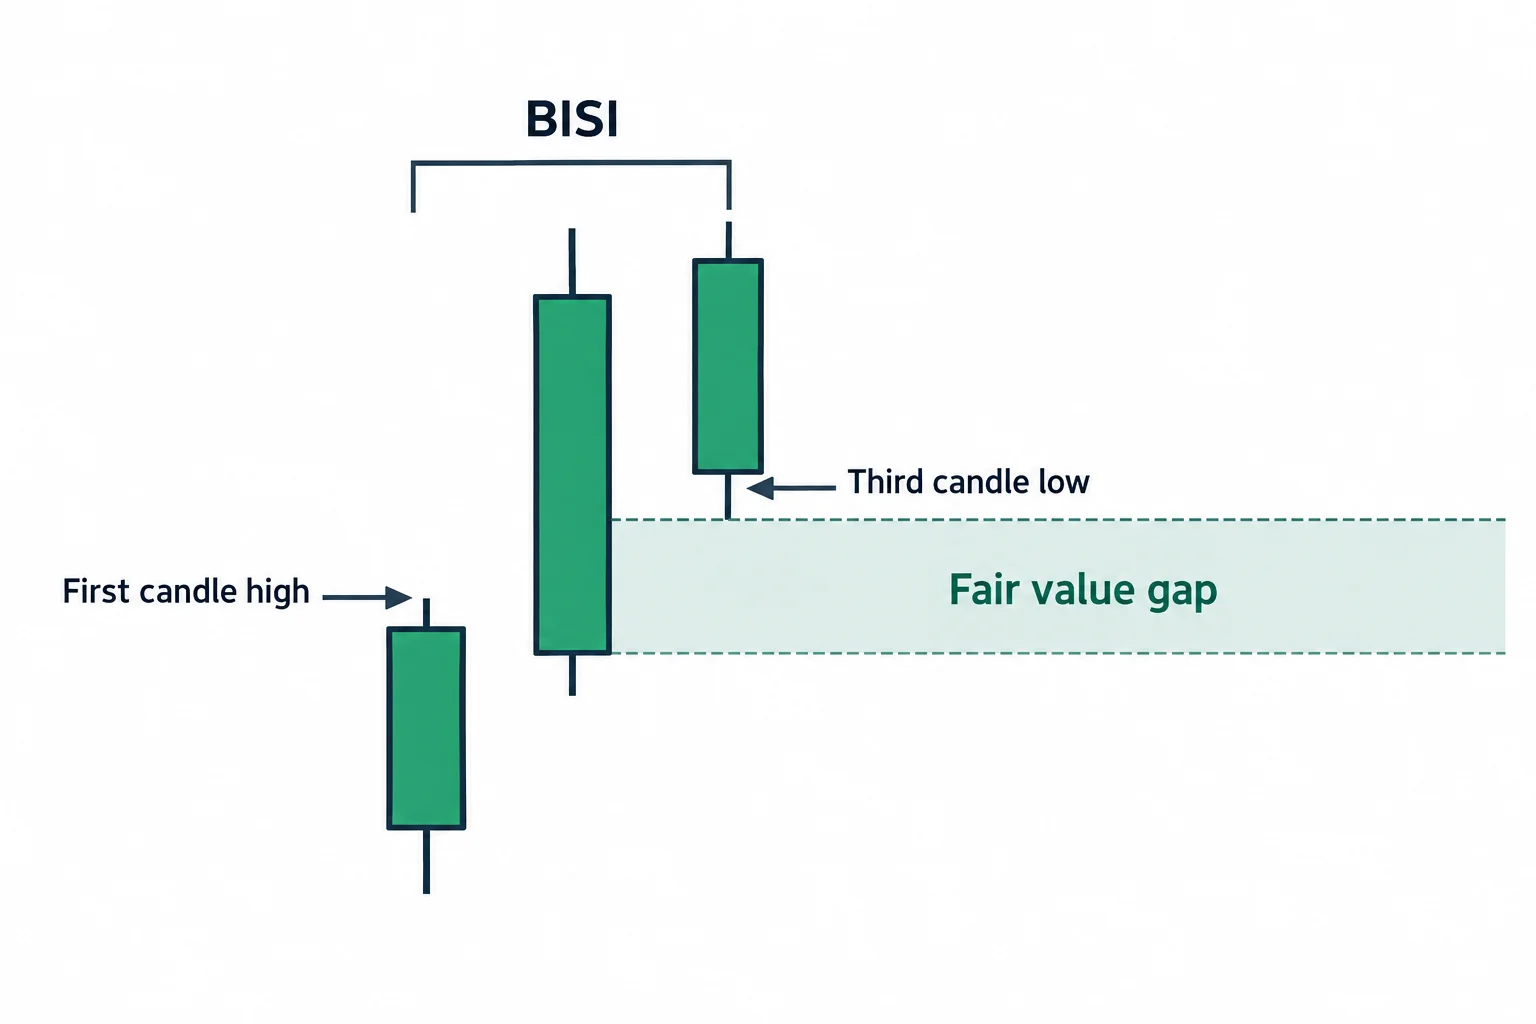
On the five-minute chart he points to an imbalance created by one large candle sitting alone between the high of the candle before it and the low of the candle after it. He calls that structure a buy-side imbalance sell-side inefficiency, abbreviated BISI, and says the category of price array is a fair value gap while the distinction is the BISI (10:20). He describes the single candle as a caffeine bar and says his vocabulary here is his own rather than standard text-book terminology (9:55).
He says he had flagged 3814 repeatedly, then stopped naming it once the area had been rejected (11:01). His reasoning is worth separating from his levels: he says he wanted proof rather than an assumption, and defines rejection as price simply not getting through the lower portion of that range (11:52, 12:11). He also acknowledges that a high-impact release can overshoot areas like that.
The evidence he says changed his mind was a narrow unfilled area near the short-term high, the failure of price to trade back into it, and then a break of the short-term high to the upside (17:12). At that point he cites the level he was watching for buy stops and quotes his own post in support (17:37). The posts themselves are not part of the source, so his account of publishing levels in advance rests on his word rather than on anything gathered here.
The one-minute read he describes
He reduces the one-minute chart to a single dealing range: the session high, the low, and the opening price he has drawn through it. He says he ignores the earlier meandering price action as noise and focuses only on the segment that forms after the release (29:50). His stated rule for a bullish day is to buy at the midnight opening price or below it, and, once price has moved above it, to buy on the return toward it.
The structural detail he points to is a pair of down-close candles that he calls a bullish order block, which he says was also a swing high that price then traded through — his definition of a shift in market structure (25:50). He argues that when levels on a chart look conspicuously smooth they function as liquidity targets rather than as support and resistance, summarised in his phrase that smooth edges like to be made jagged (26:52). That equal highs must eventually be traded is his model, not an established result: equal highs can simply remain in place.
He also acknowledges a mistake in his own commentary. He says two levels he posted were wrong because he misread the chart, and describes the tweet as a typo made in the moment (48:48). It is a useful detail rather than a damaging one: it shows that a posted level is not self-validating, and he is the one flagging it.
The upside references he says he worked toward
He lists the objectives in the order he says they came: 3876.25 as the first draw, then an old daily high at 3885, then 3896.25 as the next level, and he says he placed a limit order at the last of those (33:10, 33:52). He reports taking ten contracts off a twelve-contract position and leaving two on, and later a further partial at the 3885 level with one contract left for 3896.25 (33:20, 38:04). Those are his reported actions in his own review. The captions contain no order ticket, no statement and no account figure, so none of the sizes, entries, exits or economics can be confirmed from this source, and nothing here should be read as a verified result.
He explains the logic behind using previous days’ highs and lows as targets, saying that large funds leave orders at those prices and that he prefers that to reading a depth-of-market ladder, which he says can be spoofed (37:04). He extends the point to the last hour: if the daily candle is going to close near its high, he says, a trader can hold through the final hour and expect a pullback into the range at three o’clock rather than a collapse (38:42). He then points to price entering the daily imbalance area, respecting its upper end, dropping into the lower end and leaving it (39:32).
Power of Three, and the pyramid logic he describes later
He names the framework behind the session and defines it: Power of Three is accumulation, manipulation and distribution, with accumulation happening at the range, manipulation around the release, and distribution as the expansion toward the objective (40:38). He restates the sequence he says the day followed: 3814 dropped out of the plan, then 3876.25, then 3885, then 3896.25 (41:03).
Later, on the one-minute chart, he walks through how he builds a position rather than entering once. He describes an entry he calls an institutional order flow entry drill: an open range in the form of a fair value gap, with price dipping one tick below the framework of the high, and he cites two specific prints for it (50:03, 50:16). He says that when such a gap does close in he is not troubled and treats it as another opportunity to buy the lower end, adding a smaller size at each level while he still has equity behind the position (51:29).
He also distinguishes scaling out from scaling in, saying the largest partial came off first and the final portion last, and that he would not pyramid into a position that had not already paid him (52:47). Anyone reading this as a template should note that it presumes an existing position already in profit; the transcript gives no account size, no leverage figure and no risk limit, so the sizing arithmetic behind it cannot be checked at all.
What the recording can and cannot show
He anticipates the hindsight objection directly and answers it by pointing at his own posts and at screenshots he took as levels were reached (54:24). He then argues that the chart shows no execution arrows, which he offers as proof that the levels he read were not drawn in afterwards, and says he never deletes a post (55:03). Toward the end he says the material is not supply and demand and not classical support and resistance, and that he does not believe it appears in other published sources.
The honest summary is that this clip is a retrospective walkthrough supported by the speaker’s own posts, not an audited record. What a reader can take from the caption file is the structure of the argument: he fixes a higher-time-frame level first, states what he would need to see on a lower time frame, declines the setup when that condition is absent, and changes his draw only when a specific structural event occurs. What cannot be taken from it is any of the numbers as verified fact. The captions are machine-generated and mishear both his terminology and his prices throughout — the lower target is rendered inconsistently, the release is variously transcribed, and the contract symbols are unreliable — which is why every figure above is attributed to his narration rather than asserted. The timestamped posts, the charts, the executions and the profitability are all outside this source and none of them was verified here.
Watch the original recording
January 2023 NonFarm Payroll Review & HTF Concepts
The Inner Circle Trader · published 8 January 2023 · about 57 minutes. This is the primary source for this article; every timestamp link above points into it.
The video is not embedded here because the owner has disabled playback on other websites. That was checked directly on 15 September 2026 from a BestProps page origin: the embedded player loads and returns “Playback on other websites has been disabled by the video owner” instead of playing, so no empty player is left on this page.
The watch page was read on 15 September 2026 and rendered as a public video: title “January 2023 NonFarm Payroll Review & HTF Concepts”, 3422 seconds, playability status OK, published 8 January 2023 at 2:36 p.m. Pacific by The Inner Circle Trader. The scheduling inventory used for this article lists the same upload under 8 January 2023, so the two agree. The Friday session being reviewed is 6 January 2023, two days before publication, which is consistent with a weekend review rather than a discrepancy. The channel page is the first-party record of what is published there.
Resources
These are the sources checked for this article. The regulator and investor-education pages are general material about futures and about trading systems sold to the public; neither assesses the speaker, verifies any level quoted above, or endorses anything said in the recording. Any ICT, smart-money or third-party indicator, script, note set, transcript pack, chart annotation or re-upload circulating outside the publishing channel’s own page is unofficial and untested here.
- [1] January 2023 NonFarm Payroll Review & HTF Concepts — The Inner Circle Trader (primary source; watch page read 15 September 2026, 3422 seconds)
- [2] The Inner Circle Trader — official YouTube channel (read 15 September 2026)
- [3] Investor.gov — Glossary: Futures (read 15 September 2026)
- [4] U.S. Bureau of Labor Statistics — Schedule of Releases for the Employment Situation (read 15 September 2026) — the official calendar for the release the speaker is declining to trade.
This is independent educational commentary on one speaker’s framework and his retrospective review of one session. It is not official ICT material, it is not a tested trading system and it is not investment advice. Leveraged futures trading can produce rapid losses, and trading a scheduled economic release carries additional risk. The recording contains no account figure or verified result and none is reported here.