
Key takeaways
The Inner Circle Trader on YouTube presents an 85 minutes 17 seconds educational recording on Dollar Index, EUR/USD and E-mini S&P institutional order flow, defining immediate rebalance as a candle that first trades back to a prior reference such as an earlier high before expanding, leaving no deferred inefficiency, unlike a move that stops short…
Read the full summary
The Inner Circle Trader on YouTube presents an 85 minutes 17 seconds educational recording on Dollar Index, EUR/USD and E-mini S&P institutional order flow, defining immediate rebalance as a candle that first trades back to a prior reference such as an earlier high before expanding, leaving no deferred inefficiency, unlike a move that stops short and leaves a fair value gap for a later revisit. ICT calls it one of his strongest algorithmic price delivery signatures, reads the Dollar Index example as bullish and the mirrored EUR/USD example as bearish, but says narrative and bias must precede any setup. His EUR/USD objective is relative equal lows followed by a fair value gap near 1.0705 to 1.0700, while his Power of Three framing combines the New York midnight opening price, an order block and removal of buy-side liquidity, with preferred longs below midnight when bullish and shorts at or above it when bearish. On ES, the new day opening gap spans the 5 p.m. close to the 6 p.m. open, opening range gaps generally remain marked for three days, consequent encroachment is half of an inefficiency or gap, and mean threshold is half of an order block. Lower-time-frame Silver Bullet analysis uses one-minute, 15-second and 10-second charts to combine a liquidity sweep, market-structure shift and retracement into a fair value gap, with the trade into the gap occurring during the 10 a.m. to 11 a.m. New York window even if the gap formed earlier. ICT says price moves toward stops or reprices and re-delivers through inefficiency, otherwise it moves sideways, and recommends chart annotation, back-testing, journaling and mastering one or two suitable setups rather than every concept. The recording contains no executions, independently verified market data, performance results or evidence of profitability, and all chart readings and claims are ICT's retrospective interpretations rather than investment advice.
How we researched this article
BestProps used document-based research from primary firm sources, checked September 24, 2026. The complete source list, scope, limitations, and commercial-state record appear near the end of this article.
ICT opens on the weekly Dollar Index chart, refers back to a call he says he made the previous day, and works down through daily, hourly, five-minute and one-minute views before dropping to 15-second and 10-second charts for the order-flow section. He says he is pre-recording the session, that it covers the trading day of Thursday, 25 May 2023 for ES (40:35), and that a holiday weekend is coming, which he says changes the volume and means anything can happen (37:19). He also points viewers at the previous evening’s recording in the 2023 mentorship playlist.
The article below paraphrases what he says. It is written from the timestamped captions of the recording, with no independent market data, and it reports his interpretations as his.
ICT Immediate Rebalance Explained
He introduces the term on the daily Dollar Index chart at 7:26: a candle opened, traded down to a previous day’s high, and then delivered higher. He stresses that the reference high does not have to belong to the candle immediately to its left; what matters is whether delivery comes back to the boundary that would otherwise leave an unrepaired area (7:29).
He sets that against the ordinary case. If the same move had stopped short of that earlier high, he says it would have created what he calls a typical deferred inefficiency, meaning a fair value gap left to be revisited later (5:20). He describes a fair value gap as a one-candle range between two reference points that received delivery in only one direction, and names the specific category he is looking at as a sell-side imbalance with buy-side inefficiency (6:02). In the immediate-rebalance example he reads the opening retracement as reaching that reference before the expansion, so in his view there is nothing left outstanding at that location.
He rates the formation highly, telling viewers to write it in their journal and calling it one of the most powerful signatures for immediate dynamic price delivery and one of the strongest algorithmic price delivery signatures he sees (8:34). He reads the Dollar Index version as bullish for the dollar, and describes the mirror image on EUR/USD the same evening: an open, a trade up to Monday’s low, then acceleration to the downside (10:52). These are his market interpretations of charts he annotates, not measured forecasting evidence.
Immediate Rebalance Market Context
A recurring point in the recording is that the pattern alone is not enough, and he is explicit that a return to a fair value gap should not be assumed to produce a reversal. He puts narrative first: a bias, then the context and framework for a trade, and he says that without those steps in that order a trade is not high probability and the student is left lost in the charts (7:00). He also says this cannot be learned by watching a few videos, and that he expects students to take notes on what he is anticipating and to go into their charts, even if only for back-testing purposes (0:50 and 20:27).
ICT Liquidity and Institutional Order Flow
He frames movement as alternating between seeking liquidity and repricing inefficient ranges. On the daily and one-minute EUR/USD charts he marks relative equal lows as the place where sell-side liquidity sits, and relative equal highs as the opposite pool (22:09). He talks about orders resting below the relative equal lows in terms of long-term participants rather than the individual retail trader, and about buy stops sitting above relative equal highs (18:41 and 19:18). These are his descriptions of where he believes orders rest; the captions carry no order-book evidence identifying owners or sizes.
At 17:39 he combines a bearish EUR/USD objective with the New York midnight opening price. He says that when he is bullish the best long entries are below that opening price, and when he is bearish the best shorts occur at or above it, and he tells viewers to set the chart to New York local time, which he notes is UTC minus four while daylight saving is in effect (17:58). He says he is in the Power of Three (naming the midnight opening price, an order block, and a wipe-out of buy-side liquidity) (18:16). He describes the daily relative equal lows as the objective price gravitates to, and separately says that the market moving above the midnight opening price offers an opportunity for what he calls smart money (18:37). His stated objective for the EUR/USD leg is the relative equal lows and then a fair value gap outside the range he is showing, which he locates around the 1.0705 level to the 1.07 big figure (15:55).
ICT Opening Gaps and Rebalance Midpoints
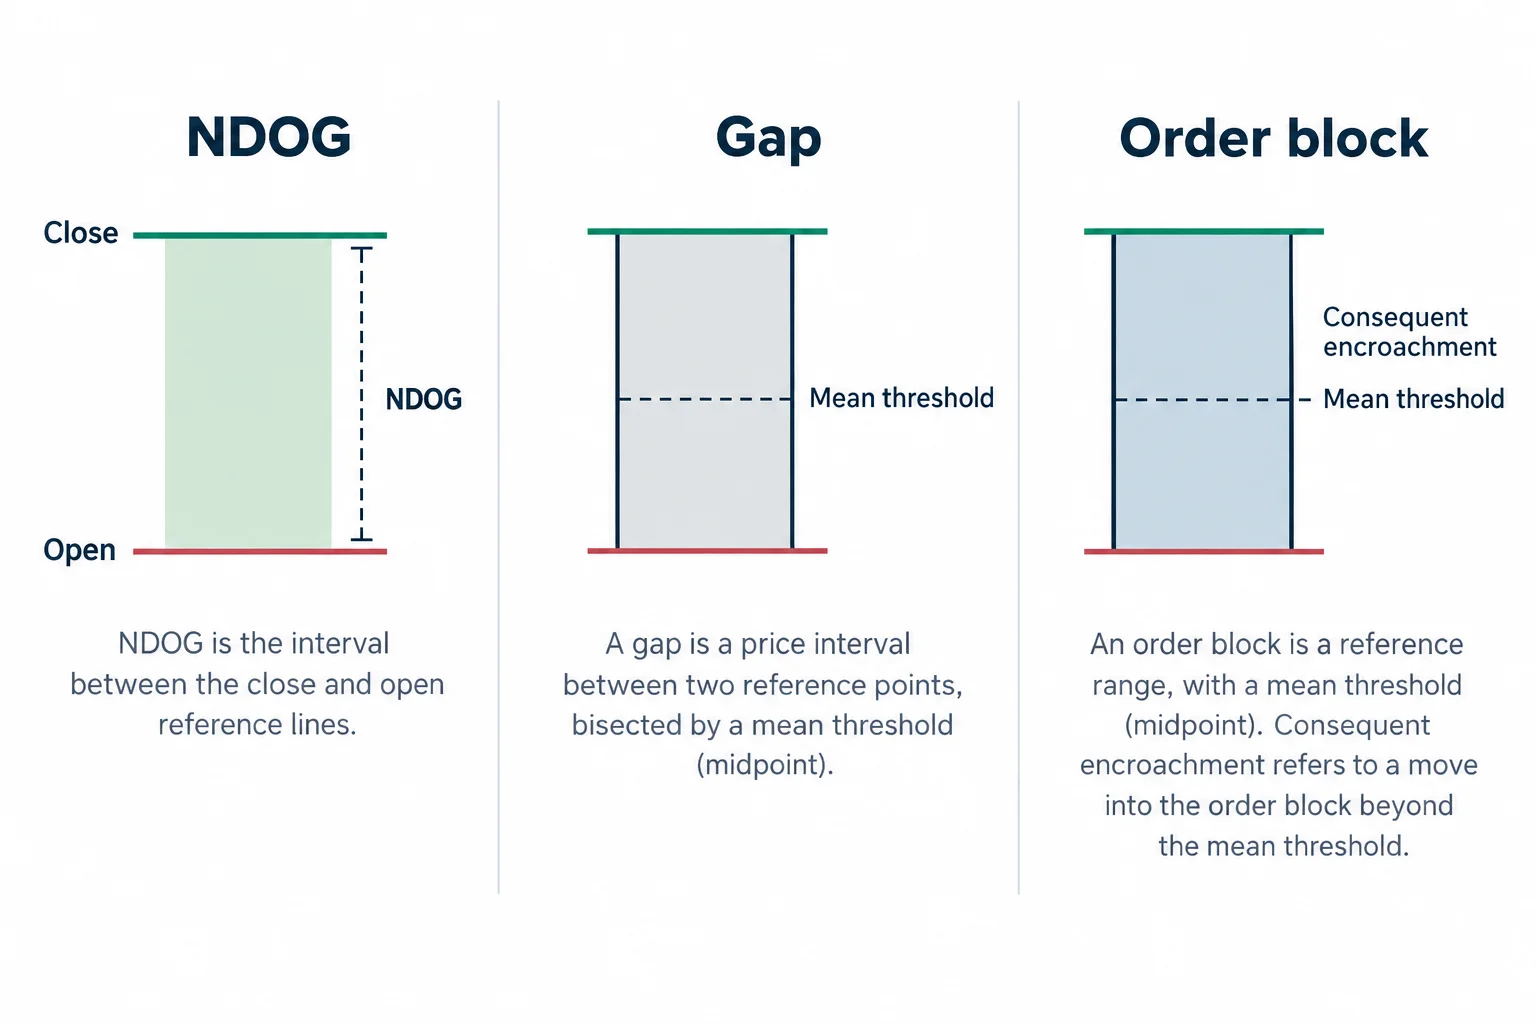
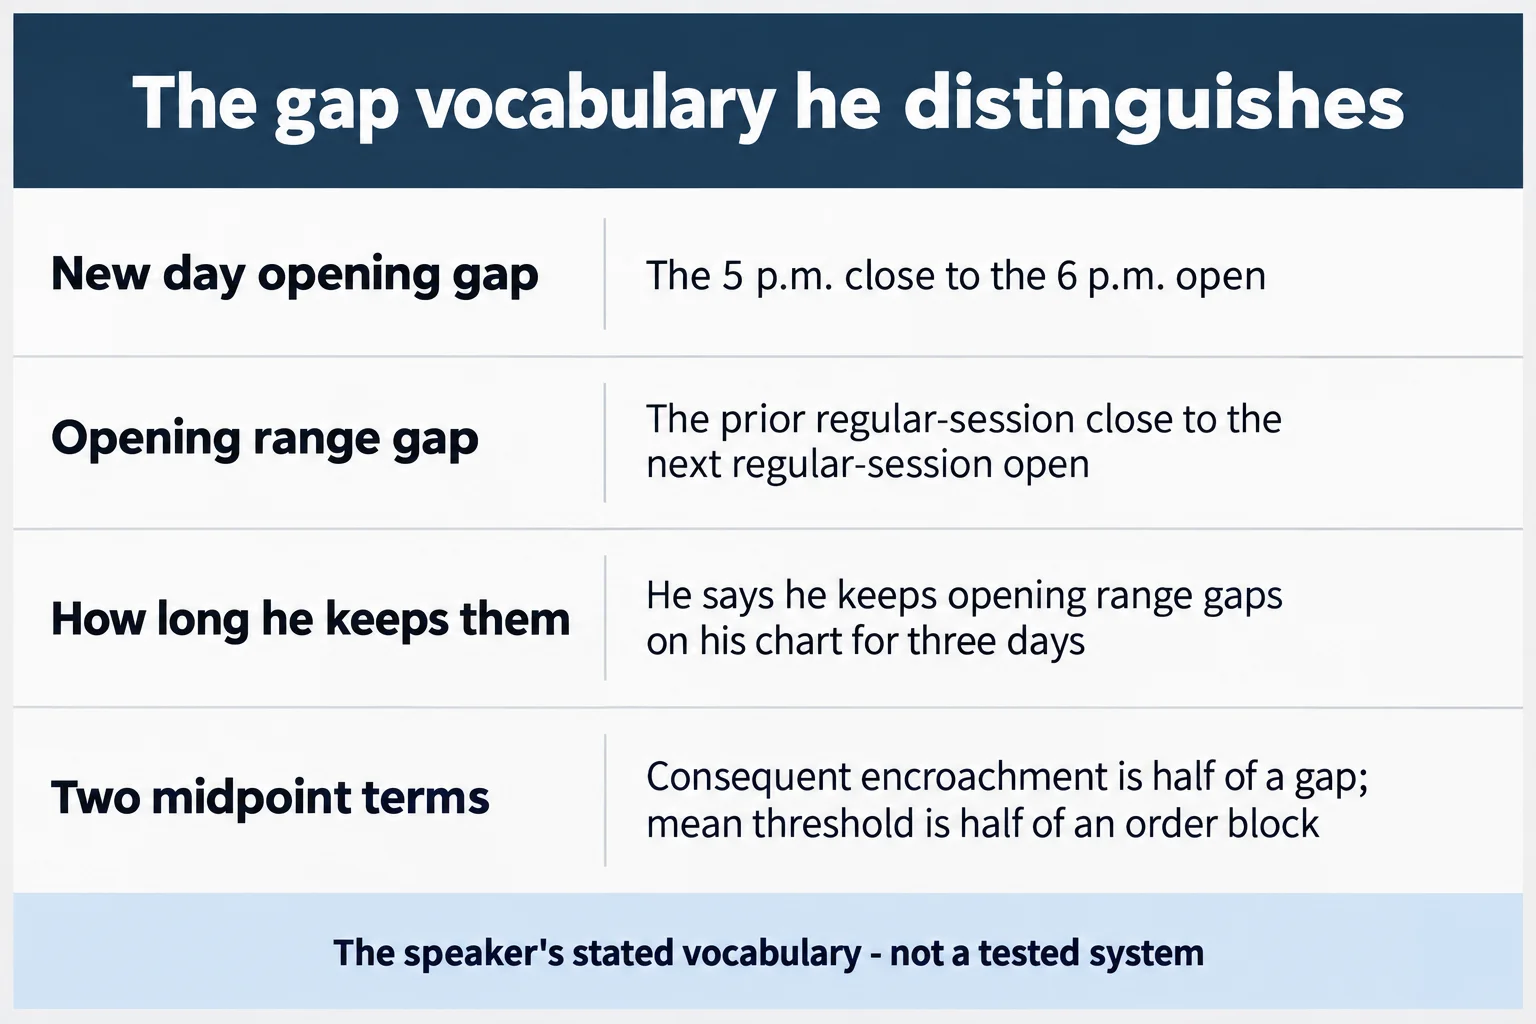
On the E-mini S&P charts he distinguishes several gaps. The new day opening gap, which he abbreviates as NDOG, is the separation between the 5 p.m. closing price and the 6 p.m. opening price, and he shows it spanning a Wednesday-to-Thursday boundary (38:00). The opening range gap is the one that appears when the futures chart is set to regular trading hours, and he says he likes to keep opening range gaps on his chart for three days, describing three days as a general rule of thumb but adding that price sometimes refers to those levels beyond three days (30:25 and 50:32).
He also draws a distinction he says is important to keep: consequent encroachment is half of any inefficiency or gap, while mean threshold is half of any order block (38:14). Earlier in the recording he defines mean threshold the same way, as the midpoint of a candle serving as an order block (1:30). On the one-minute EUR/USD chart he shows price dipping below relative equal lows, whipping back above, then trading one more time to only the midpoint of a gap, which he measures from one candle’s high to another candle’s low using the Fibonacci tool (22:29).
He uses overlapping gaps as reference zones for the sessions under review: whether price respects the boundary, trades to the midpoint, or fills the whole thing. He acknowledges that a holiday weekend changes volume and that anything can happen, and he says he is watching whether a potential trend line breaks before looking for sell-side liquidity below and into a gap that would normally be expected to fill (37:05). Later he notes that one impulsive move occurred around what he calls the 8:30 news embargo, and that a subsequent fall landed on both an order block and the low of a Tuesday-to-Wednesday opening range gap, which he reads as the two references lining up (39:58).
Institutional Order Flow on Lower Time Frames
The lecture turns granular at 44:09, where he says he is getting into order flow and warns it will need more than one viewing. He studies E-mini S&P Silver Bullet windows, first on one-minute charts and then on 15-second and 10-second charts, combining a liquidity sweep, a market-structure shift and a retracement into a fair value gap with higher-time-frame objectives. On the time-frame question he is precise about what he means: the fair value gap does not have to form between 10:00 and 11:00 New York; it can be a gap that formed earlier, and it is the trade into it that happens in that window (56:54).
He calls the result institutional order flow, and states plainly what he says it is not: he says you will not see it on a volume profile, a depth-of-market ladder, or level-two data, and that all of that can be spoofed (58:08). His closing summary reduces the framework to two destinations (price goes somewhere for stops, or because it needs to reprice and re-deliver where inefficiency exists) and he says that if it is doing neither of those things it will go sideways, where he says you cannot make money (84:42). He illustrates the entry point in relation to a dealing range, calling the ends inception and terminus, with equilibrium as the midpoint, and says a trade can be taken while price is still above equilibrium or in a short-term premium (84:16). At no point in the recording does he show or claim an execution of this example; he explicitly labels arrow markings earlier in the session as illustrative rather than executions (47:07).
ICT Mentorship Study Discipline
The most broadly applicable part of the session is the study method he recommends. He says notes and written anticipation are essential rather than optional, and that watching videos without doing the work is not how the material is learned (0:50 and 20:27). Toward the end he talks about journaling at length: annotate the charts, mark where an entry would have been, use positive self-talk, and avoid putting negative entries in the journal, because he says that conditions you to recognise these formations faster and tricks the brain into treating the study as experience (47:01). He says the back-testing and journaling step cannot be skipped, and that a student who does not want to do it should simply expect to fail (49:03).
He also says students do not need all of it. After walking through the overlapping gaps he tells viewers that this is a lot of information, that these are his tools and concepts after 30 years, and that what a student actually needs is one setup, the ones that fit their personality, which he says might be only one or two of everything he teaches (41:07). Elsewhere he says viewers do not need the lower time frames to make his material work (60:48). Anyone studying this should note the framing: a study method is not the same thing as evidence that the method works, and nothing in the recording establishes profitability.
Limits of the 2023 ICT Mentorship Recording
This is a narrated case study created and explained by its author. The captions are YouTube’s automatic ones rather than a checked transcript and they garble some terms: “consequent encroachment” appears once as “consequent encouragement”, “buy-side” is rendered as “by side” or “buy South”, “level two” once as “lighter”, and “re-deliver” appears as “re-deliver” only in the phrase where he says price must reprice and re-deliver. A few short words are also dropped mid-sentence by the captioner. Normalisations here are limited to places where the surrounding context is unambiguous. The recording contains no chart images this article can measure, and no executions: the entries shown in the order-flow section are drawn annotations in the recording, and where illustrative arrows appear he says so himself. Nothing here establishes fills, account results, why price moved, or how the framework performs over time. Levels, times and structures described above are his readings of charts he was annotating, and the reviewer of this article saw none of them. Compare the stated levels and times with properly configured historical data if you want to test them, and treat a retrospective explanation as different from tested evidence. This is educational commentary, not investment advice or a performance promise.
Watch the ICT Mentorship 2023 Recording
ICT Mentorship 2023 – Immediate Rebalance & Institutional Order Flow
The Inner Circle Trader · published 25 May 2023 · about 85 minutes. This is the primary source for this article; every timestamp link above points into it.
The video is not embedded here because the owner has disabled playback on other websites. That was checked directly on 15 September 2026: the player loads and returns “Playback on other websites has been disabled by the video owner” instead of playing.
The watch page was read on 15 September 2026: playability status OK, not unlisted and not private, 85 minutes 17 seconds long, published 25 May 2023 at 6:12 p.m. Pacific. The inventory used to schedule this article lists the same video under the date 26 May 2023, a UTC calendar day later than the publish timestamp; those are two dates for one upload rather than a contradiction. Inside the recording he reviews the session for Thursday, 25 May 2023 on ES (40:35) and says he will be back on Tuesday after the weekend. The channel is The Inner Circle Trader on YouTube, which is the first-party record of what it uploads and takes precedence over any reupload or third-party archive.
ICT Mentorship 2023 Resources
These are the sources checked for this article. The regulator and investor-education pages below are general material about system-based and leveraged retail trading; they are not assessments of ICT or of anything said in the recording, and none of them verifies a statement made here. Any ICT, smart-money or third-party indicator, script, note set or transcript circulating outside the publishing channel’s own upload page is unofficial and untested here.
- [1] ICT Mentorship 2023 – Immediate Rebalance & Institutional Order Flow, The Inner Circle Trader (primary source; watch page read 15 September 2026, 85M17S)
- [2] The Inner Circle Trader, official YouTube channel (read 15 September 2026)
- [3] CFTC, Fraud Advisory: Commodity Trading Systems Sold on the Internet (read 15 September 2026)
- [4] CFTC Learn & Protect, Forex Frauds (read 15 September 2026)
- [5] Investor.gov, Glossary: Leverage (read 15 September 2026)
This is independent educational commentary on one speaker’s framework and his review of one trading week. It is not official ICT material, it is not a tested trading system and it is not investment advice. No profit or loss figure is stated anywhere in the recording and none is reported here. Leveraged index and foreign-exchange trading involves substantial risk and is not suitable for everyone.