
Key takeaways
ICT reviews the June 2023 E-mini S&P 500 futures contract from daily through one-minute charts, carrying premium, discount, fair value gap, imbalance, breaker and wick-midpoint zones across time frames.
Read the full summary
ICT reviews the June 2023 E-mini S&P 500 futures contract from daily through one-minute charts, carrying premium, discount, fair value gap, imbalance, breaker and wick-midpoint zones across time frames. His intraday objectives were buy-side liquidity near 4034 and sell-side liquidity near 4018, with each move characterized as roughly five handles and ten handles total, while the algorithmic macro from nine fifty to ten ten marked the opening-drive high. He defines the opening range gap as the difference between the prior settlement and the next regular-hours open at nine thirty, distinguishes it from the New Week Opening Gap between Friday’s close and Sunday’s open, and recommends rebuilding annotations in TradingView rather than passively watching. A negative 1.5 Fibonacci extension projected 4027.75, which he says three final-hour candles reached exactly, and his framework favors shorts above the New York midnight open and longs below it. He also discusses optimal trade entry, institutional order flow entry, SIBI, bearish order blocks and the 2022 model, but the recording documents narrated chart interpretation rather than verified tweets, entries, fills, profits or systematic backtest statistics.
How we researched this article
BestProps used document-based research from primary firm sources, checked September 24, 2026. The complete source list, scope, limitations, and commercial-state record appear near the end of this article.
Everything below is his own narration of charts he was annotating on screen. The recording establishes what he said, not that a level, a timestamped tweet, an entry, a fill or an outcome was what he describes. The reviewer read the caption track and the public watch-page metadata; the video frames were not watched, so no chart detail is asserted here that he did not say out loud. Where the automatic captions garble one of his terms or numbers, the article says so instead of smoothing it over.
ICT Emini Recording Overview
The upload is titled “ICT Emini S&P 500 Review – March 27, 2023” and is public on the The Inner Circle Trader channel. The watch page records a publish time of 27 March 2023 at 8:04 p.m. Pacific and a duration of 1,174 seconds, and reports that embedding is not permitted, which the play test below confirmed. Because the publish time falls after 7 p.m. Pacific it is already 28 March in UTC, so an inventory that stores the upload as 28 March and the title that names 27 March are both describing the same release, not two different sessions. He opens saying good evening and that he is about to describe the points he will be looking for “tomorrow”, which fits a review recorded after the close of the session named in the title (0:15, 0:27). A supporting detail he gives later is that the opening range gap low he is tracking is the previous settlement price “on Friday”, which is consistent with a Monday session (16:46).
The instrument is stated at the top: the E-mini S&P futures contract for June 2023, on a daily chart (0:17). He is not reporting fills from the session. He is describing why certain levels were on his chart, what he says price did around them, and what he would look at next.
Watch the original lesson on YouTube
The video cannot be played inside another website. The embedded player for this recording was loaded and clicked on 15 September 2026: it reported “Video unavailable” and “Playback on other websites has been disabled by the video owner”, with no duration and no playback progress, at desktop and mobile widths. The recording’s own watch-page data agrees that embedding is unavailable, so no embed is placed here. The lesson is public and playable directly on YouTube.
Watch ICT Emini S&P 500 Review – March 27, 2023 on YouTube ↗
ICT Emini Daily and Hourly Liquidity Zones
He starts on the daily chart and marks premium and discount areas, fair value gaps, the midpoint of a long wick and what he calls consequent encroachment, his term for the midpoint level he derives from a wick (0:46). He describes one marked range as an imbalance that is essentially the equilibrium between a high and a low, and says a level can stay useful going forward even after candles have traded through it, because crossing candles by his reading means demand was not supplied there (0:53, 1:16).
On the hourly chart he points to a buy-side liquidity pool he wants to watch, a breaker, a discount fair value gap and a smaller gap he describes as a buy-side or sell-side imbalance depending on which side of it price is inefficient (1:30, 1:48). He then narrates the hourly bar sequence: price rallied, took out short-term relative equal highs, which he calls buy-side liquidity, and traded back down into the high of the fair value gap before consolidating into the close (2:18). Those are the levels he says he will carry into the next session.
ICT Emini Review From 15-Minute to One-Minute Charts
On the fifteen-minute chart he reviews relative equal highs, a move above them and a bearish breaker, and says he had called the move as a run on buy-side liquidity around 4034 live on Twitter while it was happening (2:29, 2:37). He points out that after the 9:30 open price returned into a discount wick midpoint, and that the hourly gap looks like less of an imbalance once it is viewed on a fifteen-minute chart, his stated reason for working top down (2:48, 3:12).
The instruction attached to that section is explicit: go back through the playback, screenshot his charts, and rebuild the annotations on your own charts rather than watching his screen, because it only becomes meaningful in that form (3:19).
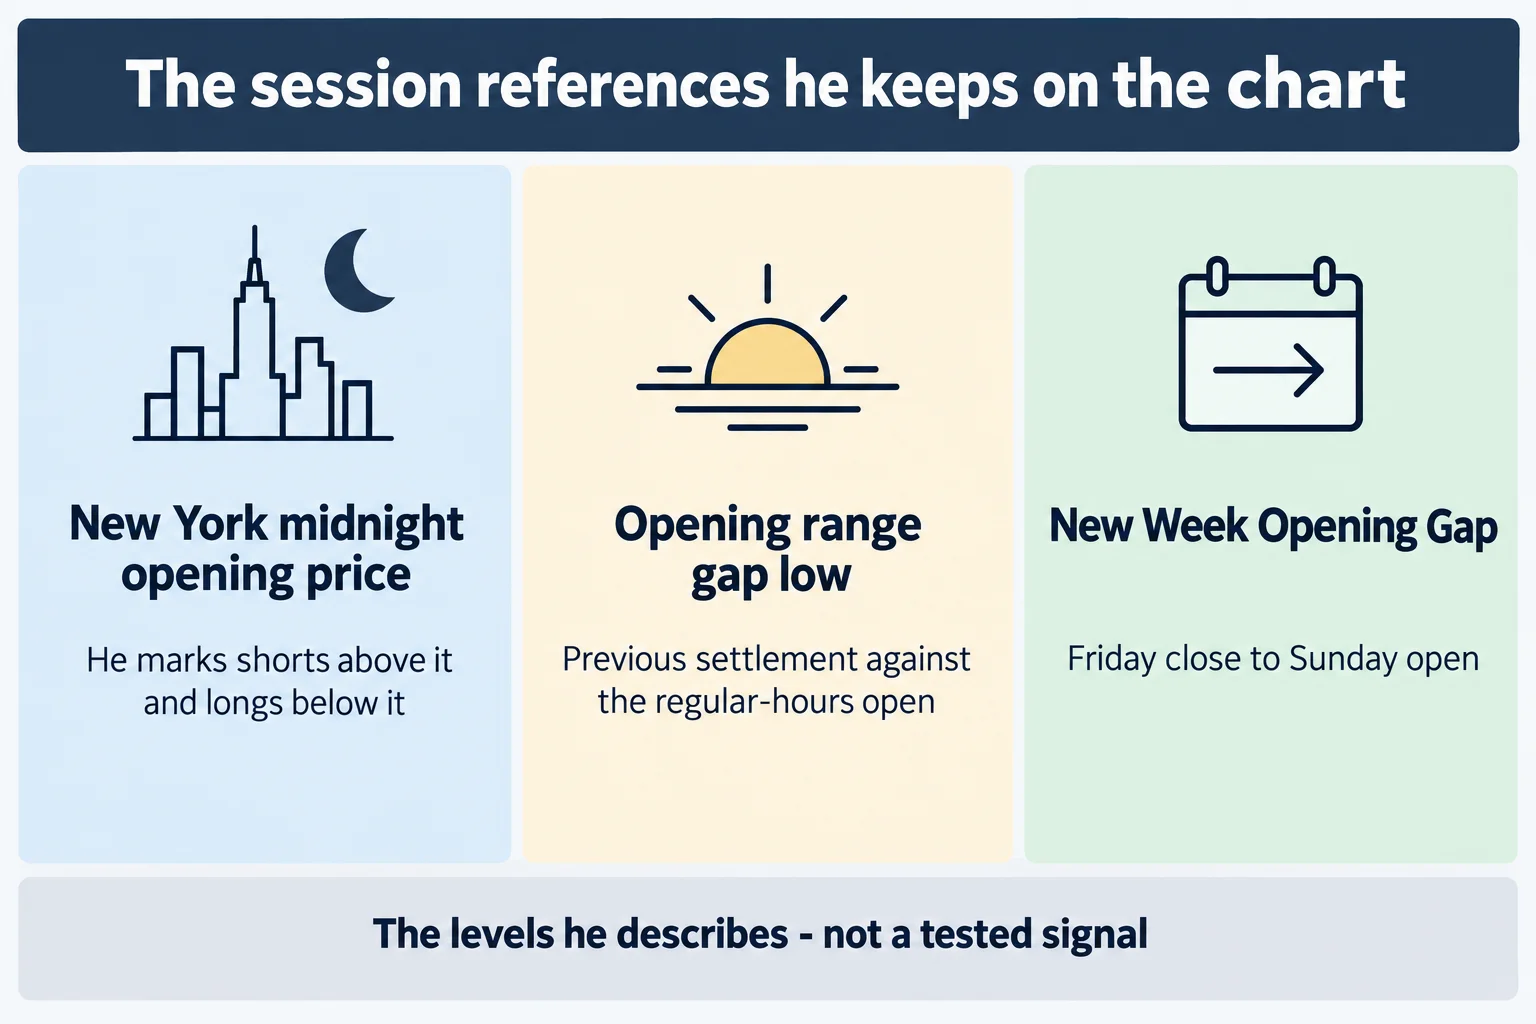
On the five-minute chart he marks the New York midnight opening price, says price ran above it toward the buy-side objective around 4034, and says he then turned his attention to sell-side liquidity around 4018 below a swing low (3:52). He describes the back-and-forth giving way, price trading back into old order flow in the form of that discount wick midpoint, and the breaker he had extended through the day turning out to matter again in the last hour (4:22, 4:45).
ICT Emini Macro Window and Five-Handle Moves
The one-minute review starts at 4:55. He says the run into the 4034 buy-side objective covered about five handles and then stopped in the macro window at 9:50, which he identifies as the high candle of that interval, continuing to 10:10 (5:29, 5:31). He describes the “algorithmic macro” he teaches as the ten minutes before the 10 o’clock hour and the ten minutes after it, and says a price swing originates in that window and runs for liquidity (9:00).
From that high he says his attention shifted to the 4018 sell-side objective, that price worked back into an older imbalance which then acted as resistance, and that the leg lower was roughly another five handles (5:49, 5:56). He totals the two legs as ten handles and says he had posted both live on Twitter as they delivered (6:57). Nothing in the captions verifies when those posts were made, and no entry, fill, size or result is stated for either leg; the handle counts are his own characterisation of the moves he was describing.
He then makes the methodological point that carries the rest of the recording: casually watching someone else’s chart work is a waste of time unless you place the levels on your own charts and cycle through the frames, from daily to hourly to fifteen-minute to five-minute to one-minute (6:28). Later in the review he returns to the same sequence while describing price coming back into an imbalance he calls an optimal trade entry, and a return into a fair value gap he labels an institutional order flow entry setup (7:10). He also sketches the current New Week Opening Gap (its high, its midpoint and its low) and says those were the references in play that day (7:59).
ICT Emini Opening Range Gap Explained
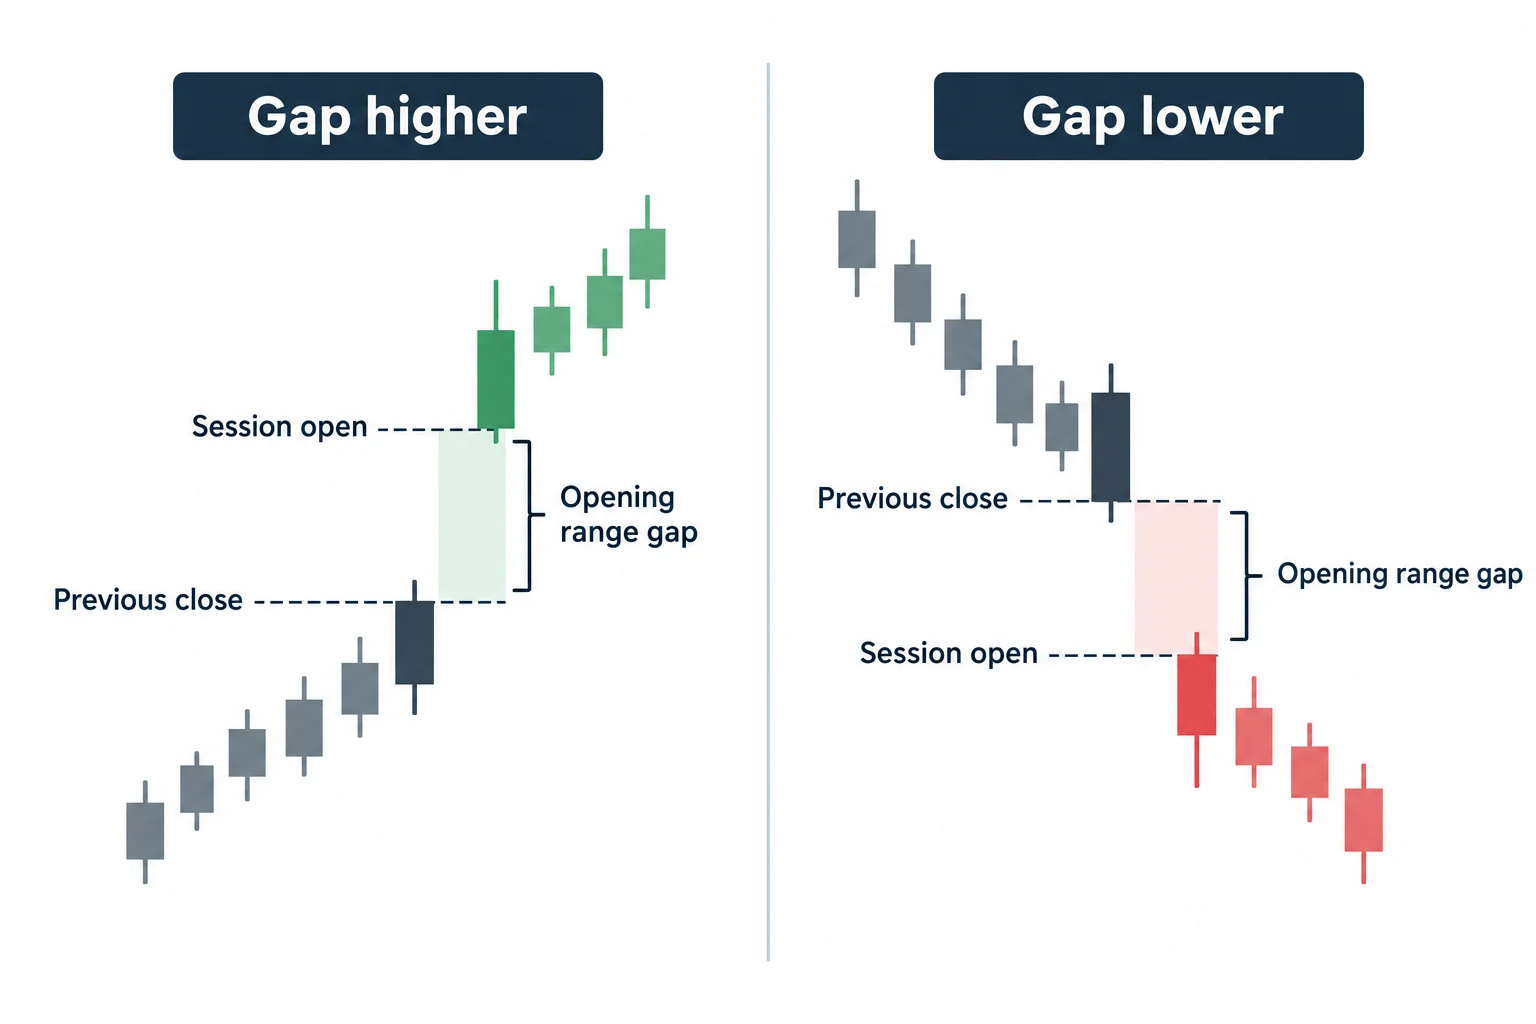
He demonstrates the opening range gap by toggling a chart between electronic trading hours and regular trading hours so the previous session close is visible, then waiting for the 9:30 opening price and reading the separation between the two (8:15, 8:30). His formal definition comes later and is worth separating from the demonstration: the opening range gap is the difference between the previous day’s settlement or close and where price opens at 9:30 the next day, and it can be a gap higher or a gap lower (11:45, 12:05).
In this example the market opened higher, so he identifies the previous day’s settlement as the lower boundary of the gap and says he expects price to look back into that range, potentially to the boundary itself or beyond it if there is another discount to reach for (12:10, 12:22, 12:31). Earlier he had also pointed out the 9:30 open as the start of the sequence in the day’s price delivery, with an initial drop followed by the run into the buy-side objective at the 9:50 candle high (8:57).
The last section of the recording applies the same reference list to the final hour: he says the opening range gap below was still the objective after price broke lower and repriced into it (16:42, 18:32, 19:18).
ICT Emini Back Testing Explained
He describes copying the link from one of his own tweets and plotting it on a TradingView chart with the right mouse button, so the tweet appears on the minute candle it was posted from, and calls that a useful way to reconstruct the logic after the fact for anyone who was at school, at work or asleep (9:37). That is his stated method, and it depends on the tweets existing; the captions do not show them.
He is explicit that his use of the word is not the same as a replay tool with a button. He says his “back testing” is the annotation itself: studying price action, working through the alternative scenarios and mapping the idea out, filling the empty space on the chart with an explanation of what each level did (10:02, 10:32). He puts market replay and what he calls a forward walk test in a separate step before live or demo trading, and says that is not what he is doing here (10:12, 10:14). In ordinary research language that describes discretionary chart review rather than a systematic test with predefined rules, a sample and reported statistics.
The most quotable passage in the recording is the one aimed at doubters. He says that when people see a rectangle on his chart they assume supply and demand, and that others call it support and resistance; his answer is that price went to the level he teaches rather than stopping at the obvious broken-support level “because the market’s booked by algorithmic price delivery, not retail logic like support and resistance” (10:55, 11:19). That is his model of how price is generated, stated as a belief; the recording offers no evidence for it beyond the charts he is annotating, and he repeats at 13:15 that “that’s the rules” and “that’s how it’s coded”.
ICT Emini 4027.75 Projection and Final Hour
He marks a swing made of a low, a lower low and a higher low, draws a Fibonacci on it, and says the negative 1.5 extension projects a swing high at 4027 and three quarters (12:37, 12:55). He reports that three candles in the final hour reached exactly that level, inside the first fair value gap he had mentioned (13:02, 14:58). The projection itself is arithmetic he performs on the chart, but whether the candles truly printed that exact tick cannot be verified from the captions, and the reviewer did not inspect the video frames.
He explains why he preferred the premium side for that projection: he says the daily chart was in consolidation, that buy-side liquidity was stacked above, and that an older swing high and an old fair value gap added to the confluence pointing at the same level, which he says was delivered to the tick three candles before price gave up (13:48, 14:32, 14:38). He also states a rule from that run: the best short positions are above the New York midnight opening price and the best long positions are below it (15:05, 15:15). That is a rule asserted inside his framework, not a general property of markets.
The final-hour walkthrough starts at 15:29. He puts the 4027.75 level next to a macro he says begins in the afternoon window he renders in the captions as “ 310”, describes the setup as premium seeking discount, and follows price down into that run’s low, which he treats as below-equilibrium (15:37, 15:40, 16:02). The clock label for that macro is one the caption track does not resolve cleanly, so it is reported as the captions render it rather than converted into a time.
He then describes a retracement into the same bearish breaker he had shown at the start of the video, swing lows being taken, and price trading back up into a candle whose high matches two earlier highs, his institutional order flow entry pattern, where the only requirement he states is that the price matches (16:18, 16:23). He says he could have been a seller there looking for a run below the relative equal lows, calls the result a nice short, and repeats the process at the 4027.75 level being hit perfectly (17:11, 17:02). These are statements of opportunity and narration of what the chart did, not documented entries, fills or results.
In the closing minutes he works through a discount wick that he says acts as an inversion level (support that becomes resistance) and a region he labels a SIBI, which he expands as sell-side delivery into a buy-side inefficiency and treats as a fair value gap (17:20, 17:27, 17:32). He tells viewers to measure it themselves from the low of a candle to the midpoint of a 50 level, says the measurement delivered to the tick, and marks the last up-close candle as a bearish order block that price traded into twice before repricing to the opening range gap below (17:46, 18:25). He frames the last setup with what he calls the 2022 model: high-to-low equilibrium as the fair value gap, with sell-side relative equal lows or the opening range gap below as the draw (19:03, 19:18).
How the ICT Emini Review Helps Traders
- Establish the higher-time-frame zones first (premium, discount, imbalances, wick midpoints) and carry them down rather than starting from the one-minute chart.
- Mark the session references he names: the New York midnight opening price, the 9:30 regular-hours open and the previous settlement that defines the opening range gap.
- Treat the time windows as part of the model. In his framing the 9:50–:10 macro is where the opening drive completed and the afternoon macro is where the final-hour move began.
- Read his “back testing” as chart annotation practice. It establishes what he says he saw in context; it is not a study with reported results.
Read as a worked example of terminology and sequencing, the recording is detailed and internally consistent. Read as evidence that the described setups produce results, it is not: it contains no verified fill, no size, no risk figure and no account data, and every level is his own reading of a chart the captions cannot show.
ICT Emini Review Transcript Notes
This article was written from the recording’s own automatic English captions, which are machine-generated and not human-checked. They misrender several of his terms and numbers: “Fairway Gap” for fair value gap, “cell side”, “South Side” and “sell sign” for sell-side, “by side” for buy-side, “Boston and efficiency or City” for a buy-side or sell-side imbalance, “console encouragement” and “consequent encouragement” for consequent encroachment, “opening range got low” and “opening range gapple up” for the opening range gap, and instrument levels run together as “ 34” and “4018”. “SIBI” appears only as the lowercase string “sibi”. Where the intended term is unambiguous from the surrounding sentences it has been normalised; the price levels he reads out are reported as the captions render them, and the afternoon macro label is left as printed rather than converted. The caption track establishes what he said; it cannot establish a chart level, a tweeted call or a fill.
ICT Emini Review Resources
These are the sources checked for this article. The regulator pages below are general investor-education and fraud-warning material about leveraged retail trading, hypothetical performance claims and commodity trading systems; they are not assessments of ICT, of this recording or of anything said in it, and none of them verifies a statement made here. Any ICT, smart-money or third-party indicator, script, note set or transcript circulating outside the publisher’s own channel is unofficial and untested here.
- [1] ICT Emini S&P 500 Review – March 27, 2023, The Inner Circle Trader (primary source; watch page read 15 September 2026: published 27 March 2023 at 8:04 p.m. Pacific, 1,174 seconds, public)
- [2] The Inner Circle Trader (official YouTube channel) (read 15 September 2026)
- [3] YouTube Help, Embed videos & playlists (read 15 September 2026; the platform documentation relevant to the disabled-embedding notice above)
- [4] CFTC Learn & Protect, Forex Frauds (read 15 September 2026; states that two out of three retail foreign exchange traders lose money each quarter)
- [5] CFTC, Fraud Advisory: Commodity Trading Systems Sold on the Internet (read 15 September 2026; cautionary material on hypothetical trading results and on systems marketed with impressive historical results)
- [6] NFA, Investor Education & Resources (read 15 September 2026)
This is independent educational commentary on one speaker’s framework and on his own account of one session’s price action. It is not official ICT material, it is not a tested trading system, it is not investment advice and it is not a claim that any result can be reproduced. Leveraged index futures trading involves substantial risk, the regulator’s published data indicates that the majority of retail foreign-exchange traders lose money over time, and past or hypothetical performance does not indicate future results.