
Key takeaways
In ICT Emini S&P 500 Review / January 03, 2023, a nine-minute review of the first trading day of 2023, the speaker says he expected a rally into the 9.45 a.m.
Read the full summary
In ICT Emini S&P 500 Review / January 03, 2023, a nine-minute review of the first trading day of 2023, the speaker says he expected a rally into the 9.45 a.m. PMI release and then a sell-off (0:12, 0:15). When price never ran above the level he had marked he says he did not force the projection, and instead waited for a change of market structure and a return into a fair value gap before selling (8:05). He walks the charts from the hourly down to the one-minute, defines the mean threshold of an order block as distinct from the consequent encroachment inside a gap (3:52, 6:13), and describes two fair value gap entries plus a third near the top of an orange gap he states at 38.60, with a partial taken and sell-side liquidity he names at 3842.50, which the captions give as “38 42 50” (7:41, 8:42). Because price had not left the daily range, he says his focus stayed on short-duration intraday work rather than an extended move (6:57). Every level and result below is what he reports in the recording; the article does not verify a fill or an outcome.
How we researched this article
BestProps used document-based research from primary firm sources, checked September 24, 2026. The complete source list, scope, limitations, and commercial-state record appear near the end of this article.
This is a review of one session, recorded as the first trading day of the year was still in progress. The speaker’s own framing is that he was watching an area rather than committing to a forecast, and the useful part of the recording is the sequence he describes between an expectation and the evidence he says he waited for before acting on it.
The Expectation Going Into the PMI Release
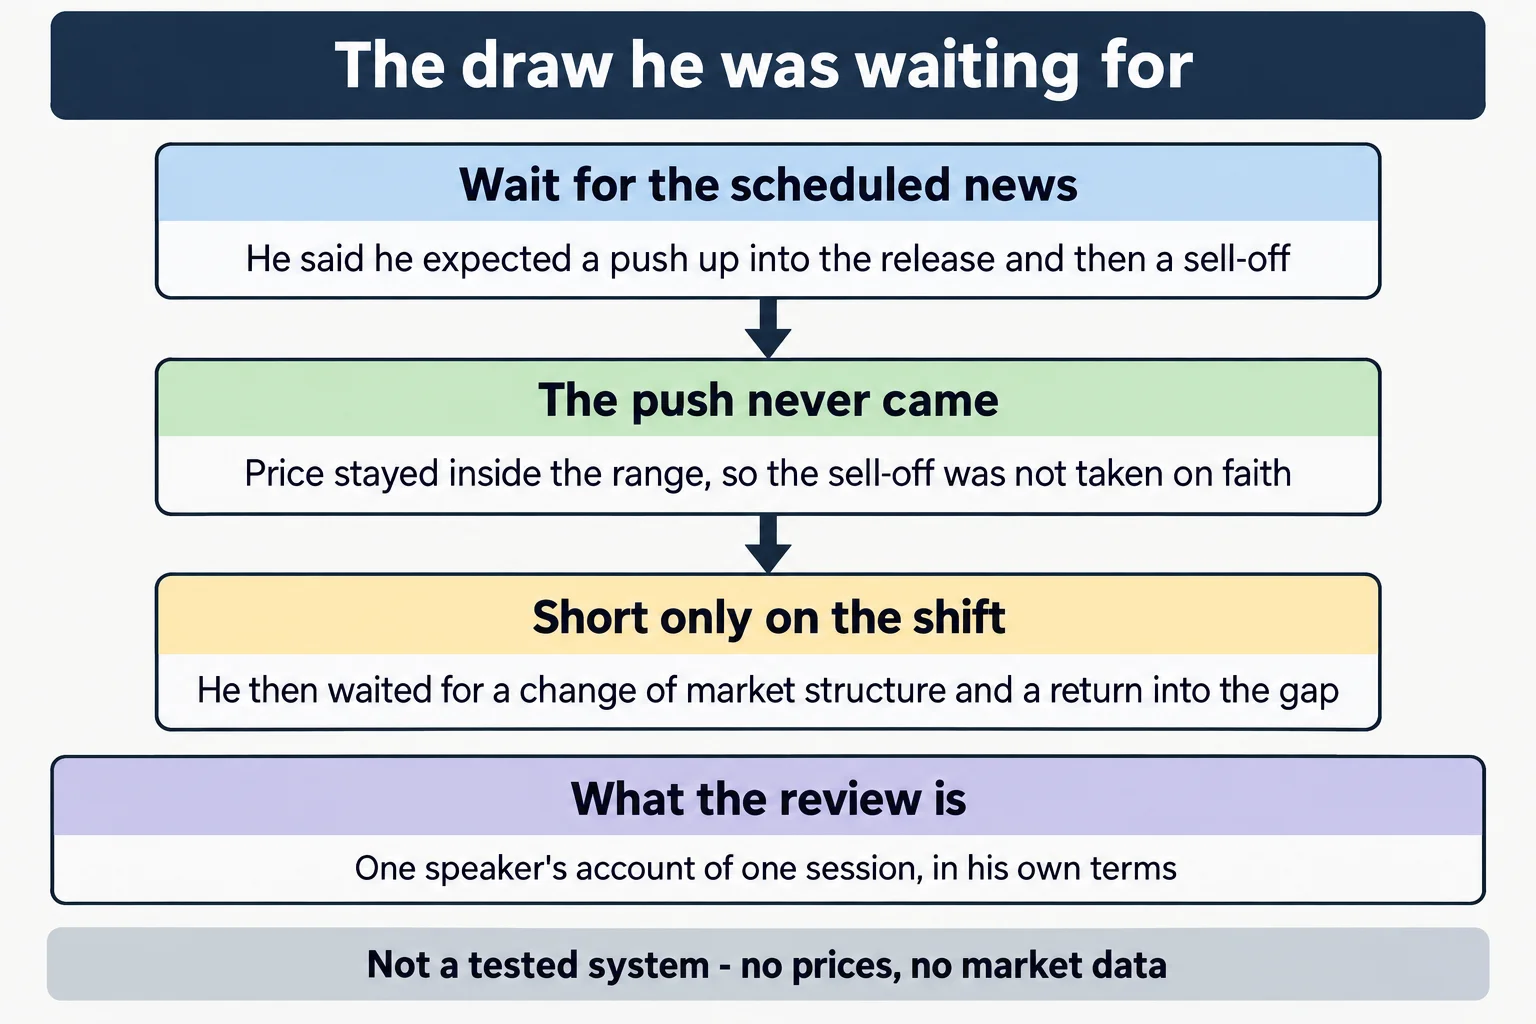
He opens by saying the market was waiting on the 9.45 a.m. PMI number, that he expected price to whip up into that release and then sell off, and that he had posted this as a scenario earlier that morning (0:12, 0:15). He stresses that he was waiting on the 9.45 release and not simply on the 9.30 open (0:25).
He then describes price as stuck inside an established range, trading below an older high he identifies as the highest one in the range from that day’s opening (0:34, 0:51). His point is conditional rather than predictive: the range could be traded from the inside, but he says that takes more patience than a directional run (1:01).
The morning’s planned rally is the part that did not happen. Later in the recording he says he had expected a run up toward 39.20 as an aggressive, deliberately deceptive move during the PMI release, and that price failed to run above the 39.05 level instead (7:48, 8:01). Those are his stated expectations and his reading of why they did not play out; the recording does not establish what actually drove price at that moment.
Walking the Time Frames From the Hourly Down
The review works down through the hourly, thirty-minute, fifteen-minute, five-minute and one-minute charts. On the hourly he notes that price had not reached a daily-chart area he had marked, describing buy-side and sell-side liquidity being taken in sequence (1:05, 1:18). Some of the automatic captions in this stretch are not reliable: the phrase he uses for the daily-chart area is rendered as “employment balance,” and a later liquidity reference comes through as “salsa liquidity” (1:15, 1:27). Neither term is standard, and this article does not guess at what was meant beyond the plain sense that he was comparing current price with a marked daily area.
On the thirty-minute chart he says he used that time frame specifically because the imbalance he cared about was clearest there, and that price failing to get above the prior high was the confirmation he was waiting for, in either direction (1:39, 1:49). He adds that because it was the first trading day of the year he was not in a hurry, since many participants want to be in something immediately.
On the fifteen-minute chart he points to a fair value gap, describes price returning into it and then repricing lower, and says that delivery carried down to a level the captions render as “30 14 and a half” (2:22, 2:24, 2:29). The same figure is repeated later in the recording in the same spoken form (6:37), but it is left quoted rather than converted to a price here: the automatic captions give it as spoken digits, and it does not sit on the same price scale as the other levels he names in the video.
On the five-minute chart he notes price trading above buy-side liquidity at what he calls a nice round number of 3900 and then breaking lower (2:37, 2:40). The one-minute chart is where he explains the entry logic in detail.
The Sequence He Describes on the One-Minute Chart
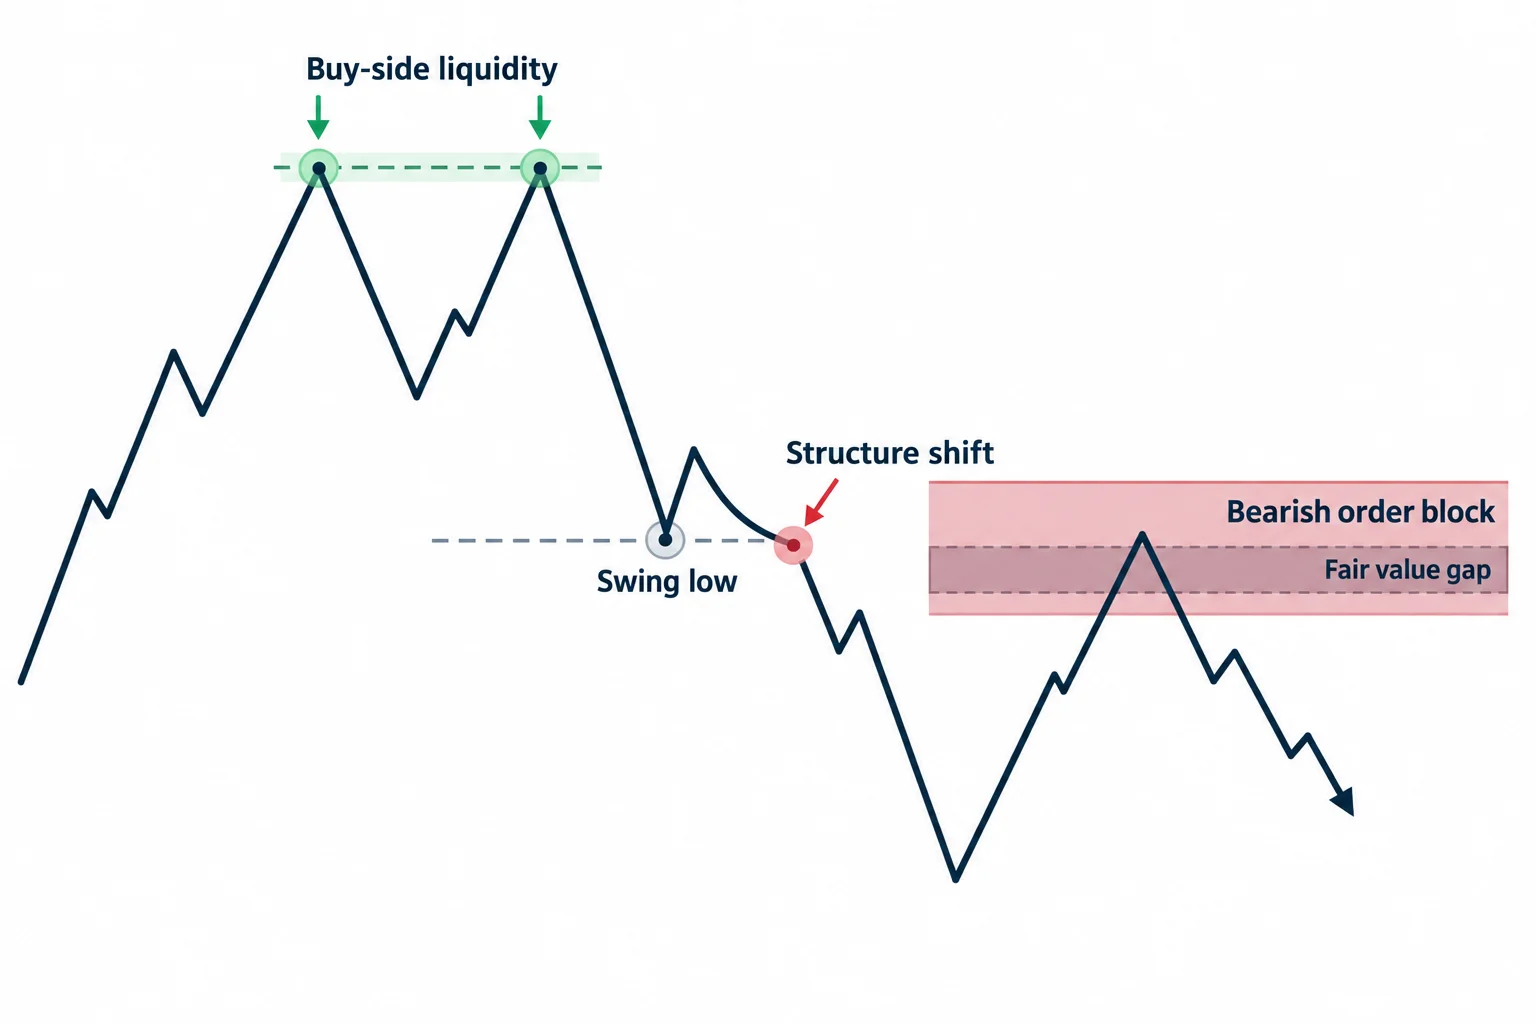
Starting around 2:48, he lays out the pattern he considered significant:
- Price ran up into where buy-side liquidity sat, then broke down and took out a swing low (2:54, 2:58).
- He picks out the swing low he prefers and says price then traded back up into an imbalance above it (3:06, 3:13).
- He says that break changed market structure on both sides, which he treats as making the setup higher quality (3:20, 3:25).
- He identifies a bearish breaker over the same area, and describes the candle bodies respecting half of the range between the high and low of the candle he is marking (3:39, 3:49).
- After price breaks back through it he reclassifies the same area as a bearish order block, with a fair value gap inside it, and says the overlap is why he wanted to be a short seller there (4:16, 4:24).
Two phrases in this section are transcription artefacts rather than terms: the captions read “institutional overflow entry drill” at one point and “institutional Oracle entry drill” shortly after, and “Breakaway got” where he appears to be describing a range left open as a breakaway gap (3:16, 4:20, 4:39). This is the speaker’s own labelling of his own annotations. It is not independently established that these labels predict price, and the recording offers no measurement of how often the pattern occurs or what it returns.
Mean Threshold and Consequent Encroachment
He gives two definitions and keeps them apart. Mean threshold is the middle of an order block (3:52). Consequent encroachment is the middle of a gap, an inefficiency or a fair value gap (6:13). He notes that the captions render part of that second definition as “by sound of balance outside efficiency or South side imbalance by sound efficiency,” and tells students to write the definition down because he will build on it later in his mentorship (6:16, 6:19, 6:26).
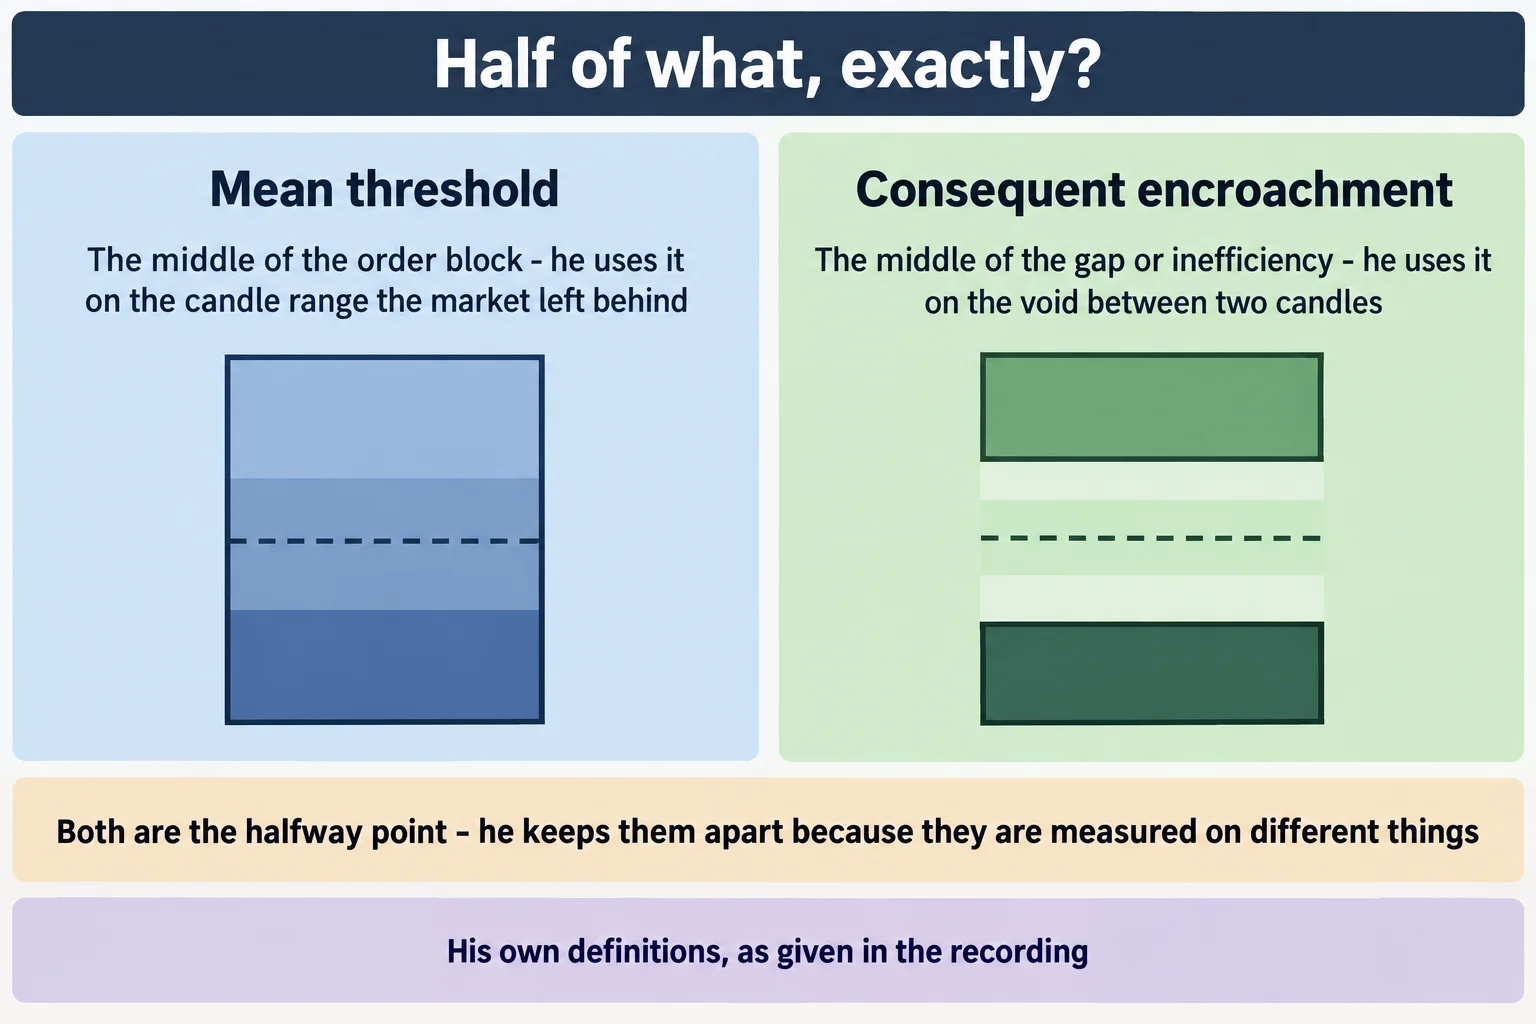
The distinction matters because both are a halfway point, and he applies them to different objects — one to the range a candle or block covers, the other to the void between candles. Later in his own summary he uses the second term for the level price retreated to before continuing lower, saying it worked inside the imbalance one more time before clearing buy-side liquidity and running down (6:04, 6:31).
Trade Management and the Levels He Names
He describes price moving lower into a fifteen-minute gap, consolidating, and then his going short again as it accelerated down into a thirty-minute fair value gap, where he says a limit order was filled after price traded below it (4:49, 4:58, 5:01). He then points out that price retraced back up to a clean return into the fifteen-minute gap and argues that no conventional support or resistance on the chart would explain that precision, while the gap he had marked does (5:04, 5:11, 5:21). That is his interpretation of the chart, not a measured result.
In his closing recap he summarises the day’s positions: two fair value gap shorts plus a third entry at the top of an orange gap he states at 38.60, looking for continuation down toward the levels he had shared (7:33, 7:41). He says he waited for the shift in market structure just below the area the captions render as “38.72 and 3 4 73”, and then a return into a fair value gap for the entry (8:05, 8:11). He adds that he took one partial, leaving two contracts on, and that he wanted price below the level the captions render as “38 42 50”, where he says sell-side liquidity sat (8:33, 8:42).
He also states the condition that would invalidate his read: he wanted price to stay below the thirty-minute gap on the chart, and says that if it traded above it he would probably want to close the trades (8:51, 8:55). He defines “heavy” as price going lower while struggling to rally, and says he would take another partial if price traded below 3842.50, with a further objective on the downside he calls low-hanging fruit (9:01, 9:07, 9:27, 9:33).
The recording ends on his interjection at 9:44 and stops there. It contains no order ticket, no statement and no closing result, so the outcome of these positions cannot be established from the source. Everything above is the speaker’s own account of what he did and why; it is not verified performance.
What He Says the Session Teaches
He is explicit that he is not a breakout trader, and that he wants to see price break out of the daily range before his interest really peaks on any sustainable move (6:57, 7:01). Until a higher-time-frame narrative is at work, he says the practical consequence is shorter-duration intraday work rather than an expectation of large moves (7:13).
The strongest practical point is about the failed projection. He had a view, it did not trigger, and he says he waited for the shift in structure and the return into a gap instead of acting on the original idea (8:05).
He also tells students to mark the levels on their own charts rather than copy his, calling that a lazy approach that will not teach them, and says the work takes effort and time (5:31, 5:41, 5:50). As a study habit that is sound — reconstructing an analysis yourself is how you find out whether you can apply the definitions consistently. It does not establish that the method is profitable or suitable for any particular trader.
Watch the original recording
The recording, embedded from YouTube. It was tested from a BestProps page origin on 15 September 2026 at desktop and mobile viewport sizes: the player loaded, returned no error and played. If it does not load here, watch it on YouTube.
The watch page was read on 15 September 2026 and rendered as a public video: title “ICT Emini S&P 500 Review / January 03, 2023”, listed at 9 minutes 45 seconds, with an upload timestamp of 3 January 2023 at 2:23 p.m. Pacific, and embeddable playback enabled. The recording speaks of the session as still in progress that morning, and he refers to what he had posted earlier the same day (0:12, 7:48), so the review was published later the same day. The scheduling inventory for this article carries 3 January 2023 as well. The channel is The Inner Circle Trader on YouTube, the first-party record of what the publisher releases.
One note on the source text. The transcript used here is YouTube’s automatic caption track, not a human-verified transcript, and it misrecognises several technical terms and numbers, the clearest being the daily-chart area rendered as “employment balance” and the “institutional … entry drill” phrases. Where a term or figure cannot be established from the captions it is either flagged inline above or left out. Nothing in this article is taken from an independent description of the session, and no chart detail is reported that the transcript does not state.
Resources
These are the sources checked for this article. The publisher’s own channel and site are the first-party record of what the speaker releases; the regulator page is general material about trading systems marketed to the public, and the video’s own description carries the standard hypothetical-performance disclaimer. None of them assesses the speaker, verifies a level or a result in the recording, or tests the framework described. Any indicator, script, note set or re-upload circulating outside the publisher’s own pages, and any indicator built on these concepts, is unofficial and untested here.
- [1] ICT Emini S&P 500 Review / January 03, 2023 — The Inner Circle Trader (primary source; watch page read 15 September 2026, 9m45s)
- [2] The Inner Circle Trader — official YouTube channel (read 15 September 2026)
- [3] The Inner Circle Trader — publisher’s own site and free library (read 15 September 2026)
- [4] CFTC — Fraud Advisory: Commodity Trading Systems Sold on the Internet (read 15 September 2026) — describes how hypothetical or simulated results are presented to the public.
This is independent educational commentary on one speaker’s own chart review. It is not official ICT material, it is not a tested trading system and it is not investment advice. The recording contains no profit or loss figure and none is reported here. Leveraged futures trading carries substantial risk.