
Key takeaways
In 2023 Mentorship Price Action Review & PM Session Reversal Model (0:11), the speaker walks through one E-mini S&P day twice: first what he says he expected on the daily chart and what actually happened, then the PM session reversal idea he presents as the lesson.
Read the full summary
In 2023 Mentorship Price Action Review & PM Session Reversal Model (0:11), the speaker walks through one E-mini S&P day twice: first what he says he expected on the daily chart and what actually happened, then the PM session reversal idea he presents as the lesson. He says he marked a daily wick midpoint at 3982.50 as consequent encroachment and a closing price at 4055.25 as a rejection block (2:06, 9:58), and that he wanted a deeper drop into sell-side liquidity before the 9:30 open than the session gave him (11:58). He states plainly that he took no trades, “absolutely nothing” (12:32), and that this outcome is acceptable to him. The reversal sequence he then teaches runs in five steps: a higher-time-frame objective is reached, a swing low breaks, an earlier fair value gap is traded through, price returns to that gap from below as what he calls an inversion level, and the draw becomes the lows formed in the noon-to-1:00 p.m. New York lunch hour (33:12, 29:17). He calls the setup a 2:00 macro and describes the whole thing as algorithmic rather than supply and demand (36:31, 37:04). Every level and every step below is his account as the captions recorded it; the source is a machine-generated caption file with no chart, order ticket or statement in it, so none of it is a verified fill or a tested result.
How we researched this article
BestProps used document-based research from primary firm sources, checked September 24, 2026. The complete source list, scope, limitations, and commercial-state record appear near the end of this article.
The clip runs about thirty-seven and a half minutes and is a review recorded after the session, not a live execution. It is the only primary source used here. The session he dissects is the Monday he calls the new week’s first trading day (3:19), and the recording references Friday’s price action before it.
What he says he expected on the daily chart
Working from the daily chart at 2:06, he lists the levels he had marked: an old high he calls a potential target, the closing price of the highest up-close green candle, which he also treated as an intraday target, and several wick midpoints that he says he splits in half and treats as objectives. He calls a wick midpoint consequent encroachment and the closing price of the candle he highlights a rejection block.
He also classifies a two-candle gap as what the captions render “sibi, sell-side imbalance buy-side inefficiency” (3:05), noting that price traded up through it and left part of it untraded on the Friday before the session being reviewed. He is explicit about method here: at 3:57 he says he does not work with zones but with specific levels, and that he cuts through candles rather than requiring a fresh zone. On the same chart he points to a projected wick midpoint of 3982.50 and calls it the level the whole morning was built around (4:15).
He then describes what he calls a PD array matrix: a lookback across roughly 20, 40 and 60 days in which he treats levels inside the most recent 20 days as the most sensitive (4:29), and lists the array types he tracks — fair value gaps, order blocks, breakers, what he calls institutional order flow entry drills, consequent encroachment, mitigation blocks, rejection blocks and old highs and lows (5:07).
He says he expected the day to open, trade down to the projected 3982.50 level, and then build a candle that ran into the swing high, with the whole range completing across the morning, a consolidation at lunch and a run into the higher level in the afternoon. He adds that the market instead did all of it before lunch, and that he had intended to return in the last hour to walk through it (6:20).
The two questions he reduces the method to
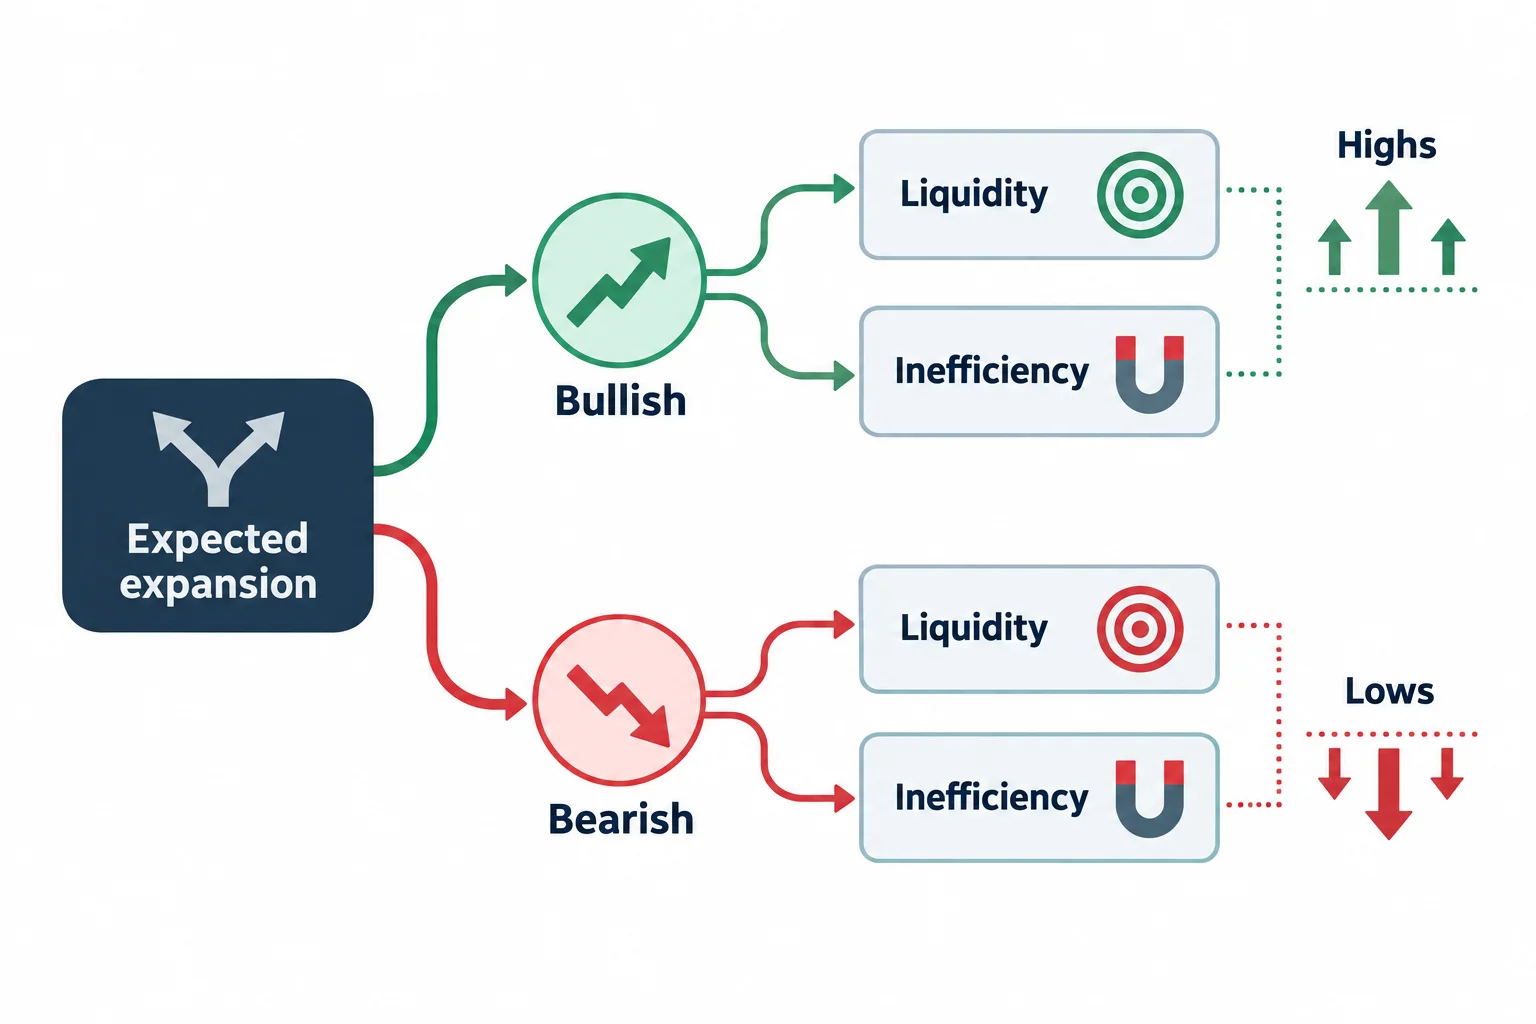
At 8:27 he compresses the framework into two decisions. First, is the expected daily expansion bullish or bearish? Second, is price reaching for liquidity or rebalancing an inefficiency? In his description, a bullish read looks above price to an old high, relative equal highs or an imbalance, while a bearish read looks below price to an old low, relative equal lows or a fair value gap. He calls the concept his “power three” and says he internalises the daily range before choosing anything on a lower time frame (8:07).
Applying it to this day: he names the rejection block at 4055.25 as the higher objective (9:58), an old low at 4035.25 as another reference (10:02), and the 3982.50 wick midpoint as the draw he wanted taken out first. He notes that the session reached 4055.25 in a single day, which he says was earlier than he had expected.
Why he says he did not trade
Moving to the hourly chart at 10:40, he describes consolidation and relative equal highs with buy-side liquidity resting above them, and says he wanted a deeper drop below the short-term low after the 9:30 open, into sell-side liquidity and a 15-minute fair value gap, before he would consider a long. What he got, in his words, was consolidation that was too sideways, with only a shallow dip below that low (11:58). He says he was unwilling to take a position and reports taking none — “absolutely nothing” (12:32).
He expands on that at 12:53, listing reasons he says he frequently does not participate: setups he is not interested in, positions he would not be able to manage, distraction at home, not feeling well, being tired, or simply wanting to watch. He frames a missed move as an ordinary outcome rather than a failure, and says he was mapping the 1-minute and 5-minute charts through the session and posting them (13:27). Whether those posts existed as and when he describes is his own claim; the links are not part of this source and are not verified here.
An earlier digression at the top of the clip is worth noting because it frames how he wants the material used. Around 1:05 he criticises what he calls armchair quarterbacking after the fact and says he mutes those accounts; at 5:56 he states he is not selling anything and does not run a Telegram, Discord or WhatsApp group. He asks viewers to check the chart links themselves rather than take his word for the annotations.
The alternative he says he would have preferred
Because the deeper drop never came, he turns to the bullish structure that did form. At 15:07 he refers to a reaccumulation phase for what he calls a market maker buy model that clears out an original consolidation, and says he had been waiting for a second-stage reaccumulation to produce an important low. He acknowledges that insisting on a preferred setup risks missing the trade and says that is acceptable to him. He also says the move had by then delivered what he calls the lion’s portion of the range (16:35).
He then walks the lower time frames in detail. He says his initial upside objective was a fair value gap at approximately 4012.25 (17:25), that the open at 9:30 was sloppy (17:37), and that the relative equal highs overhead held buy stops while sell-side liquidity sat below (17:55). He identifies a swing low inside an imbalance, after a shift in market structure and a hunt of sell-side liquidity, and calls that combination an institutional order flow entry drill (19:11). He notes price reaching 4,000 (19:32) and says the last line of defence in the area below was the order block (19:44).
The centrepiece of the bullish half is the gap he calls the red fair value gap (20:53). His stated condition is that a level which previously failed becomes an inversion level — traded through, then used from the other side (21:09). He points to the last up-close candle before a low was taken out and calls it a bullish breaker (21:28), describes the surrounding chop as a highly manipulated environment that could have turned into what he calls seek and destroy (21:37), and says he anchors to the original breaker where the stop run happened rather than to the most recent one (22:51).
The bullish walkthrough he narrates after the fact
He continues with the details he says he was watching in real time. He says he described a bullish breaker with a run to 4012 as the only structure he could see at that moment (23:48), that the dip that followed was a stop hunt on sell side (24:07), and that price then repriced all the way to the top of the breaker before returning to the red gap. His argument for why that gap should still matter is that, in his description, the algorithm remembers an imbalance that has already been traded to (25:44).
He then describes the entry pattern inside the breaker: a down-close candle whose closing price lands on the high of the gap, which he calls the order block (26:47), followed by a run toward 4,012 (26:59). He points out a fair value gap between 9:50 and 10:10 and calls the interval a macro (27:16), and repeats that while price held above 4012 he expected 4035.25 to be reached (28:05). He says he told viewers to screenshot their 1-minute chart as it delivered (28:15), that price pressed into 4051 (28:22), and that it then came back to the old daily high at 4035.25 (28:30).
On the initial objective he is specific: the range high of the 15-minute fair value gap, which he gives as 4017.50 down to 4012.25, was met and price stopped there (30:19). He calls the candle that ended the move a bull shoulder block and describes the reaction as five handles (30:32, 30:37).
The PM session reversal model he presents
He says the afternoon lesson was taught in his 2022 model the previous year, and states the rule he applies: if a retracement or reversal comes in the afternoon session, it aims for the lows formed during the lunch hour, which he places between noon and 1:00 p.m. New York time (28:39, 29:17). He notes that the hour typically contains a consolidation and that he treats the lunch-hour lows as the sell-side draw once a higher objective has been met (30:48).
His stated sequence is conditional and ordered:
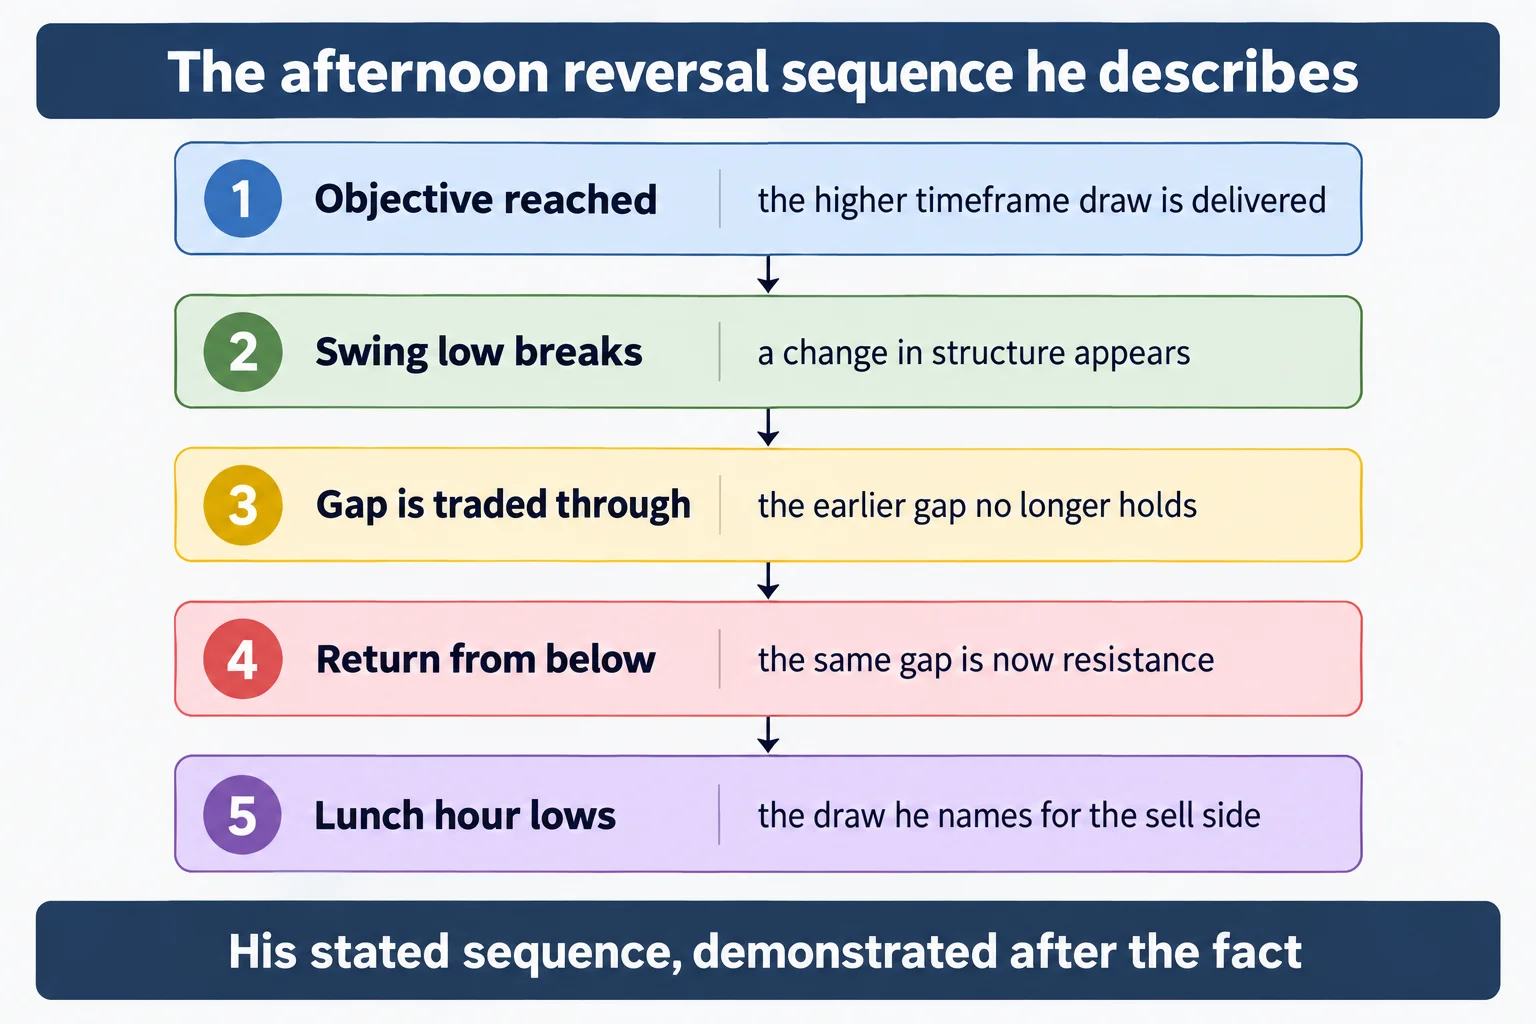
- Be bullish with a specific higher-time-frame objective above price, in this case the 4055.25 rejection block, which he also calls the old closing price on the daily chart (31:19).
- See an old high taken while price has not yet reached that objective, and look for a fair value gap sitting right at that old high (32:13, 32:20).
- After the objective is reached, wait for a swing low to break, which he calls a change in structure and the potential reversal (33:12).
- Expect the gap to be traded through, then a return to it from below; that return is the selling opportunity, which he calls the next sell (33:53, 36:09).
- Place the stop above the high of that gap, and treat the lunch-hour lows as the downside draw (33:56).
He calls the breakdown a market maker sell model reaching aggressively for sell stops (33:36), and frames the whole pattern as one of several “macros” that he says occur at specific times of day. He labels this instance the 2:00 macro (36:31) and restates the inversion idea at the end: an imbalance that is traded through becomes an inversion level, support before and resistance after (36:40).
On timing details he adds that he took the review down to a 15-second chart looking for 4038 liquidity (34:32, 34:39) and then back to the 4035.25 level (34:52). He describes placing a limit order one tick below a candle’s low and treating the opening price of a candle as the order block (35:32), repeats the five-handle framing (35:52), and says to look for a shift in market structure before taking the next sell (35:56).
What he says about hindsight, and what the recording can show
He anticipates the objection directly at 34:19, saying some viewers will think there is no way it was not hindsight, and responding that he had the level mapped before the reversal. At the close he says the framework is not supply and demand and not classical support and resistance but algorithmic, and that it will not be found in other books (37:04, 37:13).
That claim is his own and the source cannot support it. What the recording is, on inspection, is a retrospective walkthrough: the narration was recorded after the session, the captions show him moving between daily, hourly, 15-minute, 5-minute, 1-minute and 15-second charts, and the document contains none of those charts. A reviewer reading the caption file can follow what he says he saw and where he says he had marked it, but cannot check a single candle, gap boundary or level against the screen. The timestamped posts he refers to are not in the source either, so his account of publishing levels in advance rests on his word rather than on evidence gathered here.
The transferable part of the lesson is procedural rather than predictive. He fixes the directional question first, names the draw, writes down the behaviour that would let him participate, and then declines to trade when that behaviour does not appear — here, a deeper drop below the short-term low after the open. Read that way, the clip is a worked example of pre-committing to conditions. It is not evidence that the named arrays predict anything, that the afternoon reversal repeated, or that the levels he cites would have been tradeable at the prices he mentions. Machine-generated captions also mishear trading terms and numbers routinely, and the ones here include the spoken “40 55 and a quarter” style of reading prices, which is why every figure above is reported as he said it rather than asserted as fact.
Watch the original recording
2023 Mentorship Price Action Review & PM Session Reversal Model
The Inner Circle Trader · published 23 January 2023 · about 37½ minutes. This is the primary source for this article; every timestamp link above points into it.
The video is not embedded here because the owner has disabled playback on other websites. That was checked directly on 15 September 2026 from a BestProps page origin: the embedded player loads and returns “Playback on other websites has been disabled by the video owner” instead of playing, so no empty player is left on this page.
The watch page was read on 15 September 2026 and rendered as a public video: title “2023 Mentorship Price Action Review & PM Session Reversal Model”, 2249 seconds, playability status OK, published 23 January 2023 at 5:50 p.m. Pacific by The Inner Circle Trader. The scheduling inventory used for this article lists the same upload under 24 January 2023, which is the UTC calendar day of that evening publication rather than a competing date — the session he reviews is the Monday he names in the recording, the day of publication. The channel page is the first-party record of what is published there.
Resources
These are the sources checked for this article. The regulator and investor-education pages are general material about futures and about trading systems sold to the public; neither assesses the speaker, verifies any level quoted above, or endorses anything said in the recording. Any ICT, smart-money or third-party indicator, script, note set, transcript pack, chart annotation or re-upload circulating outside the publishing channel’s own page is unofficial and untested here.
- [1] 2023 Mentorship Price Action Review & PM Session Reversal Model — The Inner Circle Trader (primary source; watch page read 15 September 2026, 2249 seconds)
- [2] The Inner Circle Trader — official YouTube channel (read 15 September 2026)
- [3] Investor.gov — Glossary: Futures (read 15 September 2026)
- [4] CFTC — Fraud Advisory: Commodity Trading Systems Sold on the Internet (read 15 September 2026)
This is independent educational commentary on one speaker’s framework and his retrospective review of one session. It is not official ICT material, it is not a tested trading system and it is not investment advice. Leveraged futures trading can produce rapid losses. The recording contains no profit or loss figure and none is reported here.