
Key takeaways
In ICT 2023 Mentorship Analysis \ January 25, 2023, ICT runs a 36-minute cross-market review of the dollar index, EUR/USD, GBP/USD, Nasdaq futures and the E-mini S&P 500, and the thread running through it is sequencing rather than any single pattern: fix the daily and hourly reference ranges first, state a direction together with the…
Read the full summary
In ICT 2023 Mentorship Analysis \ January 25, 2023, ICT runs a 36-minute cross-market review of the dollar index, EUR/USD, GBP/USD, Nasdaq futures and the E-mini S&P 500, and the thread running through it is sequencing rather than any single pattern: fix the daily and hourly reference ranges first, state a direction together with the level that would invalidate it, and only then read the lower-time-frame reaction (0:56, 4:00, 9:48). The teaching point he spends the most time on is terminological: he separates consequent encroachment, which he defines as the midpoint of a gap or of a wick range, from mean threshold, which he calls the midpoint of an order block, and says his order-block theory and his gap theory are two distinct bodies of work (4:26). He also defines mitigation as something a trader does with an offside position, not something a candle or an order block does (12:13). Everything below is his own narration of charts he was annotating and of positions he says he took; nothing in the recording verifies a chart, a fill or a result.
How we researched this article
BestProps used document-based research from primary firm sources, checked September 24, 2026. The complete source list, scope, limitations, and commercial-state record appear near the end of this article.
The reviewer read the automatic caption track and the public watch-page metadata. The video frames were not watched, so no chart detail is asserted here that he did not say out loud, and caption errors in his terms and numbers are reported rather than smoothed over.
What the recording is
The recording is public on the The Inner Circle Trader channel, titled “ICT 2023 Mentorship Analysis \ January 25, 2023”, and the watch page records a publish time of 25 January 2023 at 5:23 p.m. Pacific with a duration of 2,176 seconds. Because that timestamp is already 26 January in UTC, the inventory date of 26 January and the 25 January date in the title describe the same release rather than two different sessions. He opens with “good afternoon” and says this will probably be his only review that week because of personal matters at home (0:15, 0:19). He closes by saying he is shutting the shop early, that Thursday trading runs into Friday, that he may post a short vignette if he records something, and otherwise will talk on what he calls a shotgun Saturday on Twitter (35:23, 36:06). The session he is reviewing is the 25 January trading day, and he refers back to the previous evening’s move on the 24th (8:53).
Watch the original lesson on YouTube
The video cannot be played inside another website. The embedded player for this recording was loaded and clicked on 15 September 2026 from a bestprops.com page: it reported “Video unavailable” and “Playback on other websites has been disabled by the video owner”, with no duration and no playback progress, at desktop and mobile widths. The recording’s own watch-page data agrees that embedding is unavailable, so no embed is placed here. The lesson is public and playable directly on YouTube.
Watch ICT 2023 Mentorship Analysis — January 25, 2023 on YouTube ↗
The dollar index and the two currency pairs
He starts on the daily dollar index chart, says he had been looking for lower prices, and points to a sell-side liquidity pool below a fair value gap’s consequent encroachment that he describes as still unresolved because price had been reluctant to go below the low (0:56, 1:03). He says he suspects a large candle down through that low, possibly digging into what he calls the 101 big figure, if the decline is sustained, and that this would allow for upside in cable and other currencies (1:19, 1:27). That is a directional expectation with a level attached, not a forecast with a deadline.
On the EUR/USD daily chart he says buy-side liquidity had already been taken, that the next draw is the buy-side imbalance he calls a sell-side imbalance formed by a down-close candle, and then he states the condition that would change his mind: a trade below the mean threshold — the midpoint — of that down-close candle would send him looking at a breaker as a short-term return to equilibrium instead (1:48, 2:19). He is explicit that he is not trading forex and is covering the pairs for viewers studying them (3:10). On GBP/USD he says he is bullish on the pair unless the low he points to is taken out, and he names a remaining imbalance and a big-figure level below it, adding that on an animated upside move there would be a pool resting higher (3:22, 3:35, 3:48).
Nasdaq: two midpoint terms, and the levels he names
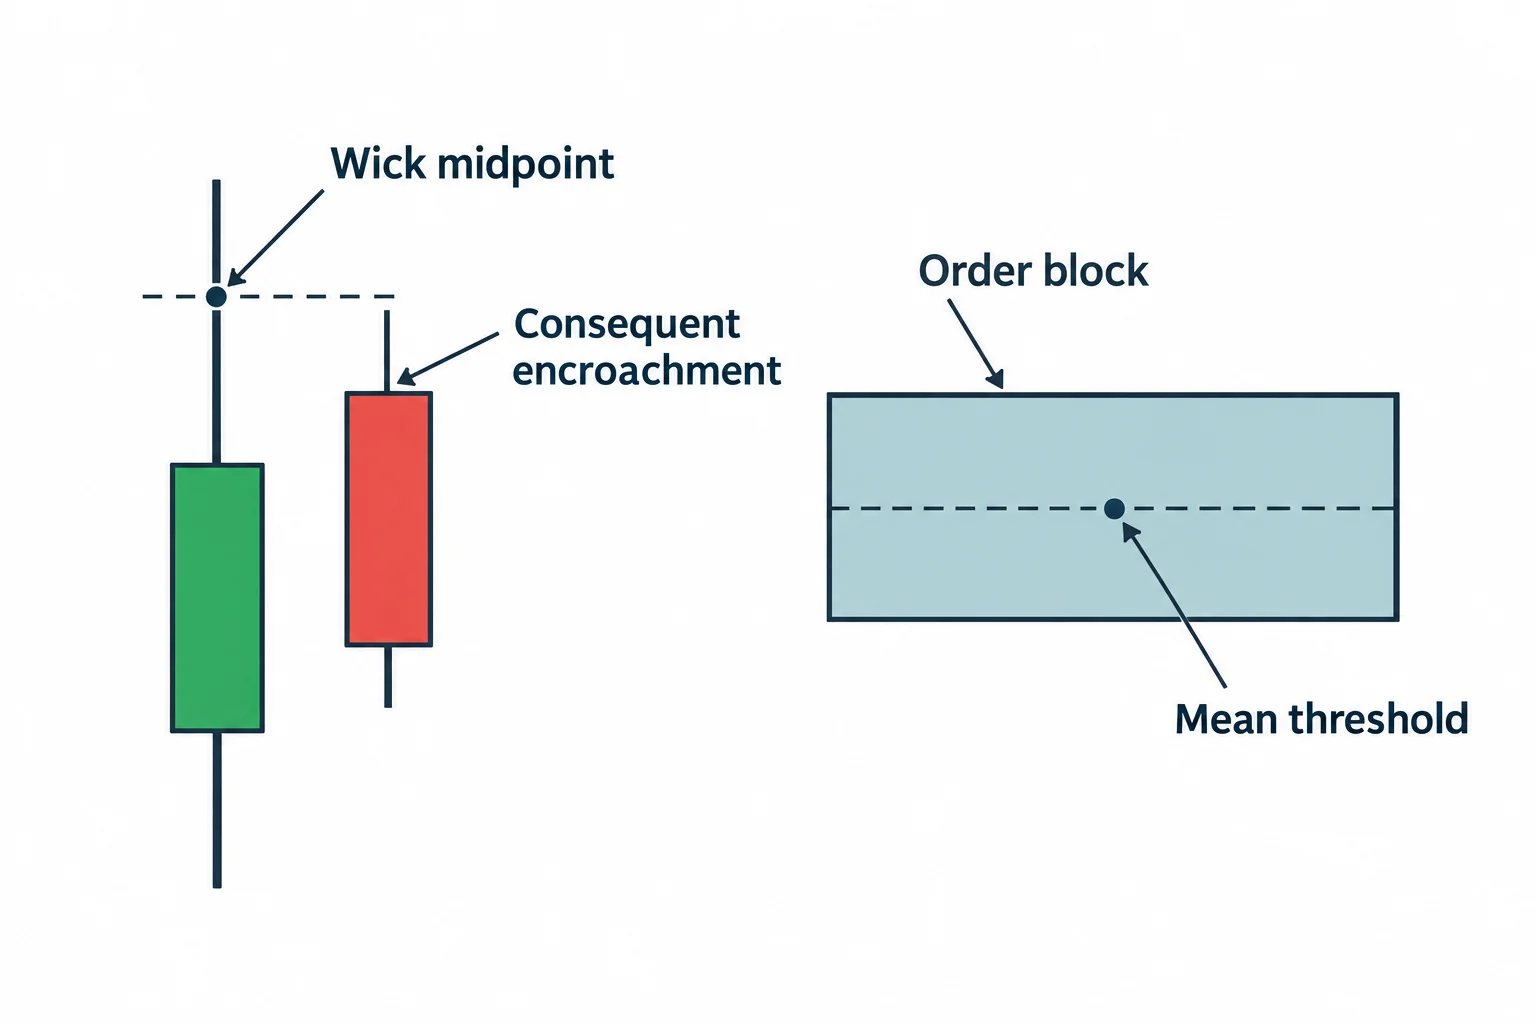
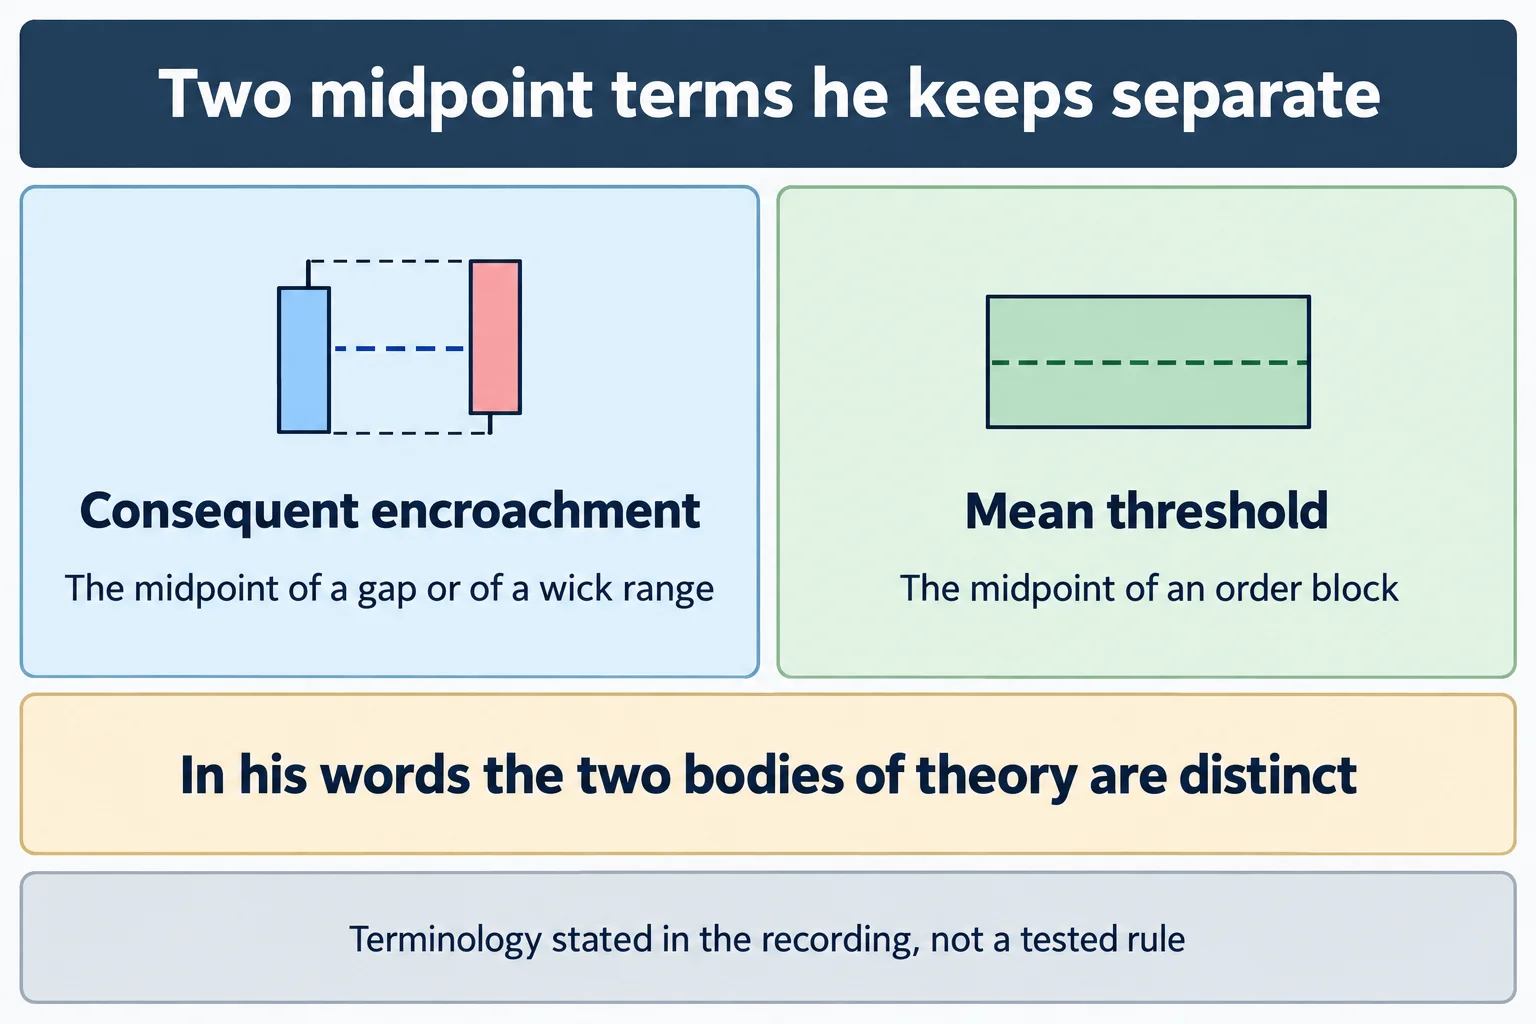
The Nasdaq section starts on the daily chart, where he calls an old high “a key level” and then goes to the definitional passage (4:00, 4:06). He says a wick is treated by the algorithm as a gap, so a wick can be traded to its consequent encroachment, which is the midpoint of the gap, and he tells viewers not to confuse that with a mean threshold, the middle or 50 level of an order block (4:26). His summary of that distinction is direct: order-block theory and gap theory are similar in some ways and very different in others (4:37).
He then marks two down-close candles as a bullish order block, identifies the imbalance between one candle’s high and another’s low as a buy-side imbalance and sell-side inefficiency, and notes that price traded down into both the imbalance and the order block’s opening price-to-high range — the two levels he asks viewers to be mindful of (4:54, 5:02, 5:13). His stated expectation is a move up into the level he reads out as “12 149 even” tomorrow and into Friday (5:37). The Nasdaq levels and the ES levels in this recording are read out as space-separated digit strings — “12 339”, “12 149”, “41 17 and three quarters”, “40 38.75” — and they are reproduced here exactly as the captions render them, without reconstructing thousands separators.
On the hourly chart he points to relative equal lows and connects the daily imbalance to the order block’s high and open, then narrates the sequence: price ran up, took out the short-term high, broke lower, formed a down-close candle he calls a bearish breaker, came back and bumped it, and sold off to take sell-side liquidity, leaving two imbalances he says he will examine more closely (6:51, 7:26).
On the fifteen-minute chart he marks a fair value gap that price traded down into and then treated as support, and then says something revealing about his own process: the pattern looks like a three-drive shape and he does not trust it, and he would rather see the market press higher, while adding that he is comfortable being wrong (8:02). He also describes the range as a balanced price range that price needs to get through before the daily objectives are in play, and says that without that he expects chop rather than a dramatic sell-off — partly because the previous evening’s move on the 24th had already taken out a large part of the range (8:20, 8:53).
The two-minute chart and the structure-shift claim
He drops to a two-minute chart and says he is doing it to save time, because it holds the details a viewer would have found by working down through the frames themselves (9:48). The sequence he reads out is: relative equal highs, a break of an order block and a trade back to it, a sell-off into the imbalance and into the lower end of a daily order block, and then a rally through the short-term high which he labels a shift in market structure (10:35, 10:55). Price then trades into the consequent encroachment between a candle’s low and the next candle’s high — midpoint of that range — and he marks a bullish breaker built from an up-close candle rather than a down-close one (11:01, 11:25).
The mitigation passage is the part he flags himself as commonly misused. He says that when price rallies back up into the last up-close candle and trades above it, what is happening is mitigation — and that candles and order blocks are not mitigating anything, because mitigation is the action of an offside trader reducing or removing a position while price allows it (11:51, 12:13, 12:24). He follows it with the reason a level can be skipped: the mitigation block leaves part of the imbalance open, which he says he expects to act as what he calls an institutional order flow entry — a partial entry into a fair value gap before price resumes (12:47).
He also explains why he picks one candle out of a run of down-close candles as the order block rather than treating them all as interchangeable: those candles are going against a bullish order flow, so he goes back to the original high candle and extends it forward, and where a candle’s body sits lower than another’s he is not interested in it (14:09). His closing-of-the-afternoon remark is that the macro he watches in the last hour runs from three o’clock to four o’clock (14:55).
The E-mini S&P section and the upper-half rule
He moves to the ES daily chart and marks two wick consequent encroachments, reads one as “41 17 and three quarters” and the other as 4072.75, and says that he deliberately left the high off the chart so viewers could see the distinction between the levels (15:11, 15:20). He says accumulation began from the original fair value gap, that most traders would have expected a sell-off, and that he had walked through the same read in what he calls live tweets during the day (15:32, 15:47). Those tweets are not shown in the captions and are not verified here.
He then defines an inside day — a high lower than the previous day’s and a low higher than it — and says that scenario is what precedes a large range day (16:22). He notes price came back into a buy-side imbalance and sell-side inefficiency formed by a green candle and framed by one candle’s high and the next candle’s low, and describes the drop into that consequent encroachment as algorithmic before price repriced higher (16:45, 16:52).
The rule he attaches to that is the most substantive teaching in the ES section. On a large daily imbalance he says that when he is bullish he wants most of the reactions in the upper portion — the premium level of the imbalance — and that once price trades back into that upper half, premium becomes discount by inversion (17:56, 18:05). From there he splits the daily imbalance: the imbalances in the upper half, above consequent encroachment, he wants to see filled, and he says it is even stronger if they do not fill; the ones in the lower half are better left open, and if price comes down and fills them the scenario is less bullish and he expects the algorithm to chop or consolidate longer (18:38, 19:19). He then names a pink area to keep an eye on, a wick consequent encroachment as the next objective at 4043.25, and a rejection block at 4038.75 that he says was traded to that day (20:29, 20:35).
He is careful to frame all of this as conditional rather than mechanical. He says that you cannot look at down-close candles and assume they are order blocks, or at any candle that resembles a fair value gap and assume there is a trade, because there has to be a narrative wrapped around it and the answers depend on what is in the price action on that day of the week and at that time of day (21:33, 25:40, 26:20). He also says he is not going to teach every possible scenario because that would take years, and that some imbalances are meant to stay open and some are meant to be filled (26:00).
The intraday reversal, the Judas swing and the unfilled limit
On the one-minute chart he describes a drop out of the fifteen-minute fair value gap, a trade back up into it, and what he calls a Judas swing: buy-side liquidity taken first, price rallying into the level in a way that, in his words, had everybody thinking it was going to rip higher, followed by the sell-off (28:46, 28:54). He says he watched several live streamers get animated hoping for the higher move and that the more they did, the more confident he felt about the sell-off, and that he sold, built a larger position higher, and then went short again lower while calling it on his phone (29:10, 29:30).
He then states a Fibonacci-extension target the captions render as “39 62 and a half” and says his limit exit was placed at “39 62.75” and was not filled because the market did not go that low, before rallying instead (29:40, 29:48, 29:53). Those are self-reported positions and an unfilled order from a recording; the captions and the unseen charts cannot verify an entry, an exit, a size or a result, and the numbers are reproduced as the captions render them rather than converted.
The methodological claim he defends hardest follows. He marks a swing high and says price rallied through it as a shift in market structure, and then insists, against what he says people keep repeating, that a bullish shift does not require a close above the short-term high, and a bearish shift does not require a close below the swing low, and that he never said it did (30:10, 30:38). He points back to the 2022 model material for that definition. This is a definitional argument about his own framework, and the recording offers his assertion rather than external corroboration.
He also notes that the level he identified as the end of the bullish sentiment, which the captions render as “39.77 and three quarters”, would flip him toward thinking about the bearish side being finished instead (27:58). As with the other Nasdaq values, the caption track renders several of these in the three- and four-digit form while the daily levels he names are five-digit, and no reconstruction is attempted here.
The homework, and how he says he was watching
He refers to a task he set viewers — find two five-handle price runs before noon — says he knows some could not get two, and offers one himself: a one-minute candle whose range he extends forward, and buy-side liquidity he reads out as “39.82”, which he says would offer five handles easily (31:40, 31:55, 32:07). His own caveat about the exercise is worth keeping: he says he was walking around watching the price action on his phone, and that a phone screen and his eyesight limit how much of it he could actually see (32:13, 32:25). He also says he was not supposed to be on Twitter that day and describes posting commentary anyway (23:22, 23:40).
The final section returns to the last-hour macro: he says the macro came in when expected, price rallied, took out the buy side, and hit the 4038.75 level, which he tells viewers to trace back to the beginning of the ES discussion to see where it was derived (34:40, 34:58, 35:06).
The instruction he repeats throughout is about practice rather than about setups: go into your own charts and look for the things he is annotating on his, study price action, and treat watching his screen as insufficient (33:50).
What this review is useful for
- Keep his two midpoint terms apart: consequent encroachment is the midpoint of a gap or wick range; mean threshold is the midpoint of an order block.
- State a direction together with the level that would invalidate it — the mean threshold of a down-close candle on EUR/USD, the low on GBP/USD — rather than a forecast without a break condition.
- Read mitigation as his term for what an offside trader does with a position, not as something a candle does.
- Treat the upper-half/lower-half rule for a large daily imbalance as his stated preference, not a tested property of markets.
Read as a worked example of sequencing and vocabulary across five instruments, the recording is dense and internally consistent. Read as evidence that the framework produces results, it is not: it contains no verified chart, no verified fill and no account data, and the position commentary in it is his own recollection from part way through a session he says he was watching on a phone.
On the transcript used here
This article was written from the recording’s own automatic English captions, which are machine-generated and not human-checked. They misrender several of his terms and numbers: “Boston liquidity” and “by side” for buy-side, “cell side” and “south side” for sell-side, “by side and balanced cell signing efficiency” and “by side of balance outside and efficiency” for the buy-side imbalance and sell-side inefficiency, “consequent encouragement” and “consequent encrosion” for consequent encroachment, “Fairway Gap” for fair value gap, and levels run together as space-separated digits. Where the intended term is unambiguous from the surrounding sentences it has been normalised; every price level he reads out is reported as the captions render it, including the Nasdaq values that appear without their leading digits, and no number has been reconstructed. The caption track and the watch page establish what he said and when the recording was published; they cannot establish a chart level, a position or a fill.
Resources
These are the sources checked for this article. The regulator pages below are general investor-education and fraud-warning material about leveraged retail trading, hypothetical performance claims and commodity trading systems; they are not assessments of ICT, of this recording or of anything said in it, and none of them verifies a statement made here. Any ICT, smart-money or third-party indicator, script, note set or transcript circulating outside the publisher’s own channel is unofficial and untested here.
- [1] ICT 2023 Mentorship Analysis \ January 25, 2023 — The Inner Circle Trader (primary source; watch page read 15 September 2026: published 25 January 2023 at 5:23 p.m. Pacific, 2,176 seconds, public)
- [2] The Inner Circle Trader — official YouTube channel (read 15 September 2026)
- [3] YouTube Help — Embed videos & playlists (read 15 September 2026; the platform documentation relevant to the disabled-embedding notice above)
- [4] CFTC Learn & Protect — Forex Frauds (read 15 September 2026; states that two out of three retail foreign exchange traders lose money each quarter)
- [5] CFTC — Fraud Advisory: Commodity Trading Systems Sold on the Internet (read 15 September 2026; cautionary material on hypothetical trading results and on systems marketed with impressive historical results)
- [6] NFA — Investor Education & Resources (read 15 September 2026)