
Key takeaways
This July 8, 2022 review is ICT working through one week of the Dollar Index, EUR/USD and E-mini S&P futures on weekly, daily, hourly, 15-minute, five-minute and one-minute charts 0:00:04, and the stated point is that the higher-timeframe levels have to be understood before the lower timeframes are opened, or the entry chart becomes a…
Read the full summary
This July 8, 2022 review is ICT working through one week of the Dollar Index, EUR/USD and E-mini S&P futures on weekly, daily, hourly, 15-minute, five-minute and one-minute charts 0:00:04, and the stated point is that the higher-timeframe levels have to be understood before the lower timeframes are opened, or the entry chart becomes a confusing collection of lines 0:16:44. He points to a dollar gap dating to 2002 as the origin of a level 0:00:20, describes an SMT divergence in which EUR/USD made a higher high while the dollar failed to make the matching lower low 0:01:32, and reads that failure as accumulation rather than as an indicator signal 0:01:45. He separates framework from bias: he says a rising dollar signalling risk-off is framework, and that an asset class rallying against that backdrop is refusing to go down rather than offering a short 0:07:51 0:08:02. That is how he argues for a bullish index view in a risk-off week 0:22:13. He defines a real gap as an interval where no trading took place between adjacent candles, keeps the gap’s high and low as references while price is near 0:28:13, and says a range is balanced only after price has passed through it a second time in the opposite direction 0:32:44 0:33:44. On the nonfarm-payroll example he says the execution was on a demo account 0:59:36 and that he does not advocate trading live funds during the release 0:36:32. The recording reports no verified fills, no account result and no brokerage record, and the charts it narrates cannot be checked from the transcript.
How we researched this article
BestProps used document-based research from primary firm sources, checked September 25, 2026. The complete source list, scope, limitations, and commercial-state record appear near the end of this article.
In 2022 ICT Mentorship Market Review – July 08, 2022, the material is a discretionary read of one week rather than a single entry pattern. He opens on the weekly dollar index chart and asks where the levels he has been using actually come from 0:00:04, then walks down through timeframes to show how he used them. This article follows the order he teaches in: higher-timeframe context, then the lower timeframes.
A note that governs everything below. He says he trades a naked chart and that the marks he draws are added for the viewer’s benefit, not because he is reading them live 0:16:51 0:16:53, and that what he actually works from is a notepad of levels and times 0:17:03. He also warns that this particular review is easy to get lost in and that watching at double speed will not work 0:15:30. That is a fair description: this is a narration of charts the transcript cannot verify, and no visual claim made here is independently confirmed.
The Dollar Index: where the levels come from
He starts on the weekly chart and points back to 2002 on TradingView’s DXY, where he sees a small gap between one candle’s low and the next candle’s high, and says that is what he was framing from and where he was looking for price to draw up into 0:00:20 0:00:31. On the daily chart he describes the market trading up into what he had identified, which he attributes to higher-timeframe order flow, then rallying, taking out a high, and retracing into an imbalance that filled and consolidated 0:00:59.
He then flags the divergence he had raised in midweek: after the dollar failed to make a lower low while EUR/USD made a higher high 0:01:32, he calls that a crack in correlation and his SMT divergence 0:02:46, and reads it as a measurement of institutional accumulation of long positions that is price-based rather than indicator-based 0:01:45.
He is careful about what SMT does and does not mean. In his words he is not comparing highs and lows in correlated markets for their own sake; he first wants a market already expected to move one way, then watches price trade into an area where he already expected something to happen, such as an imbalance or an order block 0:02:08. Only then does a failure to make the matching low or high carry meaning 0:01:45. He also states his working definition plainly: SMT is the relationship between important highs and lows in correlated markets 0:03:17.
He then gives a projected dollar level and a cap: once it trades to his figure, he says they are done for the week, meaning the weekly range expansion extreme 0:04:35 0:11:52. The transcript renders that figure as bare digits, and it is reproduced here as his reported projection rather than as a verified price. He adds that the market went a little above where he was looking for and that he does not care about that 0:05:20.
Why he refuses to call tops and bottoms
One of the most directly transferable passages is about process rather than prediction. He says he is sticking to higher-timeframe bias and avoiding trying to pick tops or bottoms 0:05:20, that he will not claim an indicator or method called a market’s exact high or low 0:05:35, and that when he has tried that historically he paid the price and lost money 0:05:53. His alternative is the meat in the middle: plenty of the move exists between the first bite and the last piece 0:06:03, and if precision matters to you, he says to be precise in the middle of the big moves rather than at the extremes 0:06:21.
He also frames the learning curve honestly. He says the pillars of understanding take lessons and experience rather than a formula 0:21:19, recommends at least a full calendar year because you will see seasonal influences, holidays and a curve ball you did not expect 0:21:35, and warns that a viewer will write off an unusual move as the market makers “getting them” when the missing piece is simply logic they have not built yet 0:22:02. There is no promise of profitability attached to any of it, and he does not claim one.
Risk-off framework, and why it is not the same as bias
He defines the dollar’s rise as a risk-off scenario, meaning foreign currencies and assets other than the dollar are more likely to go lower or struggle to rally 0:07:30 0:07:37. The important step is what he does with an asset class that rises anyway: he asks whether that sets up a sell, answers no, and says it is signalling as strongly as possible that the asset is not going down 0:08:12. His wording is that it is not bearish because it is resisting 0:08:12, and he describes it as relentless about not going lower with a higher dollar 0:08:19.
He applies that to the index futures. He says the S&P was reluctant to go lower on Monday and Tuesday even with the dollar rising 0:22:21, that it was showing a willingness to go higher when other asset classes should be struggling 0:19:50, and that this is why he called the S&P bullish that week 0:22:13. He then narrows: since he wants to be long, he looks for the relative strength leader between Nasdaq and E-mini S&P 0:22:51, and he wants the market that makes the higher low even if the other goes up in sympathy 0:23:19. He explicitly separates the two ideas here, saying the risk-off read is framework and that bias is finding the market in alignment with that idea 0:58:53.
He also rejects the idea that this is forex-specific. He says what he teaches is not 4X because it works in everything 0:15:12, and that he was using the same logic when trading commodities in the 1990s 0:21:19.
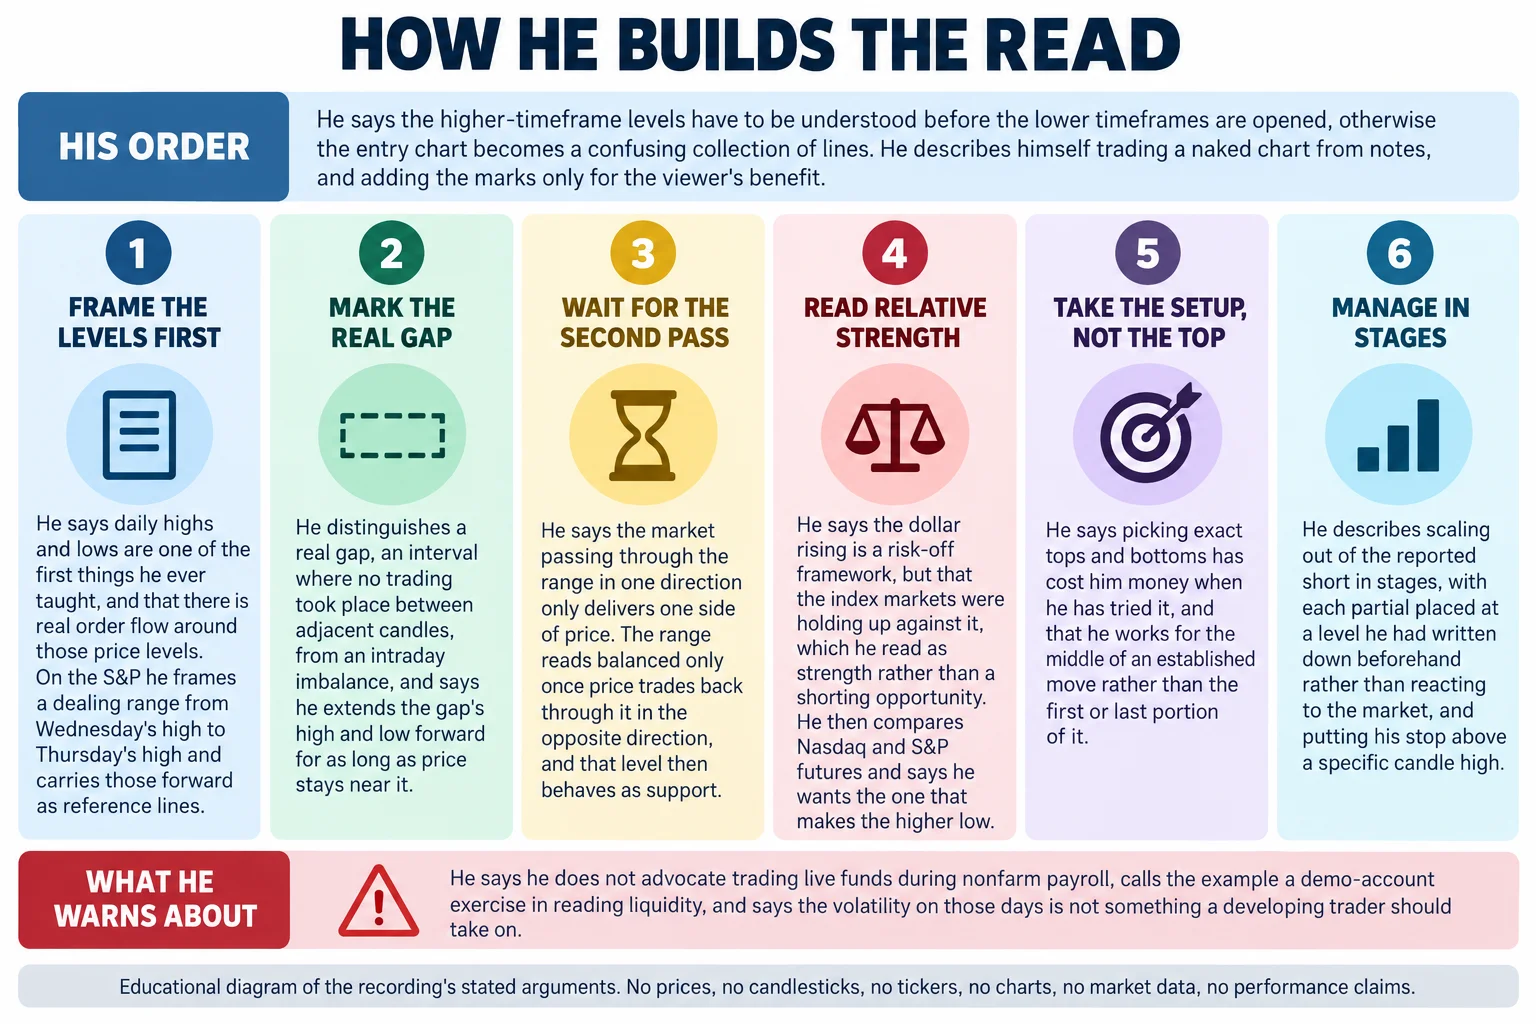
The reading order he describes, as his own sequence rather than a chart: understand the higher-timeframe levels first, mark the real gaps, wait for the second pass, read relative strength across correlated markets, work for the middle of an established move instead of the extremes, and manage the exit in stages. This is an AI-generated educational diagram of his spoken arguments. It is not a chart from the recording and reproduces no market data, no levels and no results.
Real gaps, and what “balanced” means in his framework
On the S&P he frames a dealing range from Wednesday’s high to Thursday’s high 0:14:33, notes the symbol he is charting 0:14:27, and says daily highs and lows with highs and lows from the last three days were one of the first lessons he taught publicly, because there is real order flow around those levels 0:14:58 0:14:38. Those levels are the white lines he keeps referring to 0:15:22. He stresses that these must be understood before dropping down, because otherwise the lower-timeframe view is just a busy collection of lines 0:16:44.
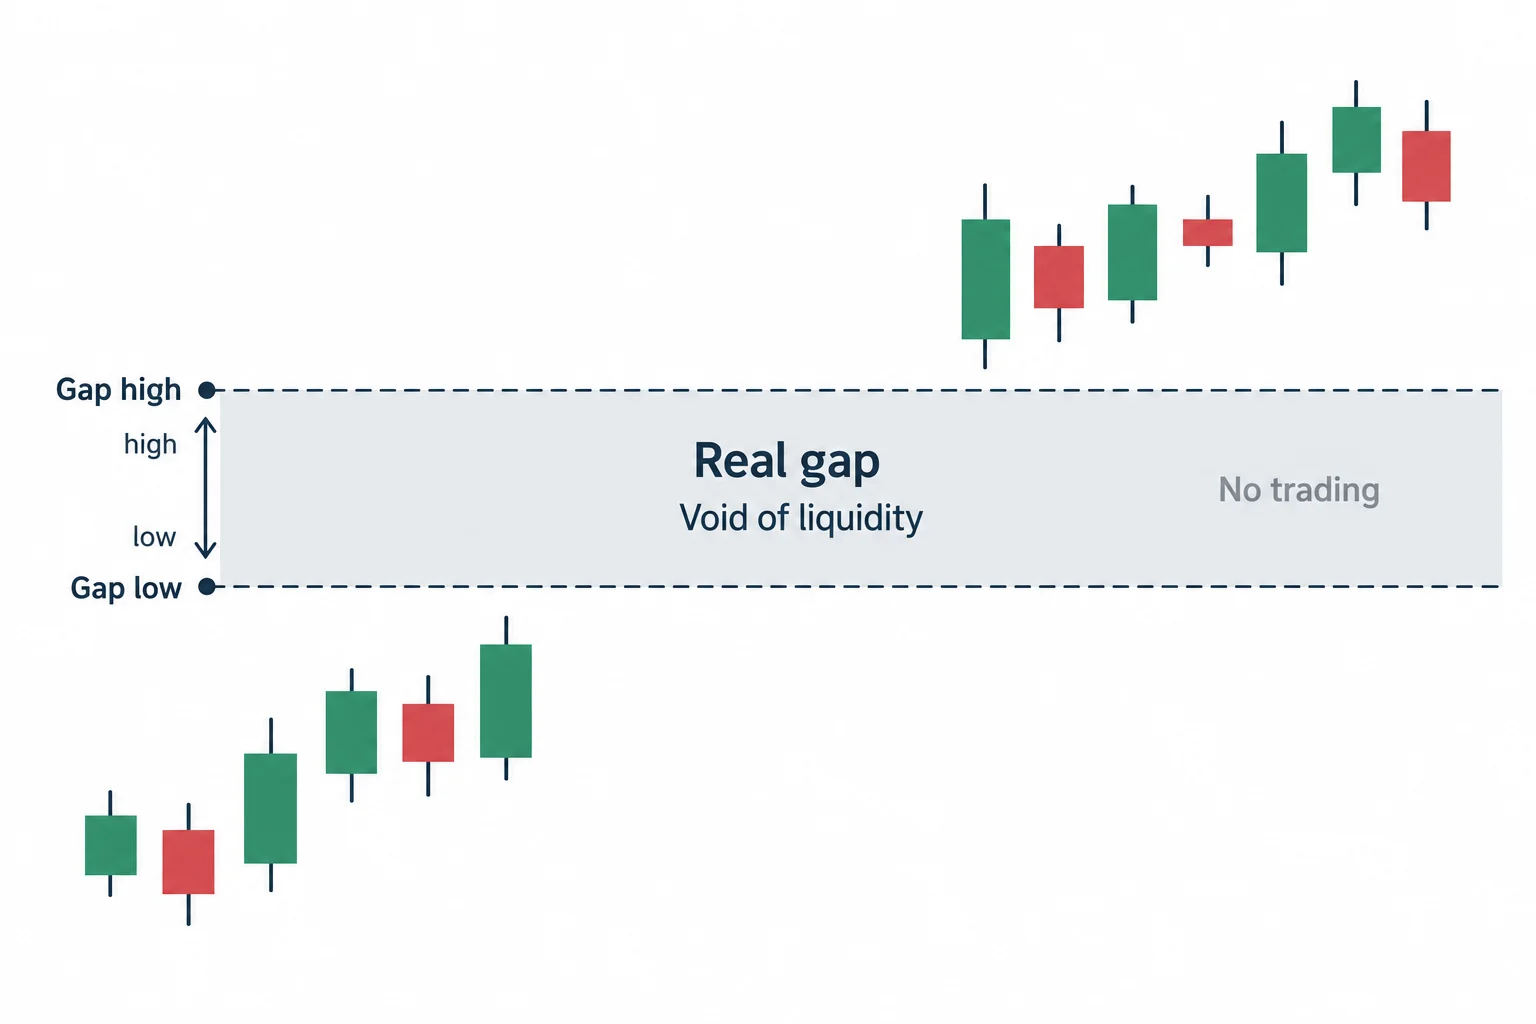
The central definition arrives when he distinguishes a real gap from an ordinary imbalance. His example is a June gap whose high and low he extends forward in time 0:24:06, and he defines a real gap as an interval where no trading took place at all, which he calls a void of liquidity 0:32:44 0:32:58. He is emphatic that this is not the same as the intraday imbalances people label liquidity voids 0:33:08. Practically, he says the gap’s high and low stay on his analysis for as long as price is close to them, and that once price has moved well beyond, the gap stops being salient to him 0:28:13 0:33:22.
He then explains what has to happen before he calls that range balanced. Passing through it in one direction only delivers one side of price; balancing it requires price to trade back down through the same range, a pass of two times 0:33:44. He says the range is balanced once a later candle passes back through it, so that both buy side and sell side have been offered 0:34:27, and he describes the level that results from that as a support level and as how he finds real support and resistance 0:41:39.
Two things in this section are claims about provenance and about market mechanics rather than verifiable findings. He says supply-and-demand teaching is less precise than his because it uses ambiguous zones rather than a specific price level 0:27:40 0:26:11, and that the same material has been renamed and re-taught by others while nothing of it existed before his own teaching 1:07:21 0:34:48. He also asserts that the market is run by an algorithm that reprices and books price on its own delivery rather than being driven by buying and selling pressure 0:29:55 0:30:35. Those are his positions, stated as positions; nothing in the recording verifies them.
The nonfarm-payroll example, and what it is a demo of
The most important disclosure in the recording comes with the payroll example. He says he does not advocate trading with live funds during nonfarm payroll, that a developing trader rushing in hoping for a big move is going to get their clock cleaned 0:36:32 0:36:51, and that he tells people not to trade it 0:36:54. He acknowledges that experienced traders can navigate it 0:37:01 and says it would be irresponsible mentorship to encourage learners to trade the Thursday before or the day of the release because it can be very chaotic 0:37:25 0:37:30. Then he states plainly that the execution he walks through used a demo account, calling it an exercise in reading price and studying liquidity under hard conditions 0:59:36 0:56:48.
Before the trade itself he says the market was reluctant to go lower in a risk-off week, that the imbalance above became the dealing range he was watching 0:23:16, and that he wanted to see whether the gap’s low would offer support 0:36:08. On the 15-minute chart he notes he did not capture the move up at the release because it was too quick 0:50:40, and he describes waiting for a fair value gap to form and then be rebalanced before going short toward a level 0:50:50 0:51:10. He says he deliberately showed only one example so as not to make the case for trading payroll 0:51:33.
He then adds SMT to the picture. On the lower timeframes he says he is plotting the Nasdaq low alongside the S&P and that Nasdaq would not make the matching lower low while the S&P did 0:55:03, while the S&P was trading at a level that made sense to him 0:55:12 — the low of the hourly imbalance, inside a fair value gap 0:50:55. He lists the ingredients he says came together: a fair value gap, a larger fair value gap, the low end of the daily gap where there was no data, SMT, and price at a discount 1:02:13 1:02:24 1:02:49. He calls the earlier move a stop hunt of relative equal lows into the imbalance 1:02:28. This is a narration of his own markings and cannot be verified from the transcript, but it shows the pattern he describes rather than a single signal.
The reported execution and the scale-out
He reports a short taken once the range had been repriced and then balanced 1:09:06, and says he placed his stop above a specific candle’s high rather than at an arbitrary level 1:09:14. He describes the scale-out in stages: entry size, then a partial on the pass through a level, then another in case price ran up to the order block, and a final piece filled by a limit order 1:10:37 1:10:44 1:11:03 1:11:12. He names the levels as bare digits in the transcript, and they are reproduced here as his reported figures rather than verified prices 1:11:19.
He says his partials are not knee-jerk reactions to the market but levels he had already written down 0:45:42, that he was thinking about whether price might run up and bump the order block and did not want to sit through that retracement 1:10:32, and that he could get it wrong 1:10:49. He then reverses the logic and describes how he would have used the same levels for adding to a long instead, including pyramiding 1:11:49 1:12:02 1:12:05. Two limits apply. He states he does not want to sell the idea that beginners should trade very small stops, calling two-pip forex stops and two-to-three-point index stops impractical given recent volatility 1:07:54 1:08:09. And no statement, screenshot or account record in the recording verifies any fill; the only assurance he gives is his own, that he showed the same account 1:09:44.
He is also blunt about how the scale-out should feel while learning. He says in the beginning you will not be patient, that taking the whole position off early and watching is normal progression 1:13:23 1:13:27, that holding a full position with no partials is enduring too much at that stage 1:13:38, and that it takes a while to get to the point of holding the entire trade 1:13:38. He points to a later episode for stop-management rules 1:13:53.
What he says the point of the review is
The closing section is about method and about what he claims the method is grounded in. He says the markets are run by an algorithm and that the evidence is in the charts every day 1:14:22 1:14:35, that what he is teaching the viewer to look for are signatures that repeat because they are framed on algorithmic principles rather than retail logic 1:14:40 1:14:52, and that this is what he means by finding real support and resistance, which he says is not even conventional 1:15:21. He states that these things have nothing to do with harmonic patterns, Elliott Wave or Gann, and no relation to buying and selling pressure 1:14:15. He says he is not trying to entertain anyone and that this is next-level material that is not in the books 1:10:09 1:10:19.
His argument for why the framework is worth the effort is essentially unfalsifiable as stated: he asks how many of his calls have failed to come to pass and says his precision is why, not because he is doing anything retail 1:15:10 1:15:06, and he says if the markets were not rigged he could not have done what he did 1:09:37. He also argues the market is not free and that this is advantageous because a rigged market must follow a method 1:16:16 1:16:32. These are assertions of performance and of market structure, and they are recorded here as assertions. Nothing in the recording benchmarks them, and no audited record of results appears anywhere in it.
What this recording does not establish
The review narrates charts that were already drawn, and the transcript cannot confirm any of the drawings, the levels they sit at, the gap boundaries, or the relative strength comparison he describes. The trade is a demo-account exercise by his own account 0:59:36, and even the short he reports is unsupported by any fill record. The claim that the market is run by an algorithm, that his material predates and exceeds other teaching, and that his analysis is reliably precise are his own claims about himself and about mechanics; the recording offers no independent evidence for any of them. He does not promise that a viewer will become profitable, and he says a full year of study is the minimum he recommends 0:21:35. Nothing here is a recommendation to take a position, and no strategy described is shown to work.
Further reading
The sources below were checked on 15 September 2026. The first is the primary source; the rest are official references bearing on the risk framing and the kind of trading-system claims this review touches, and none is offered as an endorsement of the recording.
- [1] ICT, 2022 ICT Mentorship Market Review – July 08, 2022 — The Inner Circle Trader (watch page read 15 September 2026; upload date listed as 8 July 2022 at 19:09 US Pacific; publicly playable). The primary source for every claim in this review.
- [2] U.S. Commodity Futures Trading Commission, Fraud Advisory: Commodity Trading Systems Sold on the Internet (read 15 September 2026) — explains that system signals are typically technical analyses of price and volume data, warns that hypothetical or demonstrated results are simulations over historical prices rather than real fills, and lists market circumstances and execution realities such systems often fail to account for. Directly relevant to reading a technical review whose reported executions cannot be checked.
- [3] U.S. Commodity Futures Trading Commission, Fraud Advisory: Foreign Currency (Forex) Fraud (read 15 September 2026)