
Key takeaways
ICT’s 2022 Mentorship Market Review for July 25 covers cable and the E-mini S&P in about 9 minutes 24 seconds, first confirming that his pound-over-euro idea reached its marked draw before he went neutral rather than forcing another bias.
Read the full summary
ICT’s 2022 Mentorship Market Review for July 25 covers cable and the E-mini S&P in about 9 minutes 24 seconds, first confirming that his pound-over-euro idea reached its marked draw before he went neutral rather than forcing another bias. On the E-mini S&P, he maps an hourly dealing range, a fair value gap above equilibrium in premium, a bearish breaker formed from down-close candles, and lower-timeframe displacement targeting relative equal lows. He reports selling 10 contracts after a return into a five-minute fair value gap, taking 7 off near the morning objective and closing the remainder near a level spoken as thirty-nine sixty-nine and a quarter, while declining the afternoon short. His core lesson is that one pass through an imbalance merely redelivers price, whereas another pass creates a balanced price range, illustrated with a paint roller moving up, down, and up again. The practical sequence is to frame the higher-timeframe destination, identify premium or discount, wait for lower-timeframe structure and a return into the gap, scale out near the objective, and stop once the scenario is complete. All chart labels, targets, and fills are speaker-reported from a timestamped transcript and are not independently verified by charts, brokerage records, account results, or fill confirmations.
How we researched this article
BestProps used document-based research from primary firm sources, checked September 25, 2026. The complete source list, scope, limitations, and commercial-state record appear near the end of this article.
This is a nine-and-a-half-minute recording, so it covers two instruments and one teaching idea rather than a full lesson. It sits inside the 2022 ICT Mentorship series as a market review: ICT narrates charts he has already drawn rather than teaching a concept from scratch, and he says parts of it were shown first on his Twitter space 0:02:57. That matters for reading it: the levels he names are references to his own earlier work, not levels a viewer can derive from this clip alone.
Pound Neutrality in the July 2022 Market Review
He opens with the pound, which he calls cable 0:00:09, and reminds viewers that in Friday’s commentary he preferred the pound to the euro 0:00:21. He gives his stated reason: it had dipped into a fair value gap and left an imbalance 0:00:24. A red line on his chart marked where he expected price to draw up into 0:00:34, and he says the market traded up, hit that level and completed the idea 0:00:40.
The part worth carrying as process rather than prediction is what he does next. He says he goes neutral at that point, because he does not know whether price wants to go higher or simply consolidate 0:00:45, and that he holds no interest in cable at the moment 0:00:53. A completed objective is treated as the end of a scenario, not as evidence for the next one. He also notes he did not have all that much interest in the pair anyway 0:00:55.
He then drops to a two-hour chart and says he chose that timeframe simply because the candles read better and cleaner there 0:01:01 0:01:04. His description of the sequence is a run up, a rebalance back down into what he calls an optimal trade entry, and then a run right up into the high he named on Friday as the draw on liquidity 0:01:19.
London Session in the July 2022 Market Review
Turning to the London session 0:01:23, he walks through the order he reads price in: stops swept below an early low, consolidation that leaves a second low in place because stops had already been taken, a short-term shift in market structure 0:01:35, and a fair value gap sitting at a discount relative to the low-to-high range 0:01:43. He narrates the result as price hammering that gap and rallying to the Friday level 0:01:48, and notes a separate optimal trade entry for the London session as well 0:01:54.
These are his labels for movement on charts he had already marked, and the transcript cannot confirm the drawings or the levels they sit at. What the passage does show is the shape of his model: a higher timeframe supplies a destination, and a lower timeframe describes how price delivered into it.
E-mini S&P in the July 2022 Market Review
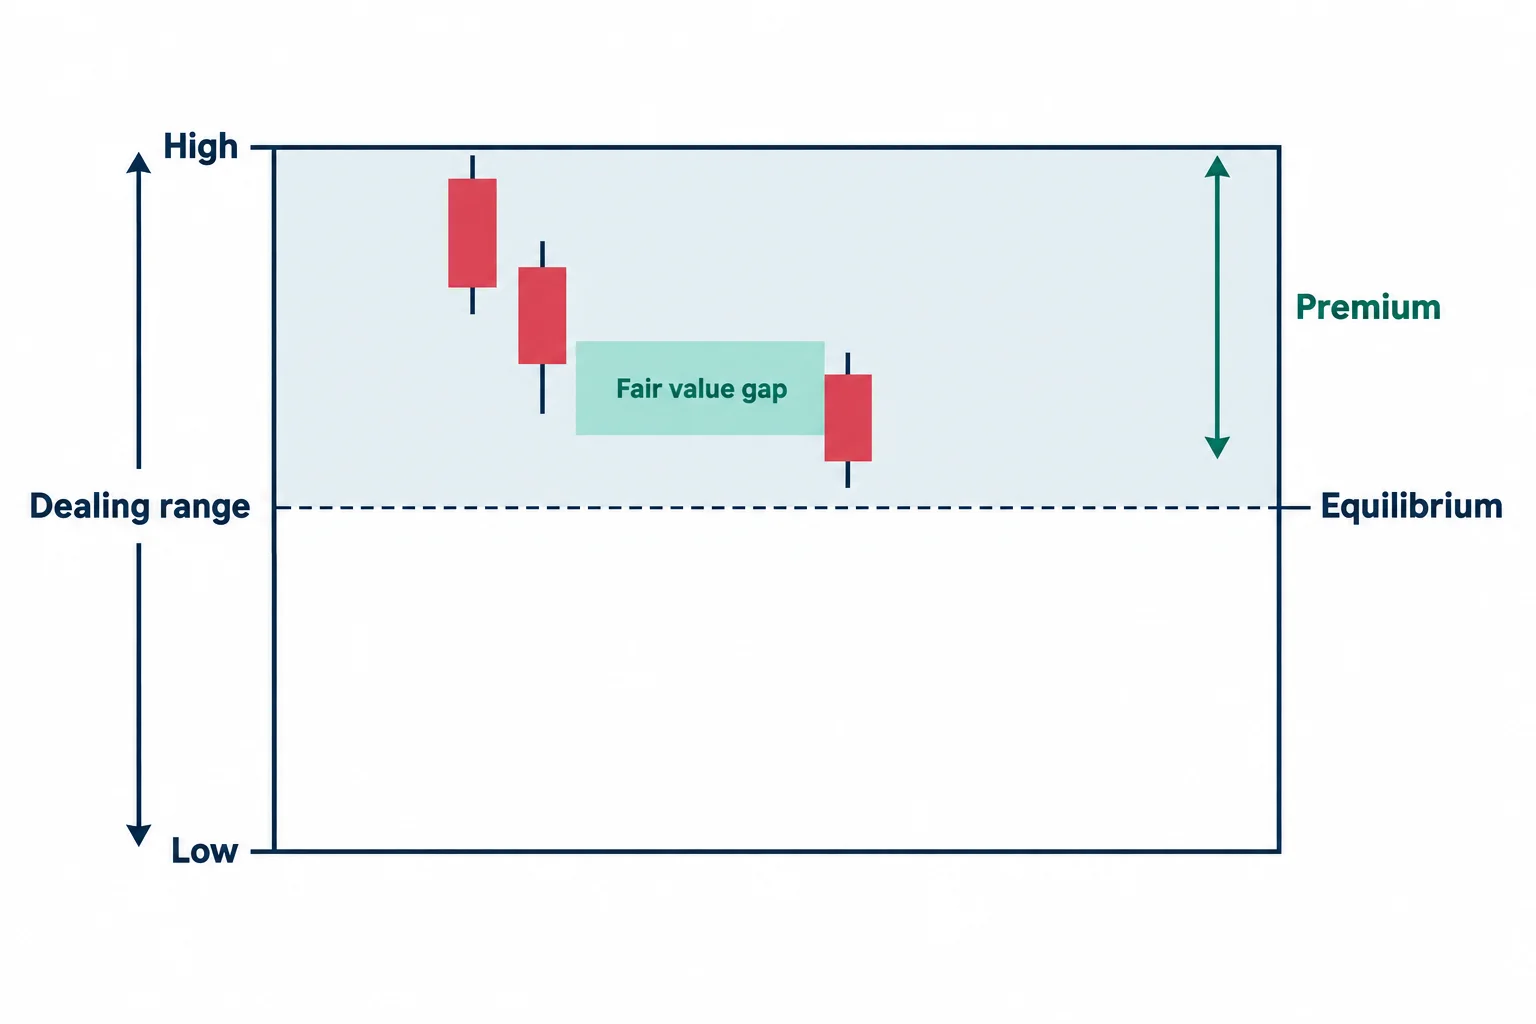
The E-mini S&P section begins at 0:02:03, where he notes that a level shared with his private group was hit on Friday, overshooting it by only a quarter of a point 0:02:09. He raises the possibility of a return into a small imbalance 0:02:18, says he favours it, and immediately adds that he could be wrong 0:02:22. That hedge is stated plainly rather than buried.
On the hourly chart he identifies a fair value gap and a shift in market structure 0:02:32, then defines a dealing range from one high down to a low 0:02:38. He places the fair value gap above equilibrium, which in his terminology makes it premium 0:02:45, and identifies a bearish breaker formed by the down-close candles in the same area 0:03:00. He points out he had shown the same reading on his Twitter space that day 0:02:57.
The teaching point he draws from the hourly example is that the model is not locked to a single timeframe. He says it is not a one-trick approach 0:03:04, calls the setup basically the same thing taught in the 2022 ICT Mentorship 0:03:10, and says it can be traded on an hourly chart instead of a one-to-five-minute chart 0:03:16.
He then moves to a 15-minute view and points out a fair value gap whose bodies price respects 0:03:44 0:03:49, describes price breaking lower and attacking relative equal lows 0:04:01, and says the imbalance only makes fuller sense read back on the hourly chart 0:04:08. He adds that the liquidity resting below was the obvious draw 0:04:15.
Reported Trade in the July 2022 Market Review
On the five-minute chart 0:04:31 he describes working from phone screenshots because he was preoccupied that morning, and gives his plan: if a fair value gap appeared he expected a sell-off, so he waited for price to return into the gap and sold short 0:04:50. He says limit orders were placed into it 0:04:56, and that he expected consolidation followed by an afternoon move to the sell side 0:04:58. He describes the low-to-high equilibrium as the 50% level and says he was looking for a closure of that gap, covering just below the midpoint 0:05:15, before price reached the low end of the imbalance 0:05:20. His stated reason for covering there is that he believed this was the morning’s move and that the afternoon would produce a secondary sell-off 0:05:25.
He notes an absence of economic-calendar news that morning 0:05:31, then describes standard delivery turning into sloppy range-bound trading that created another imbalance, with shorts targeting the afternoon sell side that he says he was not interested in and only watched 0:05:37 0:05:44.
The position sizes he reports are ten contracts sold with seven taken off at a fair value gap 0:05:55 0:06:04, and he says the remainder closed at a level he renders as thirty-nine sixty-nine and a quarter 0:06:12, having covered before the low end of the imbalance 0:05:20. He also corrects the appearance of his own chart, saying the mark looks as though he exited lower than he did and that he actually exited earlier and price overshot 0:06:21. He says the afternoon short was not his 0:06:32, and that he was waiting for the next day 0:06:41.
He then restates the morning pattern as a sequence: shift in market structure, displacement, fair value gap, delivery, a break of a short-term low, and displacement again 0:06:51, which he describes as getting in sync with the move 0:07:03. His explanation for the size reduction is that seven lots brought the position close to the objective he had for the morning 0:07:10, and he says price then went a little too far for him in that session, which is why he was not willing to take the later setup 0:07:31 0:07:37.
Two limits apply to all of the above. The numbers arrive from automatic speech recognition without punctuation, so the levels he speaks are rendered in the transcript as groupings of digits; they are reproduced here as the speaker’s reported levels rather than as verified prices. And no brokerage record, statement, fill confirmation or later outcome appears anywhere in the recording. This is his own account of his own morning.
Balanced Price Ranges in the 2022 ICT Market Review
The substantive teaching in the clip comes at the end. Looking at a fair value gap, he traces price going down and then up, notes that one candle offered buy side and the next offered sell side, and asks whether the range is balanced 0:07:50. His answer is no: it has simply been re-delivered. Only once price trades through the range again 0:07:58 does he call it balanced, and he says that is why the level later stops price like a brick wall 0:08:06. His summary of the term is that what people call a reaction at a rebalanced price is the move at a balanced price range 0:08:26.
He is explicit about where he thinks the concept sits. He says it is not supply and demand and that nothing in Wyckoff discusses it, and he attributes it to his own price-action material 0:08:13 0:08:18. That is a claim about provenance, and it is his claim to make; it is not something this review can verify.
The analogy he offers is a paint roller: think of the roller going up, down and then up once more until the paint is delivered to the canvas 0:08:39. The chart is the canvas, and each candlestick is a stroke of the roller 0:08:53 0:08:59. His stated purpose in using it is to give a way to study price deliberately instead of treating candlesticks as randomness 0:09:13. He closes there and signs off 0:09:21.
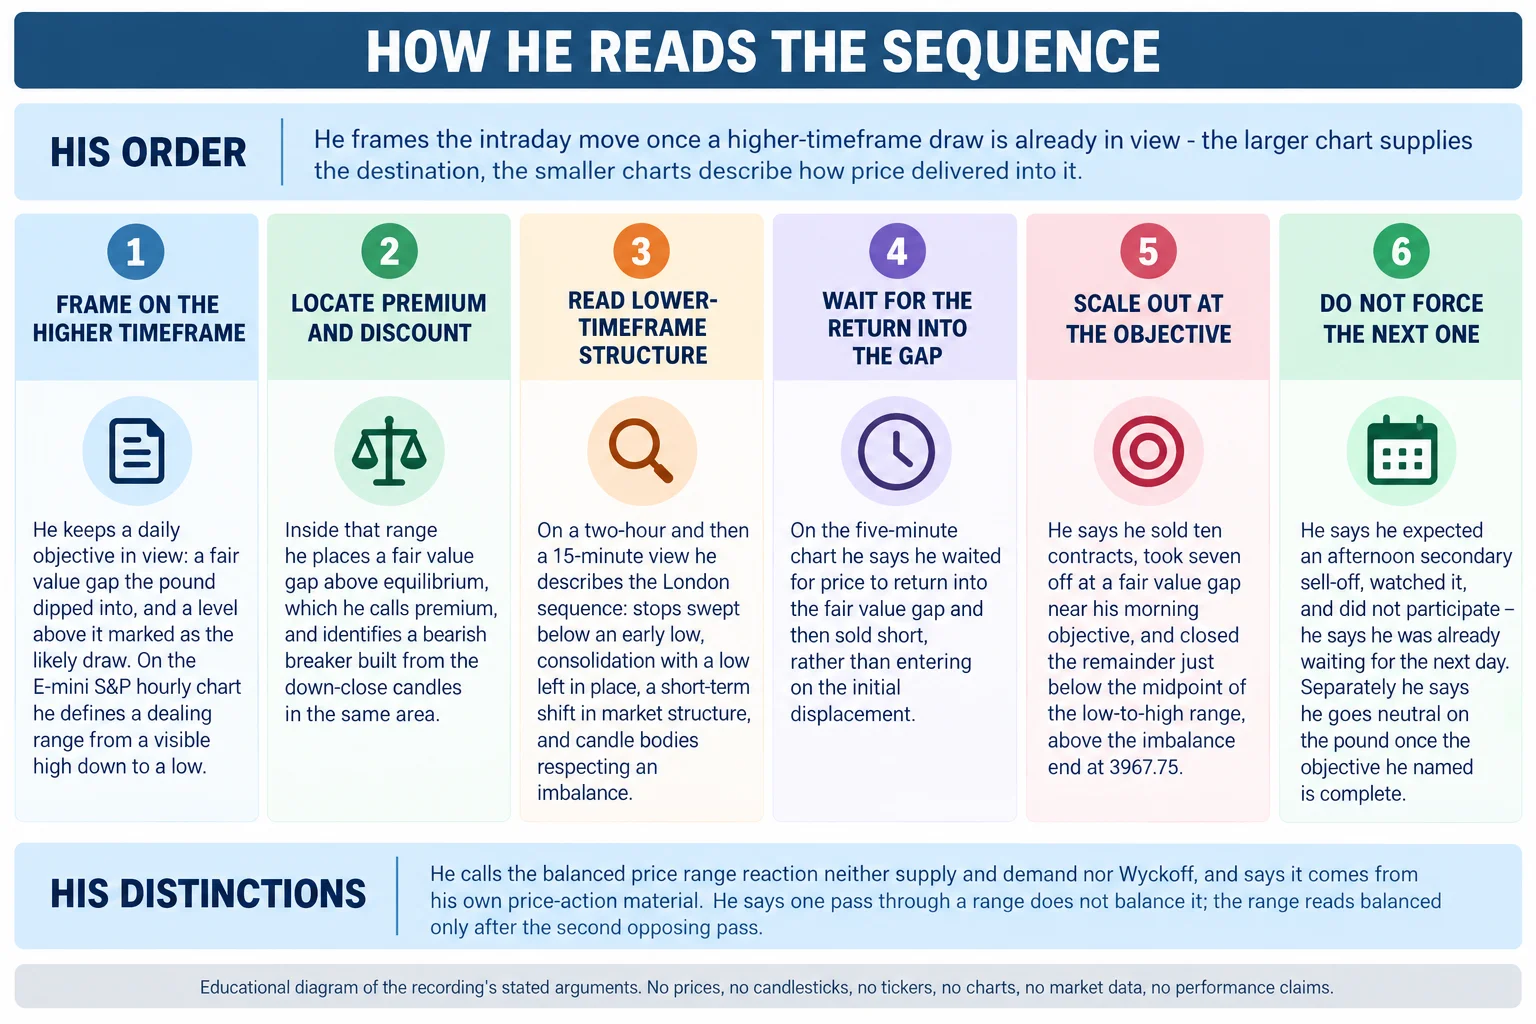
The order he lays out, as his own sequence rather than a chart: frame the destination on a higher timeframe, locate premium and discount inside a dealing range, read lower-timeframe structure for displacement and a shift, wait for the return into the gap instead of the first displacement, scale out near the objective, and leave the next setup alone rather than forcing it after the objective is met. This is an AI-generated educational diagram of his spoken arguments. It is not a chart from the recording and reproduces no market data, no levels and no results.
Limits of the July 2022 ICT Market Review
The review is a narration of charts that were already marked, and the transcript alone cannot confirm any of the drawings, the levels they sit at, the relative equal lows, or the private-group target he references. The trade is self-reported: ten contracts, seven taken off, a remainder closed near a level he names, all described by him and unsupported by any brokerage or platform record in the recording. No account balance, profit, loss or later market outcome is given. The claim that this price-action material is his own and appears in neither Wyckoff nor supply-and-demand teaching is a provenance claim by the speaker, not an independently verified one. He also states plainly that he could be wrong about the E-mini S&P returning into the imbalance 0:02:22, and nothing in the clip shows the setup behaving as a repeatable rule. None of the terminology here is a recommendation to take a position, and no strategy described is shown to be reliable.
Further Reading for the 2022 ICT Market Review
The sources below were checked on 15 September 2026. The first is the primary source; the rest are official references bearing on the risk and system-verification material this review touches, and none is offered as an endorsement of the recording.
- [1] ICT, 2022 ICT Mentorship Market Review – July 25, 2022 The Inner Circle Trader (watch page read 15 September 2026; upload date listed as 25 July 2022 at 13:10 US Pacific; publicly playable). The primary source for every claim in this review.
- [2] U.S. Commodity Futures Trading Commission, Fraud Advisory: Commodity Trading Systems Sold on the Internet (read 15 September 2026) explains that system signals are typically technical analyses of price and volume data, warns that hypothetical trading results are simulations over historical prices rather than real fills, and lists market circumstances and execution realities such systems often fail to account for. Directly relevant to reading a technical review of this kind, where a reported entry and exit cannot be checked against any record.
- [3] U.S. Commodity Futures Trading Commission, Fraud Advisory: Foreign Currency (Forex) Fraud (read 15 September 2026) states that the forex market is volatile and carries substantial risks and that it is not the place for money you cannot afford to lose. Relevant to the pound section, which reviews a major currency pair.
- [4] U.S. Securities and Exchange Commission, Investor.gov, Day Trading (read 15 September 2026) describes day traders as buying and selling over very short holding periods and states that day trading is extremely risky and can result in substantial financial losses in a very short period of time. Relevant to the intraday framing of this review.
2022 ICT Mentorship Market Review – July 25, 2022
The Inner Circle Trader · watch page lists upload 25 July 2022 (13:10 US Pacific) · 564 seconds, about 9 minutes 24 seconds. This is the recording every timestamp link on this page points at.
The recording is not embedded here. An embedded player was tested directly on 15 September 2026 from a BestProps page origin at desktop and mobile widths: the frame loads but then reports “Playback on other websites has been disabled by the video owner,” with no duration and no playback progress, while the video itself is publicly playable on YouTube. No half-working player is left on this page.
Source Notes for the July 2022 ICT Market Review
The narrative above was written from a local automatic speech-recognition transcript of the full original audio, not from human-verified captions, and the review did not watch the recording. All 100 segments covering the full 9 minutes 24 seconds were read, spanning 0:07 to 9:21; the transcript reports complete audio and no low-confidence segments. Two points need care. First, this is a market review of charts that were already drawn, so no visual claim can be checked from the transcript and none is asserted here. Second, numbers arrive without punctuation, so the contract count and the price levels he speaks are reproduced as his reported figures rather than as verified prices.
Source: ICT, 2022 ICT Mentorship Market Review – July 25, 2022, The Inner Circle Trader, watch page upload date 25 July 2022. Local automatic speech recognition of the full original audio was the transcript used and it is not human-verified captions. Every level, label, contract count and interpretation is attributed to the speaker, and no fill, account result or performance figure is verified anywhere in this review. Nothing here is a recommendation to take any position. This commentary is educational and is not investment advice.