
Key takeaways
ICT’s 49 minutes 41 seconds July 22, 2022 market review covers the US Dollar Index, EUR/USD, GBP/USD, gold, September 2022 E-mini S&P and Nasdaq futures, and crypto, with selectivity defined as a one-sided thesis delivering toward a specific level while the opposing case is difficult to frame.
Read the full summary
ICT’s 49 minutes 41 seconds July 22, 2022 market review covers the US Dollar Index, EUR/USD, GBP/USD, gold, September 2022 E-mini S&P and Nasdaq futures, and crypto, with selectivity defined as a one-sided thesis delivering toward a specific level while the opposing case is difficult to frame. He says the Dollar Index reached the flagged range, took buy-side liquidity, swept relative equal lows, rebalanced an imbalance and revisited a bearish order block, with further movement into the 106s or 105s potentially supporting short-term EUR/USD and GBP/USD rallies. EUR/USD reached its daily fair value gap without establishing support above it, leaving 1.0340 as a possible upside objective while a break below the monitored gap would expose the prior low. He rejects GBP/USD as sloppy and fickle. Gold reached two downside objectives but missed a third by roughly half a point, with a conditional move toward the mid-17s if the dollar weakens. The E-mini S&P reached the level tied to its filled daily imbalance and exceeded it by about a quarter point, while his bearish order-block rule selects the highest substantial up-closed candle by closing basis when nearby candles remain inside its range. His intraday framework requires buy side to be taken, a market-structure shift, and a fair value gap above equilibrium for a short, with prior lows and sell-side liquidity used as potential profit objectives. He preferred the S&P because its premium fair value gap was clearer than the Nasdaq gaps, which sat too low. His review process uses hourly and 15-minute screenshots, records which liquidity pools were reached, and compares related markets. He says he neither trades nor holds crypto, compares cheap tokens with penny stocks and offers speculative downside levels while conceding he may be wrong. The recording relies on automated Whisper transcription without chart verification, and its terminology, retrospective interpretations and personal claims do not establish repeatable trading results.
How we researched this article
BestProps used document-based research from primary firm sources, checked September 25, 2026. The complete source list, scope, limitations, and commercial-state record appear near the end of this article.
In the 2022 ICT Mentorship Market Review for July 22, 2022, ICT surveys the US Dollar Index, EUR/USD, GBP/USD, gold, the September 2022 E-mini S&P and Nasdaq futures, and then crypto. The organising theme is selectivity: he says he wants a market whose case is one-sided rather than one that can be argued equally well from both directions. This article summarises the interpretations he presents in the recording; terms such as fair value gap, order block, breaker and liquidity are part of his framework, and the transcript alone does not establish that they provide a repeatable trading edge.
On the source. The watch page lists this recording as public, titled “2022 ICT Mentorship Market Review – July 22, 2022”, published 22 July 2022 at 20:42 PDT, and listed at 2,981 seconds, about 49 minutes 41 seconds. The publish time is 22 July 2022 in both Pacific and UTC, so the “uploaded 23 July” wording sometimes used for this episode comes from a different day-of-week reading rather than a contradiction. The source behind every timestamp link here is an automatic speech-to-text transcription of the recording’s own audio, produced locally with a Whisper large-v3-turbo model, not human-verified captions. Its timestamps are automated, no visual verification of the charts was possible, and the transcript is not reproduced here. Every claim below is attributed to what the speaker is transcribed as saying, and the numbers he reads out are his narration of charts rather than audited market data.
ICT Market Review of the Dollar and Currency Pairs
He opens on the dollar index, saying he had expected price to trade back down into a range he had identified and that it arrived there, with only one decisive down day in the run-up to the level. Dropping to a lower time frame he keys the week off an older reference level he calls the 10761 level, describes price reaching it, an optimal trade entry, and a sell-off that found support at what he calls the old 10642 level (0:05, 0:23, 0:43, 0:50).
He then reads the week through liquidity and rebalancing: buy-side liquidity taken first, relative equal lows swept afterwards, the imbalance rebalanced, and a return into what he calls the bearish order block. He leaves the next step open, saying price may want to get a little further into the “s” or even touch levels he refers to as the “s”, and that such a move would spell a short-term relief rally for EUR/USD and cable (0:59, 1:06, 1:14, 1:20, 1:25).
On the EUR/USD daily chart he says price did get up into the fair value gap he had drawn attention to but has not yet gone back above it to find support there, so the setup he wanted has not developed; he calls the daily chart uninteresting and says a move into a smaller gap would have been better. His working expectation is a possible lift back toward the level he calls 1.0340, which he ties to the likelihood that the dollar could slip further into its own daily imbalance, taking price above the short-term high. He adds a conditional: if price breaks below the gap he is monitoring, the prior low comes into play. He notes the distance between current price and that objective is small enough to be covered in a day, and repeats that he still leans toward a push higher (1:42, 1:59, 2:05, 2:27, 2:53).
On the hourly chart he describes the same pattern as the dollar: sell side attacked after buy side was taken, then range-bound consolidation. He says that consolidation is setting up the likelihood of a large range event the following week, and that price may work above the imbalance into what he calls the 1.03s (3:00, 3:12, 3:17).
Turning to GBP/USD, he calls the daily chart sloppy: relative equal highs were run, price rated that and came back into the range, and although it did return into the imbalance where EUR/USD did not, it then failed to close in the gap as he thought it easily should have. He says that makes him dislike the pair because it is being fickle, and that he does not like trading markets behaving that way (3:41, 4:06, 4:11, 4:30).
ICT Mentorship View of High-Probability Markets
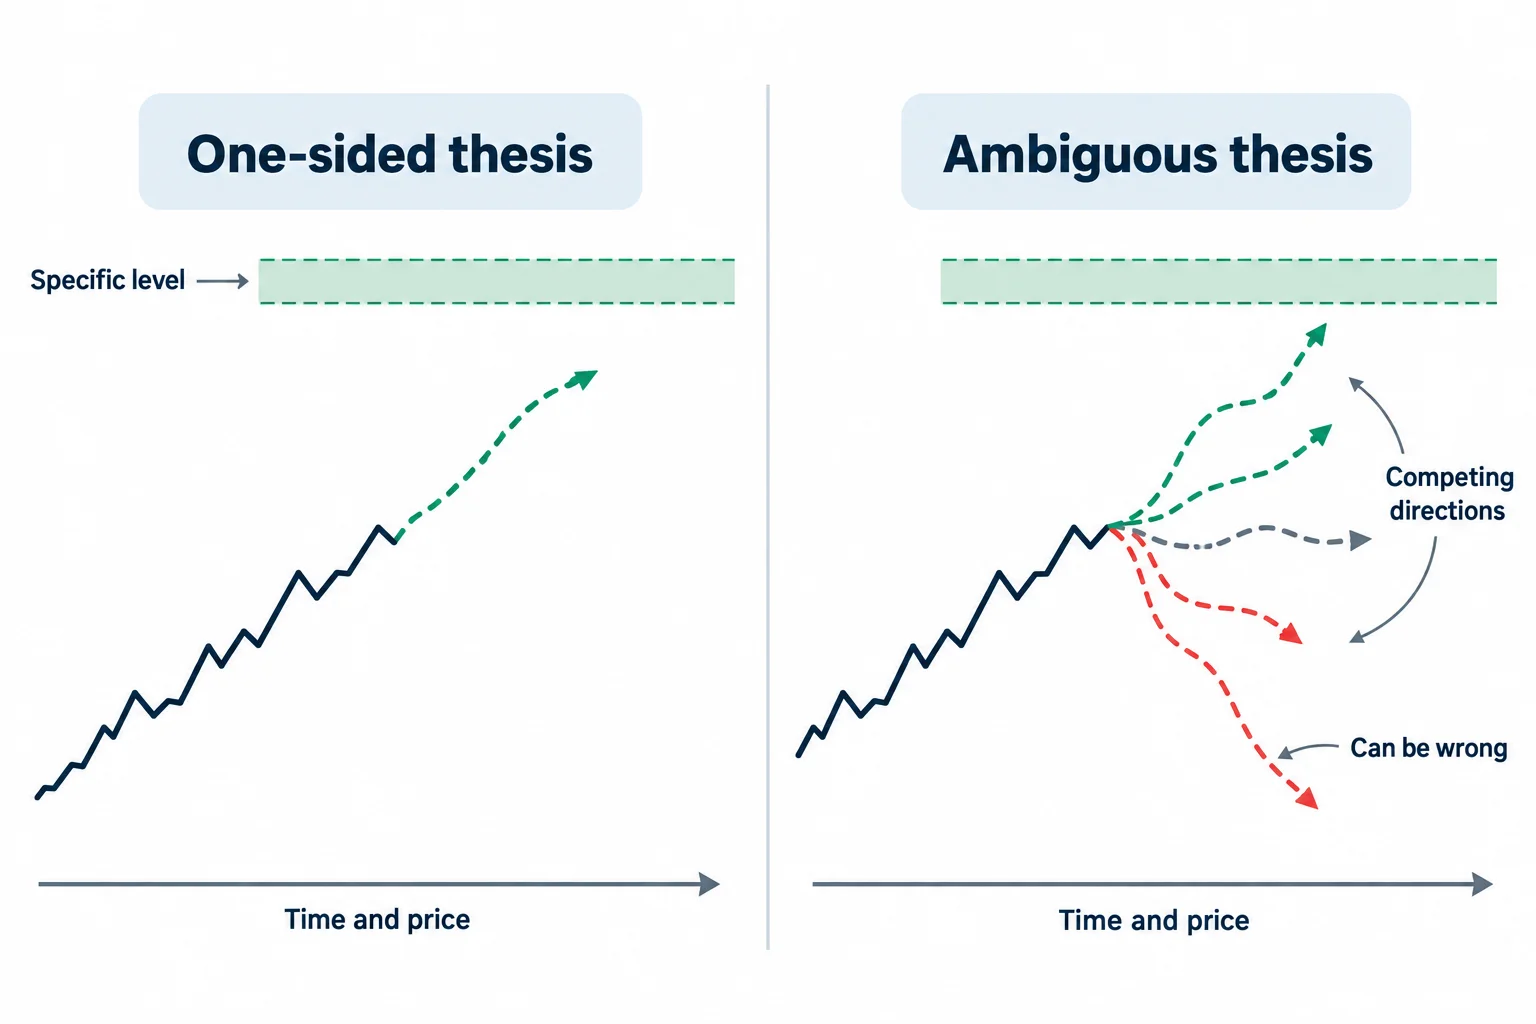
The clearest conceptual passage in the review is his definition of a high-probability condition. He says it has to be one-sided: one direction should look capable of delivering to a specific level, and framing the opposite case should be next to impossible. He describes that as obvious, low-hanging fruit with nothing ambiguous or wishy-washy about the analysis, and says he is not leaning on anything that supports both sides of the same coin. He is explicit that this is his method, using time and price rather than indicators, that others may define high probability differently, that he might be wrong as the analyst and that it has happened, and that he is not infallible, but that his results are largely hinged on framing the market in that capacity (4:39, 4:51, 5:00, 5:11).
Read as education rather than as a claim, the transferable part is a decision rule: when the thesis, the objective and the invalidation conditions are not separable, declining to act is a valid outcome. The recording does not demonstrate that the one-sidedness test improves results, and his own statement that he can be wrong is part of the same passage.
ICT Market Review of Gold Targets and Reversal
On gold he says he had mentioned price would run for two lows, that both were reached, and that the next one he flagged as a draw on liquidity was not. He compares the low of one candle with the low of Thursday’s trading and says the move came within roughly half a point of it but did not quite get below it, then states plainly that he missed that objective. He adds that he does not consider himself infallible and that he did get two of them (5:56, 6:04, 6:10, 8:04).
Because he treats gold as event-driven and says he does not like to trade it heavily, his next step is conditional rather than a forecast: if the dollar weakens further as he expects going into the following week, price could pop up and attack buy side, revisiting relative equal lows and the small gap he is watching. He frames the level he would look for as a mid-17s figure he describes as potentially doable, and says he likes how price came back into an old high with the fair value gap traded into it (6:27, 6:48, 7:04, 7:48).
Two distinctions are worth keeping. First, reviewing movement that has already happened is not the same as forecasting: the transcript supports the levels he read from his chart and the conditional scenario he stated, and it does not show what happened afterwards. Second, the price figures above are what the audio-only source is transcribed as him saying; the charts themselves are not available for independent verification here.
ICT Market Review of E-mini S&P Futures
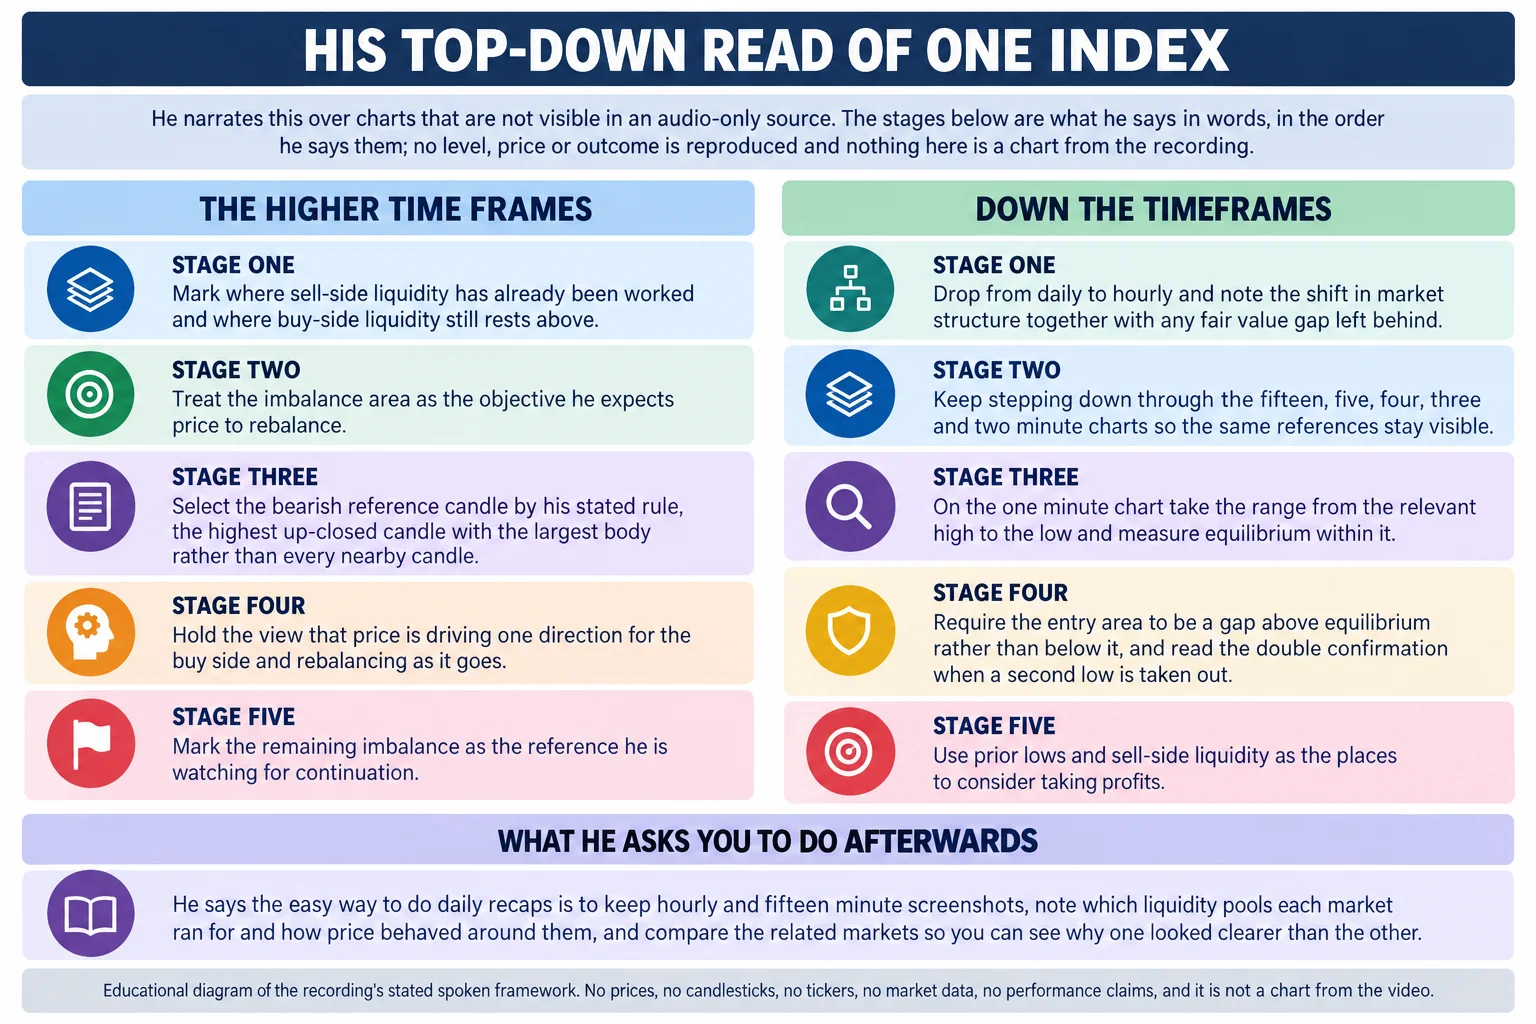
The most detailed instruction begins on the daily chart of the September 2022 E-mini S&P contract. He says he had told viewers earlier in the week that buy-side liquidity resided at three places above the market because sell side had already been worked there, and that price would drive up to reach that liquidity and rebalance the area. He identifies the low he associated with that rebalance, says it ran to that level and went about a quarter point above it, and notes how close the following Friday’s high was to the same figure (8:19, 8:32, 8:45, 8:59).
He then explains how he selects a bearish order block from several up-closed candles, and his rule is specific: not this one and not that one, but the candle that is the highest on a closing basis and has a substantial body, with the others sitting inside its range. That level of specificity is the reason the passage is best studied against the recording, since the chart itself is not reproduced in the transcript (9:29, 9:35, 9:47).
On the hourly chart he recounts the sequence: a run on Tuesday, support at the level he was looking for, a rally to the next level he refers to as 39.67 and a quarter, a pullback, another rally, a sweep of the level he calls the 4,000 level, and then the move to the figure associated with the completed daily imbalance. He then names what would put sell side in play: a fair value gap on the hourly chart together with a shift in market structure, and if price trades back up and fails there, dropping into the five or one minute chart to look for the same pattern in smaller form (buy side taken, then a shift in market structure) to frame a possible run into prior lows and a close of the daily imbalance (9:59, 10:14, 11:15, 11:41).
He is careful about the weekend. He says he does not know where the market will open on Sunday, that anything can happen over a weekend including events that produce extreme gap openings, and that his weekly and daily expectations are only useful after Sunday’s opening. He says he watches Sunday’s trading into Monday and usually has a good feel for the week by the London close, but not always (12:04, 12:16, 12:59, 13:23).
Stepping down through the 15, five, four, three and two minute charts, he keeps the same references in view and notes where they bleed into larger time frames. On the one minute chart he marks the fair value gap, notes price trading above the level he calls 4,007 and three quarters while closing in the daily imbalance, and describes a shift in market structure with a second low taken out as double confirmation. He says he is not using Fibonacci as a trading method but to measure the range: here equilibrium, and if he wants to be short the entry area has to be a gap above equilibrium rather than below it. He points to the time he reads off the chart for the trade into that area, describes price breaking lower into the old imbalance low, and calls the sweep of sell side below it a nice area for taking profits going into lunch. He then describes watching, not trading, through the lunch period before the afternoon interval (14:07, 16:01, 16:30, 16:48, 17:00, 17:27).
On the Nasdaq he says he has not been especially interested in that market and has been focusing on the E-mini S&P. He notes a fair value gap that buy side dug into and completely rebalanced, says it looks somewhat more likely to trade back into a small gap around the start of the week, and adds the alternative: if it fails to get down there, he would be aiming at the buy side resting above. He then compares the two markets directly, answering the obvious question about why he worked one and not the other: the fair value gap was more obvious in a premium position on the S&P than on the Nasdaq, and on the one minute Nasdaq chart the gaps sat too low to offer the premium he wanted. His conclusion is that the S&P was clearly the better vehicle (18:21, 18:48, 19:23, 20:59, 22:05, 22:36).
He also gives a review method: use hourly and 15-minute screenshots for daily recaps, note which liquidity pools each market ran for and how price behaved around them, use rectangles on the 15-minute chart and trendlines only on lower time frames, and compare related markets so you can see why one looked cleaner. That is a journaling exercise, and the recording does not establish that it produces better decisions (20:03, 20:15, 20:20).
ICT Market Review of Bitcoin and XRP Risk
He turns to crypto at the point where he says he is trying to think of another market to cover. His remarks are opinion, delivered as opinion: he says he does not trade it, has no faith or trust in the asset class, has no investment and is not short, and is not trying to create fear or talk it lower, and he concedes he is probably wrong. On Bitcoin he describes the fair value gap he had called in a live space as having been traded into, says the asset class may consolidate and bump once more but that he expects a move below a prior low, and then offers speculative downside figures while labelling the more aggressive ones as aggressive or a wild-spike scenario. He says what would change his read is trading above certain highs (23:08, 23:34, 24:54, 25:34, 26:13).
On XRP he is more dismissive still, saying he told viewers it was dead money, that it has done nothing, and that he treats low-priced tokens the way he treats penny stocks: high-risk and something he does not think people should trade. He contrasts that with index futures and forex, which he says are highly traded by professionals with algorithms attached, and says his own account is set up for just the S&P and Nasdaq futures. He also describes his own early attempt at penny stocks as something that quickly showed him he was not cut out for it (26:44, 27:34, 28:24, 29:01, 33:01).
None of this is valuation analysis and none of it should be read as a prediction that a particular asset will reach a particular price. The transferable point is narrower: he says he will not trade an instrument that does not fit a process he can define, and that cheapness alone is not a reason to take a position. Declining to trade something is not evidence about where it will go.
ICT Mentorship Claims and New Market Series
From roughly the half-hour mark the recording stops being chart instruction. He argues that he called the week’s movements in advance on YouTube and executed on them, that his private group was aware of the remaining daily-chart imbalance that he says became the upside candidate, and that the outcome was close to what he had outlined. He challenges viewers to find anyone else who can do the same (34:47), asserts that statements of account performance he sees from others are faked, and criticises other educators for renaming his concepts and selling courses. He also says he is not infallible, that there are weeks when the idea in mind does not happen and he has to adjust, and that in those weeks he does not get both the weekly high and the weekly low (33:24, 33:56, 35:06, 35:38).
Those are his assertions about his own record. The recording contains no statements, audited figures, or independent evidence that would let a reader verify the results claimed, and nothing in this article should be read as confirming them. He also says he will host a live session before noon the following day and announces a new series about making ends meet (39:55), describing it as aimed at his own sons and at viewers struggling to meet monthly obligations, with the first goal being to cover the highest monthly expense and the mindset portion to follow outside YouTube. That is a description of his stated plan for the series (36:36, 39:44, 40:24, 45:15).
Key ICT Mentorship Market Takeaways
Setting the personal and promotional material aside, the review demonstrates a repeatable way of organising a multi-market weekly recap:
- Favour scenarios whose directional case and objective are separable over markets that look equally plausible in both directions.
- Separate completed observations from conditional forecasts, and label the forecasts as conditional.
- Work from higher-time-frame context and liquidity before hunting for lower-time-frame execution patterns.
- Compare correlated markets and select the clearer structure rather than forcing a trade in both.
- Treat a weekend open and unexpected events as genuine uncertainty; his stated habit is to wait for Sunday and Monday trading before committing to a weekly view.
- Keep screenshots and annotate liquidity runs, imbalances, structure shifts and invalidation conditions for later review.
The market-review sections stand on their own as a dated example of top-down narrative work and of explaining why he preferred one s