
Key takeaways
ICT’s July 18, 2022 market review describes an unverified E-mini S&P demo exercise used to reacclimate after illness, beginning with a simulated twelve-contract long based on stacked down-close candles on the five-minute chart, closing when price struggled at an imbalance, then reversing short into relative equal lows, taking five contracts off below the lows plus…
Read the full summary
ICT’s July 18, 2022 market review describes an unverified E-mini S&P demo exercise used to reacclimate after illness, beginning with a simulated twelve-contract long based on stacked down-close candles on the five-minute chart, closing when price struggled at an imbalance, then reversing short into relative equal lows, taking five contracts off below the lows plus further partials, and lowering the stop before being stopped out. His intended buy-side objectives were the July 8 high and the June 27 and 28 relative equal highs, but price instead took sell-side liquidity, moved sideways into the New York lunch hour, and fell to the day’s low, a decline he repeatedly admits he did not forecast. He recommends demo trading after time away, followed by one or two live trades with the smallest leverage, and warns that reversing this position did not mean students should alternate continuously between long and short. His core market rule is that consolidating bonds and interest rates create choppy index futures with small daily ranges, requiring ultra-nimble session scalps on a five-minute or one-minute chart, one good morning or afternoon setup rather than pyramiding, and no afternoon re-entry after a profitable morning trade. He also says dollar strength can pressure gold because of their inverse relationship, while characterizing gold as highly manipulated and event driven and presenting possible further dollar upside and gold downside only as an observation, not a trade idea.
How we researched this article
BestProps used document-based research from primary firm sources, checked September 25, 2026. The complete source list, scope, limitations, and commercial-state record appear near the end of this article.
In 2022 ICT Mentorship Market Review – July 18, 2022, the recording opens with housekeeping: he says he has been unwell, that the new “ends” series had to wait as a result, and that its first episode should go out that Friday 0:33, 0:54, 1:06. Everything below is attributed to what he says aloud, because the source is an automatic speech-recognition transcript of the full original audio and the charts he is pointing at are not present in it. Nothing here is offered as a verified fill, a verified level, or a performance record.
How ICT Reacclimates to the Market
Before any chart, he answers a question he says he is asked often 2:16. He says that when he is away from the marketplace he gets detached, that it takes a few days to work out sentiment and the kinks in his own analysis, and that he has to push away the preconceived ideas he would want to see in price 1:12, 1:20, 1:26. His stated method is to go through demo trades first: he says he works in a demo account to get acclimated, so that when he is doing things incorrectly it does not harm him, does not take anything out of his account and does not cost him money 1:38, 1:40, 1:46.
He then describes the return to live trading in his own words, and the scale he describes is deliberately small: once he feels acclimated he says he will go in and trade “with the smallest leverage” on a live account for one or two trades, to get a feel for being back in the marketplace rather than to chase profits 1:58, 2:07. He repeats that the day discussed in this recording was a demo trade 4:28.
That framing matters for everything that follows, and it is not a formality: the position he describes taking, managing and reversing was a simulation. The recording contains no live fill for it.
ICT Market Entry in the E-mini S&P
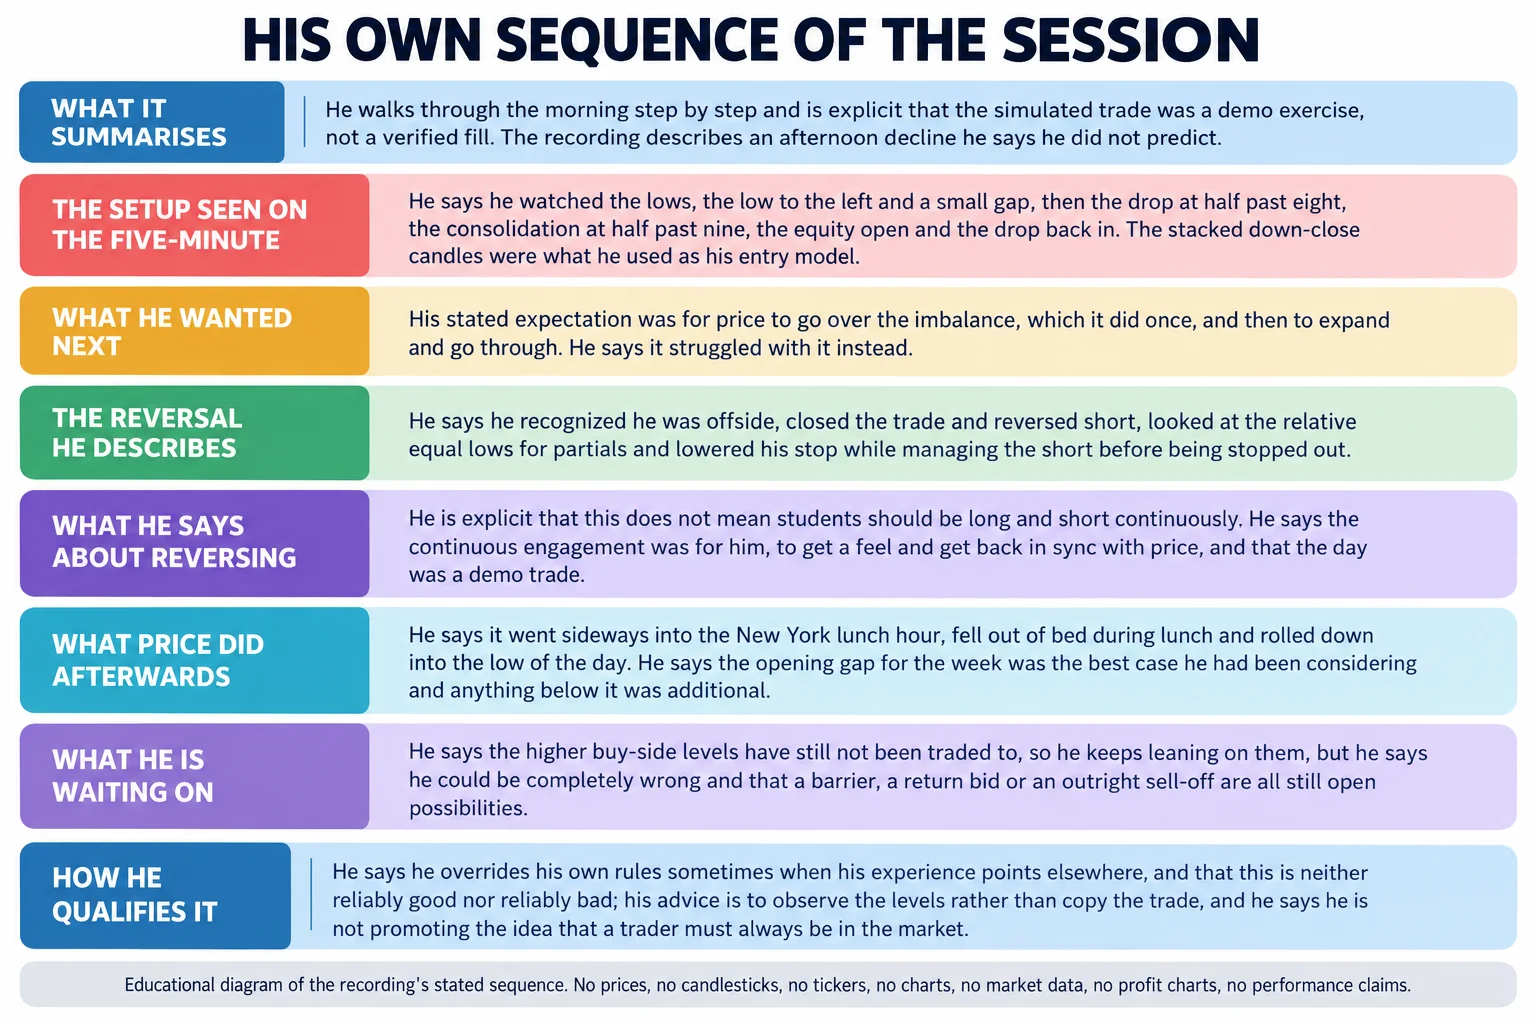
He says he will work bottom up from the E-mini S&P 2:19, and starts on the five-minute chart 2:34. What he says he was watching was the lows, the low to the left of them, and a small gap in between 2:36, 2:41, 2:42. He recalls the sequence of the morning as a drop at half past eight, consolidation at half past nine, the equity open, and then another drop back in 2:47, 2:50, 2:53, 2:54.
His described entry model is the part worth recording precisely. He points to a down-close candle and then a second one dropping into it to touch it, and says he was using that as his mode of entry, in his phrase, looking at a stacking effect with down-close candles, or his order block 2:57, 3:08. He says he wanted to see price go over the imbalance, which he says it did once, and then to expand and go through, and that it struggled there instead 3:14, 3:20, 3:24.
He also refers viewers to a short clip he posted on Twitter in which he executes the entry and then changes his mind 3:27, 3:34. The chart itself is not in the audio, so the level, the imbalance and the stacking pattern are his descriptions of what he was looking at rather than anything independently checkable here.
How ICT Managed a Failed Market Idea
His account of the reversal is unusually specific about the sequence. He says he realized he was offside 3:41, then told himself he was wrong and closed the position rather than being stopped out 5:42, and that he could not have taken a loss of that kind anyway because it was a demo trade 5:55. He says he closed so that he could reverse, because he had started looking at relative equal lows 6:01. From there he describes taking five contracts off below those lows, then another partial and another partial, and finally being stopped out at the stop he had lowered during the management of the short 6:01, 6:14.
The objectives he says he had in mind on the long are worth naming, because they recur later in the recording: he says he was looking for the market to run back above the imbalance and attack the buy side, that he was going to take a partial off the twelve contracts he had long, and that he was reaching for the July 8th high and the June 27th and 28th relative equal highs as buy-side liquidity 5:09, 5:14, 5:28.
He is careful about one inference he does not want drawn. He says that realizing you are on the wrong side does not necessarily mean reversing whatever trade you were in all the time, and that he is not telling his students to be long, short, long, short and constantly in the marketplace 3:46, 3:57, 4:04. His stated reason for the continuous engagement is his own reacclimation: it lets him feel price action and get closer to price instead of sitting back and guessing what might happen 4:10, 4:16. He says the same point again later, rejecting the idea that not being profitable long means going short 22:33.
How the July Market Session Unfolded
After the reversal he describes price going sideways into the New York lunch hour, then falling out of bed during lunch, and then rolling down into the low of the day 6:24, 6:29, 8:23. He says he watched the afternoon rather than participating, that he did nothing while he felt it could potentially go a little lower and would need to take out the overnight low, and that he was not immediately expecting all of the drop 6:34, 6:39, 6:45.
He is direct about the miss, and this is the line he insists on: he says he would be doing his audience a terrible disservice if he sat there and claimed he knew it was going to go down that far, because he did not 7:55, 8:04. He says he went into the day expecting a run at the July 8th high and that he was wrong, but that viewers watched him adapt, reverse and get back in sync with what the market was at least trying to do in the short term 8:06, 8:12. Later in the recording he returns to the same admission twice more, saying he did not see the afternoon unfolding the way it did and that he is not claiming he called it in advance 23:01, 23:08, 23:15.
He also separates the miss from the method. He says he does not feel embarrassed, does not feel his methods do not work and does not feel his models are failing; in his framing the issue is that the operator is rusty because he has not been engaging price 9:00, 9:06.
ICT Market Liquidity on Higher Time Frames
Moving up through the time frames, he shows the same imbalance on the fifteen-minute chart and says partials would have been taken at two points, with at least one contract held to see whether the weekly range objective could be reached, and that it was not in the cards 8:34, 8:35, 8:47, 8:54.
On the hourly chart he shows the imbalance he was watching and says he wanted price to trade above it, take a partial, take another partial, and then reach the relative equal highs, naming the June 27th and 28th, 2022 highs and the July 8th high as the two levels he had also put on Twitter for study 10:31, 10:37, 10:42, 10:50. His own hedge on those levels is explicit: he says they might be useful going into the week, or might not be considered at all if price keeps breaking lower into the imbalance below, and that he does not know yet because it is his first day back in the charts 10:53, 11:00, 11:06.
He then addresses the obvious objection to buying near highs, in his own terms. He says price had shown what he calls exceedingly strong intentions to go higher, that his private group knew about the Sunday opening and the gap being filled, and that in his mind there was nothing left over to fill, which is why the liquidity above the high made the most sense to him 11:38, 11:42, 11:51, 12:02. He adds that if he is wrong, he is wrong, and that it is not a make-or-break matter 12:06.
On the daily chart he counts the evidence the same way: sell-side liquidity has been taken in two places while the buy-side levels above have not been traded to, which is why he keeps leaning on the July 8th and June 27th–th levels 13:34, 13:42, 13:46. But he repeats that he could be completely wrong, that price does not need to go up there, that sideways or lower action would also prove him wrong, and that the failure to get above the level could equally be the beginning of a sell-off into the rest of the week 13:59, 14:02, 14:22, 14:28. His summary of his own state is that sometimes he simply does not know, and that he is trying to be transparent about it 14:34, 14:40.
One further admission belongs here, because it describes a deliberate departure from his own framework. He says that he sometimes overrides his own rules when his experience points somewhere else, that this can be rewarded and can also be the wrong decision as the operator, and that new students cannot easily appreciate the difference 14:46, 14:55, 15:31.
ICT Market Views on Gold and the Dollar
Gold gets a short segment, and he frames it as a relationship rather than an instruction. He says he had been calling the dollar higher, and that dollar strength allows weakness in gold because the two are inversely related 16:23, 16:36, 16:43. He also prefaces gold with a warning about the instrument itself: he calls it an event-driven market that is highly manipulated and, in his words, absolutely manipulated all the time, which he says means it should only be considered when that is obvious, and that he is not confident trading it most of the time 16:50, 16:55, 17:09.
His stated position on the dollar and gold is deliberately open-ended. He says he aimed for a sell-side level and that the market did that 17:14, 17:16, and that a remaining sell-side liquidity pool has not been traded to, so the dollar could still have more room on the upside and gold could go lower 17:27, 17:33. He then tells viewers to keep that in their back pocket rather than treating it as a trade idea, to observe what happens, and that he could be wrong 17:38, 17:43.
ICT Market Rules for Bond Consolidation
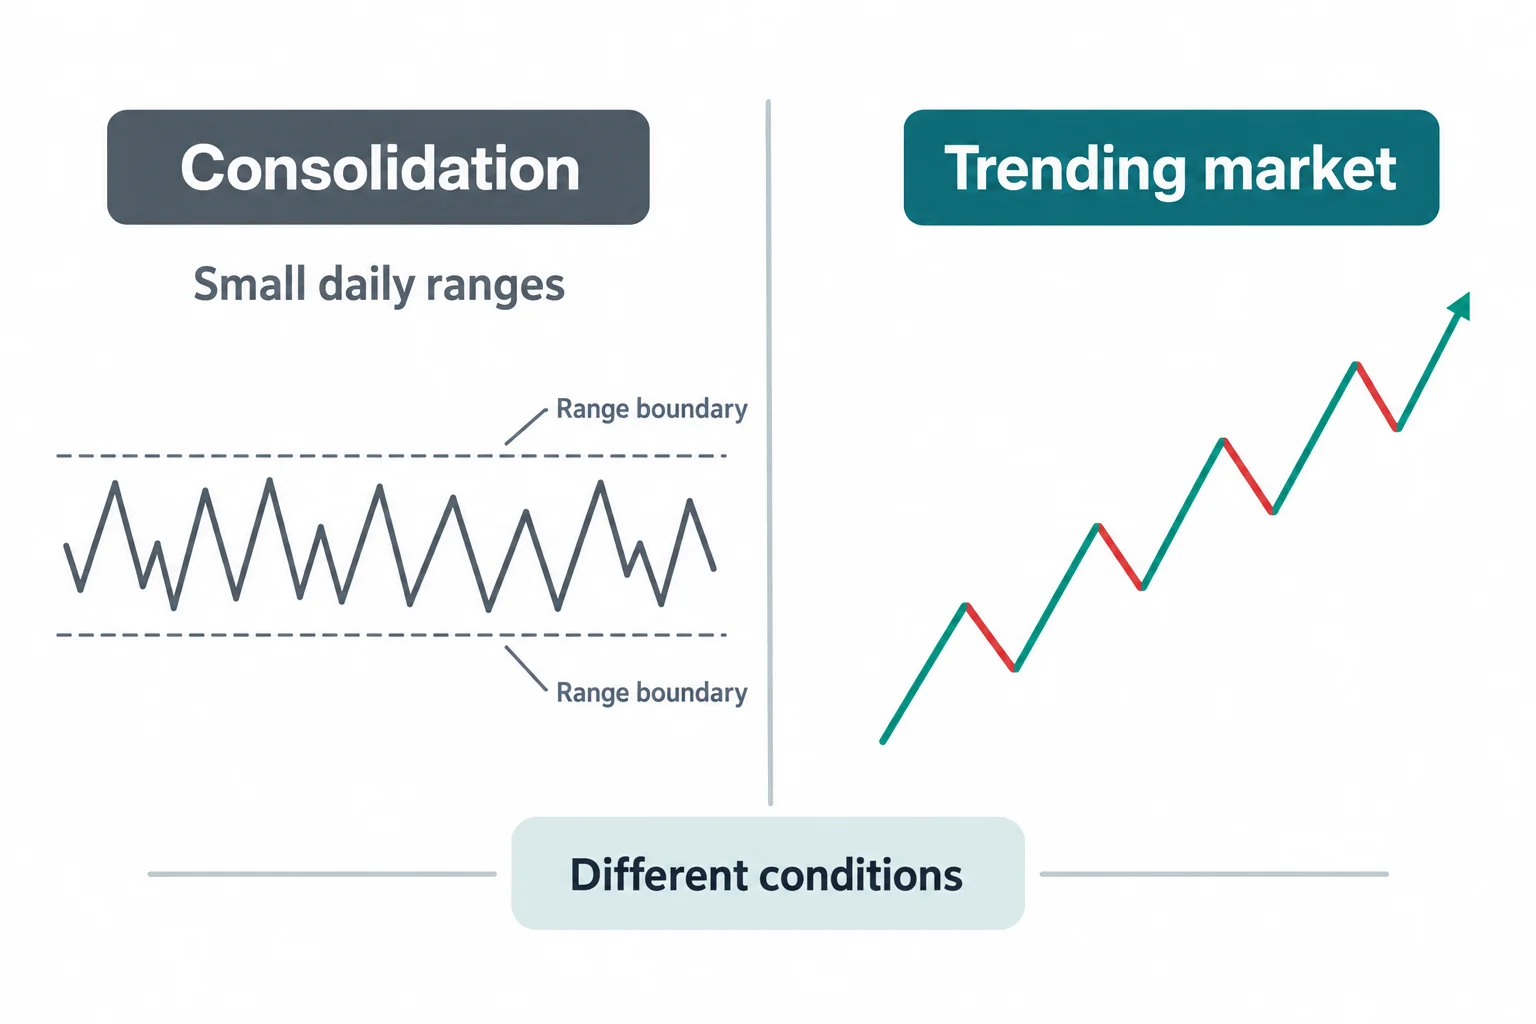
The bond-market discussion is the part of the recording with the most transferable reasoning, and he presents it as the explanation for the whole session. He says it has been a long time since he covered bonds, even in his private group 17:50, 17:56, and that the reason the S&P is consolidating is the same consolidation in the bond market: interest rates are consolidating, and until that range gives way either above or below, index futures will be choppy 18:01, 18:05, 18:12. He describes the choppiness as small daily ranges without the big runs rather than as intraday tightness, and says interest rates are holding the market in what he calls a strangle or a headlock 18:18, 18:35.
His instruction from that reading is a change of style, and he makes it concrete. He says a trader has to be very short-term in this condition, that the things he would normally do with a trending market are not being implemented because of this factor, and that studying how bonds behaved when they were trending and allowed to move a lot is the comparison worth making 18:40, 18:48, 18:57. He is equally clear about what not to do with the relationship: he says not to think too much about the agreement or inverse relationships of direction, and that he is speaking specifically about the tone of the market being trending or consolidating 19:04, 19:11.
From there he lays out his playbook for a consolidating market in one stretch. In his words a consolidation market calls for ultra-nimble intraday trading rather than short-term holds; the strategy is a session day trade scalp, meaning one specific run in either the morning or the afternoon session, one good setup rather than multiple orders or a pyramid, and no re-entry in the afternoon after one profitable trade 19:16, 19:31, 19:35, 19:41, 19:54. He compares himself to a kid in a candy store who cannot be let loose, and points to the summer months and headline risk as the reason a move can appear out of nowhere 20:01, 20:22, 20:28, 20:36.
The chart restriction follows from the same logic and is stated as a rule: five-minute or one-minute setups only, not the fifteen-minute, hourly or daily candle, and no interest in those time frames for the daily range 20:49.
He then connects that rule directly to the miss. He says the reason he was unable to see or expect the big down day that took place during the New York lunch hour and into the close is that his models had switched him from trending to highly specific short-term entries (in and out, surgical strikes) 21:04, 21:10, 21:19. He says he is aware there will be days with runs that keep going and that he will miss them, and that he is okay with that because the market will not always be in alignment with what he is trying to do 21:24, 21:29.
What the ICT Market Reversal Meant
The closing minutes return to the reversal and to what he does not want students to take from it. He says that as a trader he is not in the mindset to hold for a full daily range, especially once his morning bias toward the buy side stopped being confirmed, so he changed direction and changed style, wanting to be nimble because he might be wrong again 21:43, 21:49, 21:54, 22:02. He says he wanted to get below the sell-side liquidity and take profits aggressively (partials, partials again, partials) with a stop positioned so that being run out would not cost him anything, and he notes that it would not have taken anything from the demo equity anyway 22:08, 22:14, 22:19.
He then states the caveat twice. He says he is not trying to produce or promote the idea in his students that they have to be in all the time, and he rejects the inference that not being profitable long means going short 22:27, 22:33. His account is narrower: he saw something that made sense in the opposite direction 22:44, and even when he is wrong, understanding what he did wrong lets him reverse and work with the information 22:48, 22:53.
He closes by repeating that he did not expect the cascade in price, and by saying he expects to get more out of the week before Friday 23:15, 23:22.
Limits of the July ICT Session
There is no verified result anywhere in this material. The trade described was a simulation, the recording contains no live fill, no position size for a live account and no account statement, and the outcome he narrates is his own description of a demo exercise rather than a verified record 4:28, 22:19. His level references (the July 8th and June 27th–28th highs, the relative equal lows and the opening gap for the week) are annotations he is pointing at on charts that are not present in the audio, and nothing here was checked against one. Automatic speech recognition of the audio also cannot independently establish fills, real-money performance or why any market moved.
One rendering note belongs with that caution. The cached quality record for this transcript reports the audio complete with no low-confidence characters across its 267 segments, so no passage above rested on a doubtful rendering of a spoken term. That is a statement about the transcript’s quality, not about the claims it carries.
Watch the July ICT Session Recording
2022 ICT Mentorship Market Review – July 18, 2022
The Inner Circle Trader · watch page lists upload 18 July 2022 · 1,413 seconds, about 23 minutes 33 seconds. The recording is the primary source for every timestamp link on this page.