
Key takeaways
The Inner Circle Trader’s public YouTube recording reviews the September-delivery S&P, Nasdaq, dollar index and EUR/USD across daily, hourly, 15-minute, five-minute, four-minute, three-minute and two-minute charts, but is explicitly educational rather than a trade call, with no live or demo trading during non-farm-payroll week and a planned two-week break.
Read the full summary
The Inner Circle Trader’s public YouTube recording reviews the September-delivery S&P, Nasdaq, dollar index and EUR/USD across daily, hourly, 15-minute, five-minute, four-minute, three-minute and two-minute charts, but is explicitly educational rather than a trade call, with no live or demo trading during non-farm-payroll week and a planned two-week break. The 18 minutes 31 seconds review tracks repeated failures at relative equal highs, an older imbalance used as support and resistance, fair value gaps, the mean threshold and S&P versus Nasdaq SMT divergence, then studies relative equal lows, a stop run, a market-structure shift based on the highest of three consecutive down-closed candles, a measured swing and an imbalance entry area with a hypothetical stop below the low. Price moved without providing the required sequence of obvious one-sided delivery, imbalance and liquidity pools, while the first qualifying setup appeared around the London close and was too late for him, so he concludes that entering anyway would be gambling. All chart details come from an automated Whisper large-v3-turbo audio transcript without visual verification, no fill or performance result is claimed, and the video supplies no evidence that the framework has an edge.
How we researched this article
BestProps used document-based research from primary firm sources, checked September 25, 2026. The complete source list, scope, limitations, and commercial-state record appear near the end of this article.
This article is a transcript-grounded summary of one recording: 2022 ICT Mentorship Market Review – August 02, 2022, published on The Inner Circle Trader channel. The watch page lists the publish timestamp as 2 August 2022 at 21:29 PDT and a length of 1111 seconds, about 18 minutes 31 seconds, and the video as public. Because 21:29 Pacific on 2 August falls on 3 August in UTC, an inventory entry can legitimately carry either calendar day; this article keeps the watch-page timestamp explicit instead of treating the two as a contradiction.
The source behind every timestamp link is an automatic speech-to-text transcription of the recording’ own audio, produced locally with a Whisper large-v3-turbo model. It is not a human-verified caption track. The provenance header notes that the timestamps are automated and that there is no visual chart verification, so ambiguous words and numbers are flagged in place rather than silently corrected. The transcript is not reproduced here and stays private.
One limitation shapes the whole piece. The session is chart narration: the speaker describes candle opens and closes, price levels and timeframe comparisons that are visible only on his screens. An audio-only source can preserve what he says about them; it cannot confirm that any level printed, that any candle closed where he says it did, or that any described sequence would have produced a fill. It is not presented as verified market data.
Why ICT Sat Out the August Market
He opens by placing the session in context: this is 0:23, followed by two weeks away (0:23). He then names two reasons for a low-expectation week. The first is the calendar: a non-farm-payroll week, where he says 0:41. The second is seasonal, and clearly stated as a preference rather than a fact about markets: 0:59.
What he says he is looking for is specific: price delivery he can outline as 2:36, with obvious one-sidedness, obvious imbalance and obvious liquidity pools. Where those signatures are not obvious he says 3:02. His summary of the month is that high-probability, low-resistance liquidity-run signatures are 1:21, and that this week in particular was 2:29 delivery.
He is careful about the difference between movement and a setup. Price did move; in his words the market has gyrations and moved up and down, and he still calls the session one where there was nothing for him. That distinction – motion versus a sequence his model recognises – is the actual subject of the review, and it is the reason the article records his conclusions as his own judgement rather than as evidence that the market was untradeable.
ICT Market Review of S&P Imbalances and Equal Highs
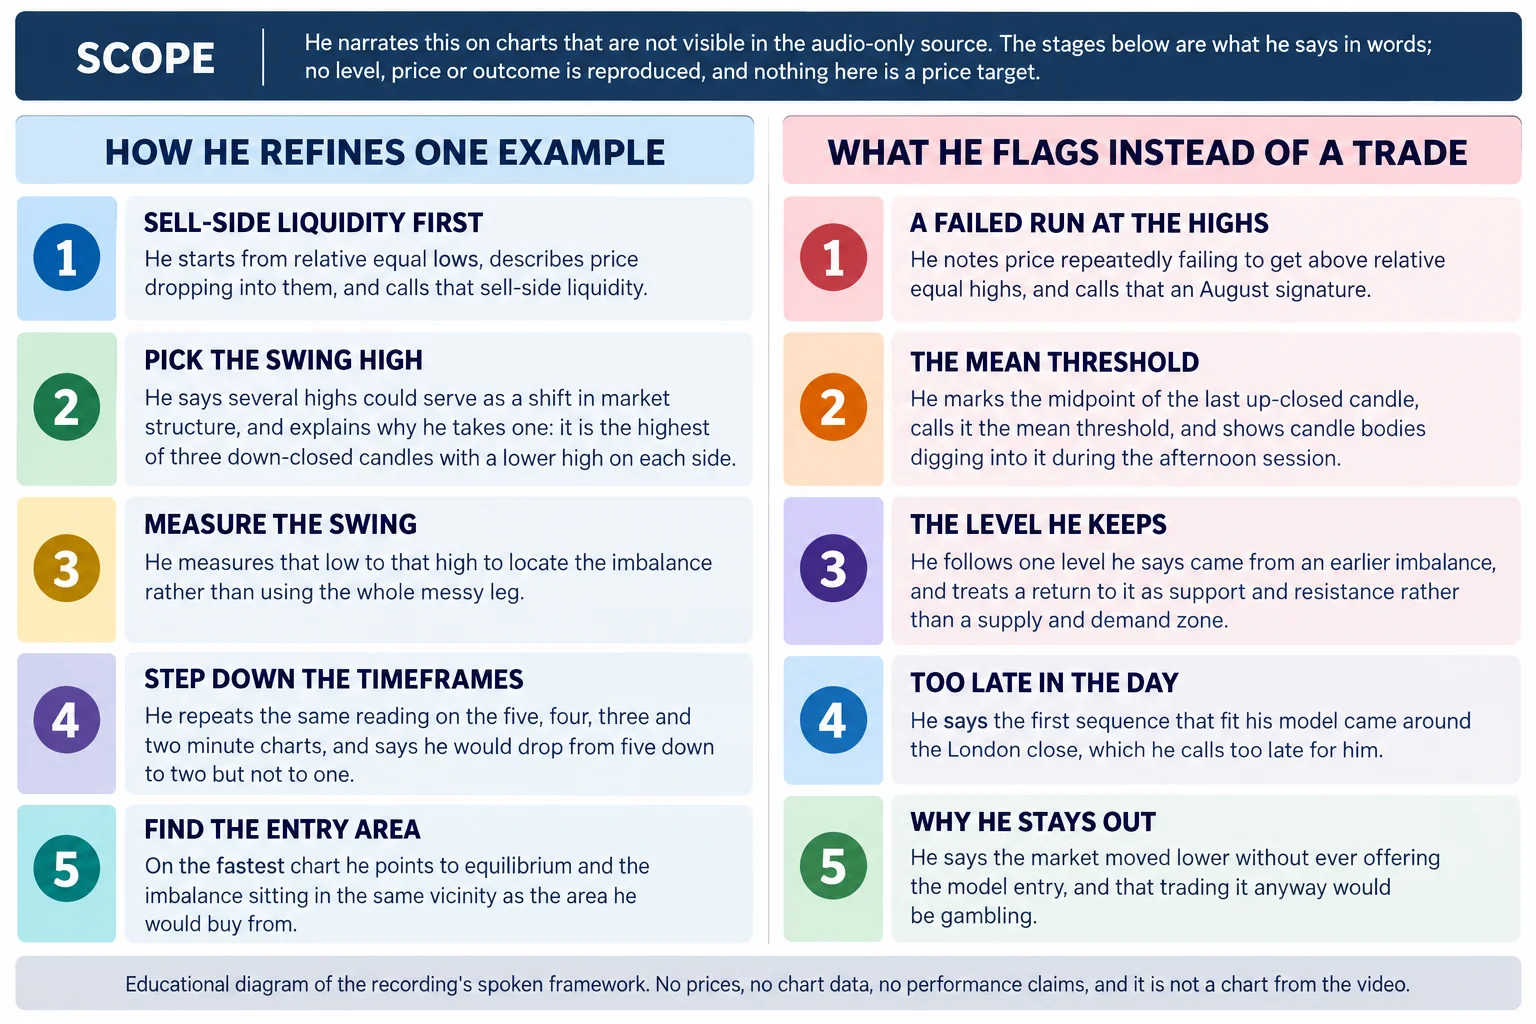
The index segment starts on the daily chart of 1:24, where he refers back to an outline given the previous evening and says price drew back into an area between one candle’ open and another’ close. He states plainly that he has no forecast to add: 1:51, 1:54.
He then steps down through the hourly and 15-minute views (around 2:00) and repeatedly points out a failure to clear a short-term high (2:14). On the 15-minute view he describes price returning to an older fair value gap, then re-delivering into another imbalance before dropping again. A fair value gap here is his term for the narrow imbalance left between candles in a fast move, and re-delivery is his description of price trading back into it.
He also marks what he calls the mean threshold: 7:00, where he shows the bodies of later candles reaching into that midpoint during the afternoon session. That is his reading of where the market returned for equilibrium on this chart, given as an observation about candles he can see and the audience cannot.
ICT Market Review of Nasdaq SMT Divergence
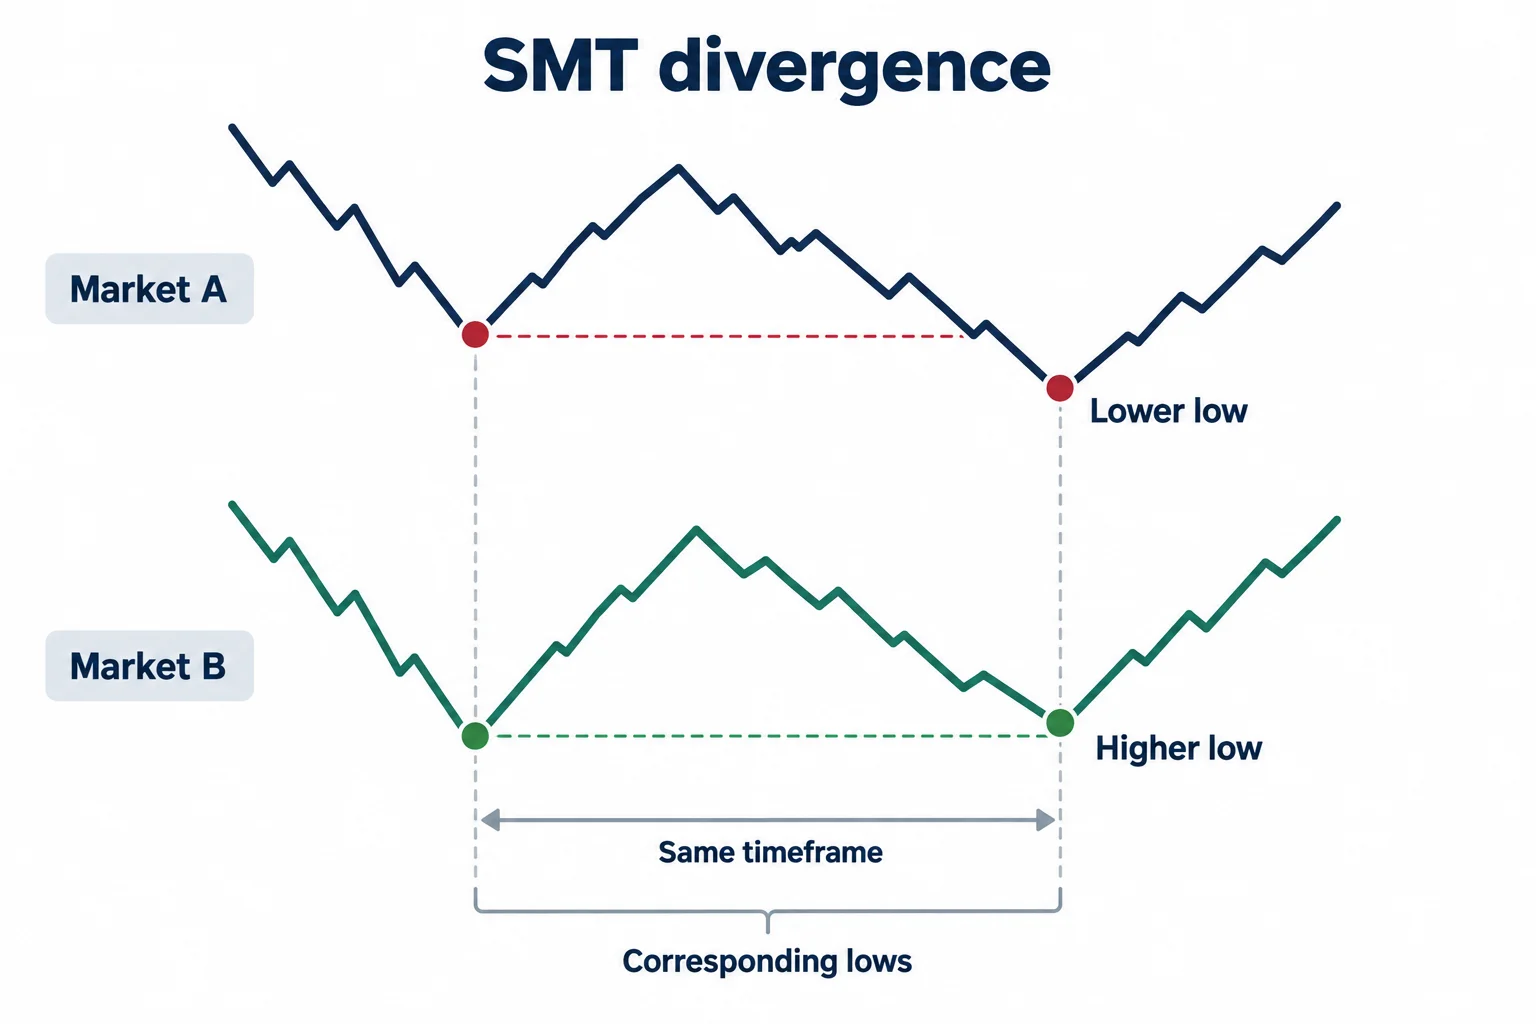
At 4:46 he overlays Nasdaq against the S&P and compares matching lows. His reading is that the S&P made a lower low while the Nasdaq did not (5:32), and he calls that disagreement SMT divergence. He then describes what followed on his chart as 5:54, with a return into a fair value gap before the rally continued.
He spends a few moments on how to set the overlay up on a charting platform, adding the comparison instrument to a lower pane so the two lows sit under each other. The practical requirement he states is that the comparison must be between corresponding lows on the same timeframe; without that alignment, the disagreement he is pointing at would not be meaningful.
Key Level in the ICT Market Review
One price level recurs throughout the index discussion. He calls it 6:09 and says it came from an older imbalance that has been followed across several previous sessions (3:27). On this chart he describes price returning to it, then rallying into a further fair value gap, and he says that once the level had been traded through it would become a reference again in the other direction.
He also draws a distinction between his approach and supply-and-demand zone thinking: when extending a marked area across intervening price action he says 15:02, a defined low and high rather than a broad zone cut through the middle of unrelated candles. That is a definitional point about how he marks levels, and it is worth separating from any claim about whether the level worked.
ICT Market Example Across Multiple Timeframes
The most detailed teaching block begins at 7:31 and walks the same morning sequence through five-, four-, three- and two-minute charts, deliberately excluding the one-minute (7:47). The stated purpose is to look at price delivery in relation to each successively faster chart rather than to find a new setup.
He starts from relative equal lows (8:01), says price dropped into them, rallied, and then selects a short-term high to treat as the shift in market structure. He names the alternatives – 8:06 – and explains his choice: the candle he takes is 8:33, the highest of three consecutive down-closed candles with a lower high to the left and a lower high to the right.
From there he measures a defined swing low to high (9:31, 9:42) and describes an entry area rather than an executed trade: he points to the imbalance after the stop run, calls it the 10:06 for the morning, and on the fastest chart notes that 10:20 with the gap sitting in the same vicinity. He mentions stop placement below the low (10:30) while making clear that he was not taking the trade.
That last point matters for reading the sequence. No fill is claimed anywhere in the recording for this example, and he later says he was not trading. The walk-through is presented as a way of reading the charts, not as a documented trade.
ICT Market View of Dollar Index Uncertainty
Moving to 10:50, he starts by repeating that he is not participating: 10:53, no demo trading and no live trading. He notes an order block beneath the level in question and says price could bounce if the euro behaved as he had suggested (11:05), and that a dollar rally would follow from euro weakness.
What he will not do is turn that into a prediction. He says he does not know whether price wants to keep running and 11:36 – 13:12 – and explains that during this particular week of the month he is more likely to be wrong, so he is 12:05 and says he is guarded rather than assertive. He frames admitting that as a strength rather than a weakness (12:21), and describes his position as sitting on his hands while the market is in a period of uncertainty for him.
ICT Market View of the Euro-Dollar Setup
The final segment starts at 13:51. He says he had expected only a small move up into a defined area and did not need price to return to 13:57, and that price ran into the area he wanted and then gave way lower. His stated reasoning is relative: he says the pair has been held down, that 14:19, that 14:25, and that on that basis 14:27 – weaker. That causal story about central banks and cross rates is his interpretation; the recording does not attempt to evidence it, and it is presented here as his stated rationale.
He then explains why a lower move still did not amount to a trade for him. Extending a fair value gap across later price action and calling the return from below 15:18, he says none of his conditions appeared during the move he expected: no shift in market structure in the area he was watching, and no fair value gap left open for price to trade back into. The first sequence that did fit arrived 16:53, which he calls 17:12. Price then continued lower through a further level he names (17:17), which is the point he uses to show that a move in the direction he expected can still fail to produce an entry he would take.
The August ICT Market Lesson
He closes by naming the lesson directly. The video, he says, is meant to show 17:29 and why the delivery was 17:35 as what he teaches. Movement alone does not qualify: without the sequence his model requires there is no entry, and acting without it he calls 18:09 – a practice he says he does not follow and does not teach (18:12). He signs off with the promise to resume commentaries and instructional lectures after the break (18:16, 18:18).
Read as education rather than as a market call, the useful content is the discipline: an explicit set of conditions that must be present, an explicit statement of personal uncertainty, and a documented decision to abstain when the conditions are absent. None of that establishes that the framework has an edge, and the recording offers no performance data.
Watch the August 2022 ICT Recording
2022 ICT Mentorship Market Review – August 02, 2022
The Inner Circle Trader · watch page lists publish 2 August 2022 21:29 PDT, which is 3 August 2022 in UTC · 1111 seconds, about 18 minutes 31 seconds · public, not unlisted. This recording is the primary source for every timestamp link on this page.
The recording is not embedded here. An embedded player was tested directly on 15 September 2026 from a BestProps page origin: the frame loads and then reports “Playback on other websites has been disabled by the video owner”, with no playable stream and no duration reported. The link above opens the recording on YouTube itself.
August 2022 ICT Market Resources
These are the sources checked while preparing this article. The two CFTC pages are the regulator’ fraud advisories on forex and on commodity trading systems sold online, and the Investor.gov page is the SEC investor-education entry on day trading. None of them evaluates this speaker, tests any of the concepts named in the review, verifies a level or a result, or endorses anything said in the recording. The CME Group FX course page was not reachable during this review and is therefore not cited. Any ICT, smart-money or third-party indicator, script, note set, chart annotation or re-upload circulating outside the publishing channel’ own page is unofficial and untested here.
- [1] 2022 ICT Mentorship Market Review – August 02, 2022 The Inner Circle Trader (primary source; watch page read 15 September 2026, published 2 August 2022 21:29 PDT, listed at 1111 seconds).
- [2] The Inner Circle Trader, official YouTube channel (read 15 September 2026), the publishing channel for the 2022 mentorship market reviews this recording belongs to.
- [3] U.S. Commodity Futures Trading Commission, Fraud Advisory: Foreign Currency (Forex) Fraud (read 15 September 2026), warns that the forex market is volatile and carries substantial risks, and that scam pitches commonly promise profit from already-public news.
- [4] U.S. Commodity Futures Trading Commission, Fraud Advisory: Commodity Trading Systems Sold on the Internet (read 15 September 2026), notes that technical analysis attempts to predict future price movement from historical prices, price relationships and price trends, and that hypothetical trading results are typically simulations over historical data rather than real fills.
- [5] U.S. Securities and Exchange Commission, Investor.gov, Day Trading (read 15 September 2026), the regulator’s plain-language warning that day trading is extremely risky and can result in substantial financial losses in a very short period of time. Background only; it does not address this lesson.