
Key takeaways
In 2022 ICT Mentorship Market Review – August 13, 2022, a brief update recorded while he was on holiday, ICT walks through the Dollar Index, EUR/USD, E-mini S&P 500 futures and Nasdaq futures as chart-reading examples rather than trade signals.
Read the full summary
In 2022 ICT Mentorship Market Review – August 13, 2022, a brief update recorded while he was on holiday, ICT walks through the Dollar Index, EUR/USD, E-mini S&P 500 futures and Nasdaq futures as chart-reading examples rather than trade signals. The teaching core is his distinction between a balanced price range and an imbalance: if price has already travelled through an interval in both directions he calls it balanced, and he argues that is why the market can leave part of an apparent gap unfilled (3:33, 8:45). He calls the one-sided version SIBI — sell-side imbalance, buy-side inefficiency (9:27) — and warns students not to label every relevant candle an order block (6:33). He repeats that time is the first mode of price delivery and restates his four New York windows: 2–5 a.m., 7–10 a.m. for forex, 8:30–11 a.m. for index futures and 1:30–4 p.m. for the afternoon index session (13:48, 14:27). On the markets he describes price trading just beneath a prior low and back into a fair value gap, an old daily low on EUR/USD, what he calls a volume imbalance on ES, and Nasdaq approaching relative equal highs and an order-block area, where he says he does not assume an immediate reaction (33:00, 33:19). He also says August is a sloppy month and that doing nothing is itself doing something (0:44, 28:01). The recording contains no executed trades, fills, stops or verified results, and the charts themselves are not in the audio.
How we researched this article
BestProps used document-based research from primary firm sources, checked September 25, 2026. The complete source list, scope, limitations, and commercial-state record appear near the end of this article.
In 2022 ICT Mentorship Market Review – August 13, 2022, ICT opens by noting he is away from YouTube and teaching and that this is a brief update rather than a full lesson (0:06). He points the viewer back to his reviews from 1 and 2 August so that what he is about to show does not read as hindsight (0:20).
Everything below is written from the recording’s own audio. The source used here is an automatic speech-to-text transcript of the full original audio rather than human-corrected captions, so the words were read, not the charts. Every market reference in this recording is a description of a chart he is showing on screen; no level, price, instrument or outcome here has been reconstructed from the transcript, and none is presented as one.
His Stated August Conditions and the Case for Doing Nothing
His first substantive point is seasonal. He says the month of August is generally sloppy, that it is a rare event for it to be a symmetrical market offering nice clean price runs, and that most times it is choppy and will delay before moving toward obvious levels or rebalancing to a specific price point (0:44). His stated adjustment is not a different set of signals but a filter: he says he does not like to do a lot of things in August, and that focusing on high-impact calendar events helps weed out setups and avoid being in the wrong time in the wrong market (1:08).
He restates the caution at length later, describing August as choppy and capable of beating a trader up before a sustained move unfolds, and saying traders are then often too afraid to re-enter after drawdown (17:03). That leads to the line the recording returns to more than once: he tells viewers they probably should simply take a vacation, acknowledges that wanting to act is impulsive for a new trader, and then redefines the inactivity — in his words, understanding that doing something in August is doing nothing, that the act of doing nothing is doing something, and that being still is a winning trade all the time (27:40, 28:01). He says elsewhere that his own edge includes knowing when not to be doing something (24:29).
He also connects the month to funded-account challenges, saying nobody should be doing them in August and that some viewers had already paid a price for not listening, while noting that other students had done very well; he says he had opened a dialogue on Twitter with people who had withdrawn real money rather than demo or evaluation funds (21:02, 21:31).
Two caveats belong with this section. The seasonal claim is his stated experience over what he calls three decades of trading, not a demonstrated rule that every August behaves the same way, and the funded-account statement is a recommendation to his audience rather than a verified outcome for any named trader.
Balanced Price Range, Re-Delivery and SIBI
The teaching core of the recording sits in the EUR/USD review, which he begins at 2:11. He says his focus had been the area between an older daily low, drawn as a blue line, and a candle’s high, and that he had said price could likely return to that old low; in the event it went only a little past it (2:25, 2:47). He then drops to the lower time frames to show what the delivery looked like, noting the market gravitated back to the old low while the bulk of the volume sat between that candle’s close and its low, with the wicks reaching up to and through the old low (3:08).
From that he builds the distinction he says is the point of the segment. When the market drops to a low, comes back off it and closes there, he calls that a balanced price range — explicitly not an imbalance and not a liquidity void — because price opened at one level, traded down to that candle’s low and then came back off it (3:33). He identifies the specific interval as running from that candle’s close to that candle’s low, and says that if price then passes down through it again that passage can be framed as an imbalance, while the level where the back-and-forth actually occurred is where the balance takes place (3:46, 5:44).
He then answers the question he says students keep asking him in his private group, in the YouTube comment section and on TradingView: how does he know when to leave certain fair value gaps or imbalances open, and when will the market leave parts of an imbalance unfilled (4:17)? His answer is to look behind the move itself, at whether any balanced price range, or any portion of the overall directional move, was rebalanced inside it (5:07).
The terminology he insists on here is the part most often flattened elsewhere. He says that when price goes back up into an area, calling it a liquidity void and saying it has rebalanced is wrong: that is re-delivery. In his definitions re-delivery is price returning over the area, whereas rebalancing is when price goes down to a level and comes back over the top of it, passing through in both directions — and once it has done that and left, he calls the price level from that candle’s close to its low a balanced price range, because it offered both sides of the marketplace (5:21, 5:38, 5:44).
He also addresses his own older material directly, because he says it caused confusion. Looking back at charts he annotated in 2010 to 2012 and at reviews of trades he actually took, he says he was sometimes anchored to a down-close candle where the feature was in fact a balanced price range rather than an order block, and he explains the order block concept was only later introduced publicly in his sniper series — before that he gave clues about it without spelling it out (7:09, 6:59).
The remaining question he answers is why the last portion of a move can stay unfilled. His account is that the movement from that low down to the candle’s high was sell-side imbalance, so price only needed to reach the level of the balanced range rather than fill the small outstanding area, because that stretch had already been traded back and forth. He describes the rebalanced area as like a brick wall in price, with no need to go back up into the unfilled part (8:40, 8:53).
He gives that single-sided condition a name: SIBI, which he expands as sell-side imbalance, buy-side inefficiency (9:27). His illustration is an interval where only sell side was offered, creating an inefficiency in delivery on the buy side, so he expects the algorithm to seek the buy side by running back over the top of it for the purpose of repricing to that point. He adds that the repriced point is not an order block — it is simply a point at which price will reprice and then offer sell-side imbalance with buy side offered (9:53, 10:23).
What he says this demonstrates is the difference between the casually used term liquidity void and SIBI, and he claims the framing as his own contribution to the public understanding of it (12:03, 12:14). He stresses again that a return alone does not constitute complete rebalancing (10:48).
One limit applies to all of the above. The classification rests on candle bodies, wicks and closes that he is pointing at on a chart not present in the audio. The distinction between balanced and imbalanced is asserted and illustrated rather than measured, and no threshold is given for how much two-way trade makes a range balanced.
The Dollar Index and EUR/USD Reviews
His Dollar Index remarks come first and are brief. He says he had noted that an area to the upside looked a little too clean, describes the market staying largely inside a fair value gap on the downside, and says he had identified liquidity as likely sitting at a particular low, with an acceleration implying a run for it (1:30, 1:46). What actually happened, in his account, is that price drew a rate down into that low, went a little below it on the lower time frames and came back inside the fair value gap (1:57, 2:04).
His verdict on that outcome is notably hedged, and worth reporting as he phrased it: he calls it neither right nor wrong, just “it is what it is,” while noting it was interesting how price drew down into the low (1:52). That is as close as the recording comes to assessing the earlier call, and it is a self-assessment rather than an audited one.
He draws the next structural consequence from the balanced-range argument: if price moves below that balanced level, it becomes in his words a strong candidate for short-term resistance, and he describes the market reaching back up into that area (4:01, 4:12). He also argues that a rebalanced area does not need to be revisited, and anticipates the objection that this is just old support and resistance: his claim is that there will be plenty of times when a setup does not come back to the old high but comes to a nearby level and creates a run from there, which is where he says detractors who call his material retail logic have nothing to say (8:53, 36:22).
The E-mini S&P Review: Volume Imbalance and Time
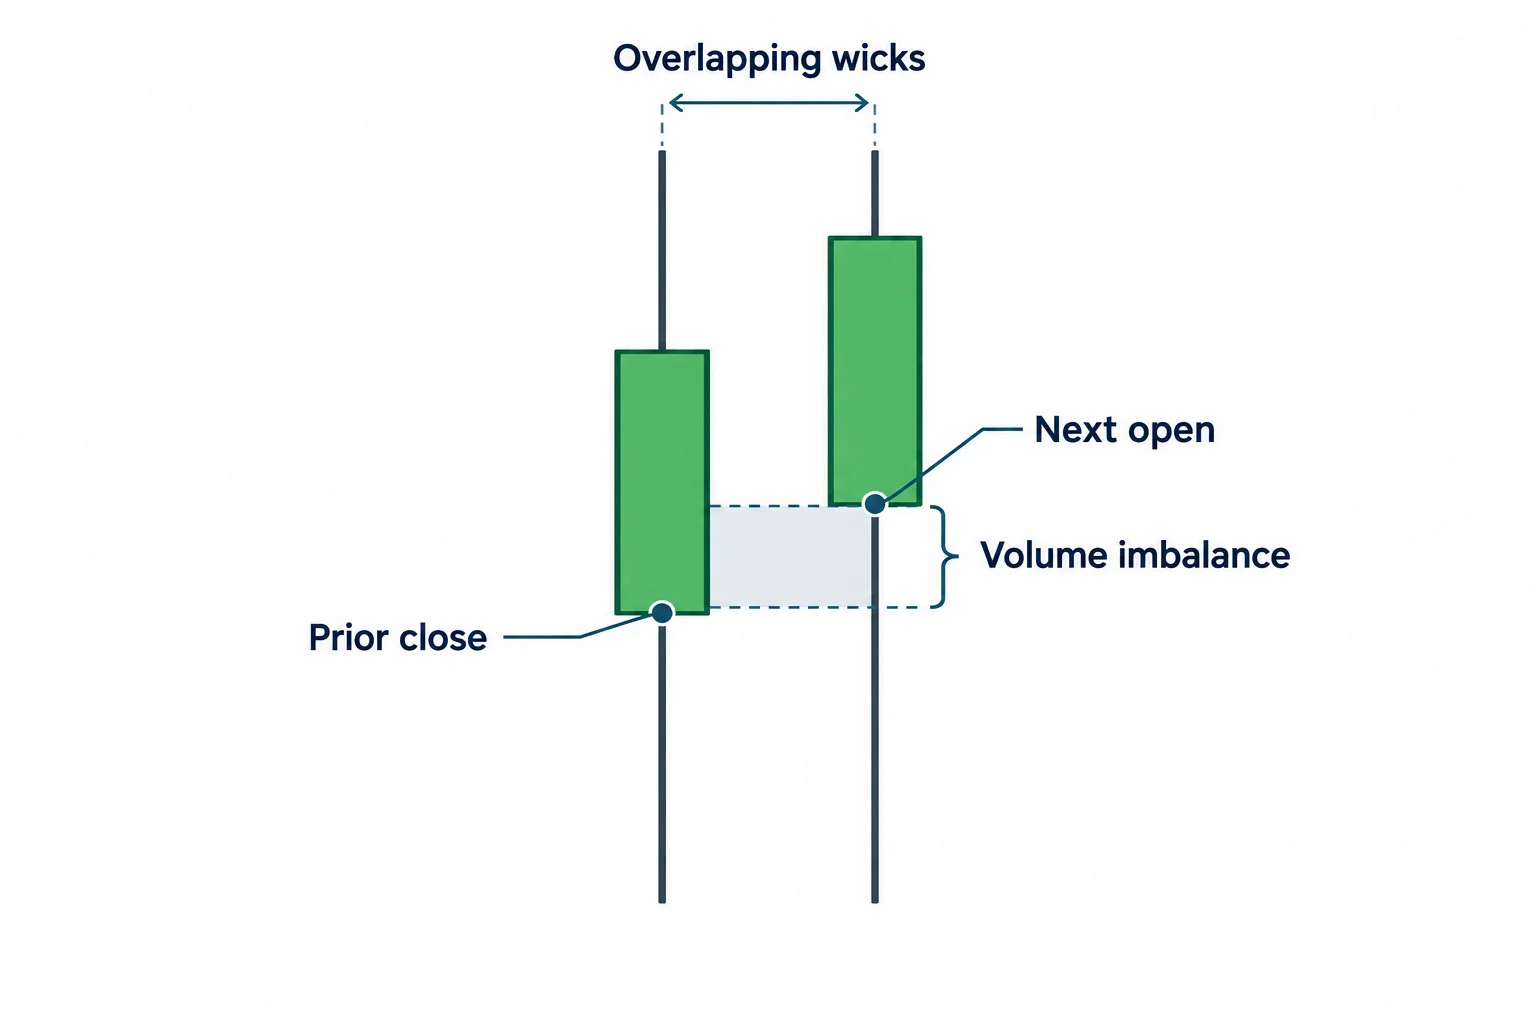
He moves to ES at 12:21, reminding viewers he had declined to give a prognostication on 2 August before leaving, because he had already warned that August is sloppy and can hurt a trader (12:36, 12:44). What he did instead was draw attention to a small area, which he introduces as a volume imbalance (12:49).
The definition he gives in this recording is specific, and worth recording precisely: the volume imbalance is the range between one candle’s close and another candle’s open, and he points to the area between a particular candle’s close and the next candle’s open as the example (12:54, 17:42). He presents it as further evidence that markets are algorithmic and says it will not be found in books, naming Wyckoff, Chris Lori and Larry Williams as authors who never discussed it, and stating he released it in his private mentorship group and taught it one-on-one to students trained in the late 1990s and early 2000s (13:03, 13:20). Those priority and attribution claims are his assertions about his own teaching history; they are reported here as claims, not as verified facts about what other analysts did or did not know.
From the volume imbalance he turns to time, and this is the part of the recording with the most directly checkable content. He argues against the view that time-based charts cannot be trusted, calling that a fallacy, and states time-based charts are very helpful because the first mode of price delivery is time and the algorithm operates on time — whether the interval is a minute, an hour, a clock or a calendar measured over days, weeks and months (13:42, 13:52, 13:57).
He then restates what he calls his kill zone theory in New York local time: 2 to 5 o’clock in the morning for the session he associates with overnight or London activity, 7 to 10 for the New York session for forex, 8:30 in the morning to 11 for index futures, and 1:30 to 4 o’clock in the afternoon session for index futures (14:27, 14:37). His instruction is that focusing primarily on those four intervals or windows puts a trader in operation when the algorithm is likely to perform what he calls its normal macro (14:42).
He defines a macro at that point as a short list of procedures and processes that cause it to do a run in price, a rebalance or a reprice (14:55).
Two things are worth separating here. The windows are a concrete specification of his model — stated times, not outcomes — and they are recorded above as he states them. What is not established anywhere in the recording is that activity is reliably concentrated in those windows, or that the processes he calls macros produce the moves he describes. Those remain his model’s claims rather than findings.
Bias, Patience and What He Says the Framework Is Not
Returning to ES, he acknowledges his earlier higher-time-frame outlook was bullish while several intervening sessions closed lower, and he counts the down days that moved against the bias to make the point that an expected destination does not imply a smooth path (20:05, 20:27). He contrasts the down days with what he calls the largest-magnitude range expansions occurring inside the bullish bias, using that to explain why a higher-time-frame hypothesis can survive a choppy stretch (39:47, 40:10).
He then separates his framework from other approaches more sharply than anywhere else in the recording. He says the markets are algorithmic and do not operate on Elliott Wave or harmonics, Fibonacci levels, supply and demand, or buying and selling pressure; that price goes to where an inefficiency exists to be re-delivered to, or to where orders are resting in the form of liquidity; that the market cannot see your order and works instead from previous movements and ranges and from the open, high, low and close; and that this is why he says the open, high, low and close is all you need, with indicators merely torturing that data (25:03, 25:26, 25:42).
That is a strong claim about how markets operate and about the usefulness of other methods, and it is his assertion rather than a finding. The recording offers no evidence beyond the charts he is presenting and no comparison against the methods he dismisses. He also tempers the framework himself in two places, which is worth noting alongside the confidence expressed elsewhere: he warns viewers not to be lulled into thinking they will watch these videos and immediately succeed, and says there are seasonal tendencies that do not always hold and are not 100 percent (16:23, 16:47).
The Nasdaq Review and the Limit of a Projection
The Nasdaq discussion closes the market review. He notes Nasdaq is a little ahead of the others, that it is just about running its relative equal highs, and that he expects it may open above that level on Sunday’s opening (32:53, 33:08). He then says once it reaches those levels on Nasdaq and E-mini S&P, on the daily chart he does not have an immediate idea of what comes next: he sits still, takes in what the market is likely to do, and studies whether it wants to continue, reverse or consolidate sideways (33:19, 33:30, 33:37).
He is pointed about the misconception he is correcting. He says that when price has gone up to where they thought it would go, traders assume it is now time to sell short, and that this does not follow at all — their expectations are misaligned because they hear people claim abilities they do not have. He states he is not claiming to know what the market will do once it reaches that level; he says he needs to know what is likely to happen right now on the daily chart, and that this is higher-time-frame analysis rather than a one-minute scalping call (33:50, 34:09, 34:23).
He connects that to the claim that price is fractal, offering a thought experiment: he could have hidden the fact that the chart he was showing is a daily, called it a one-minute chart, and viewers would still have looked only at the price-action signatures he teaches rather than at a favourite time frame (34:46, 34:55). That is the pedagogical argument for time-frame-agnostic reading, and it is an argument rather than a demonstrated result.
He then explains why he expects a reaction at a level that is not an old high, which is where he supplies another concept name. Looking at a low, then a high, then a lower low, he identifies the structure as his bullish breaker, and says that is where a reaction comes from — which is why he says his material helps locate where real support and resistance sit rather than following a favourite technical-analysis book (36:50, 37:09).
He also gives an unusually direct account of how he frames probability: he says it is not infallible and neither is he, but that there are times when things align to a degree of probability in favour of his expectation panning out, and that is how he frames high probability. He then tells viewers to test it, saying that if it does not hold up they have their answer and should move along (38:08, 38:32).
What He Tells Students to Do Instead of Rushing
The closing stretch of the recording is mentorship rather than market content, and it contains the most transferable instruction. He says every one of his paid group students who failed were the ones who rushed, going through countless videos in a single day, and that the material cannot be retained that way; he recommends taking time with each video and expects a student to spend about a year working through the core content (47:17, 47:08).
His specific study advice is to keep a journal. He says the benefit comes from going back through journal entries — screenshots, the reasons for taking the trade and the reasons for expecting the setup to play out — and that people who did not keep one do not have that available (56:42, 56:51).
The payoff he describes is diagnostic rather than predictive. Once a trader has learned the material, looking back at recorded failures should reveal where the trade sat relative to the fair value gap the framework would have identified, and he says many times a trader will find they did the opposite of what he taught (57:06, 57:19).
He frames the end state as independence: reading price without needing him to point at anything, no software subscription, and knowing you do not need to trade every day because you wait for the conditions that form the repeating phenomenon he describes. His summary of a losing trade is similarly practical — a loss does not mean the framework is broken, only that something was done wrong, so take the next setup (48:38, 57:59, 58:26). The instruction itself — slow study, a written journal, retaining losses, reviewing entries after learning more — stands on its own regardless of whether the market model is correct, which is a separate question from whether it works.