
Key takeaways
The Inner Circle Trader’s roughly 40 minutes 24 seconds August 1, 2022 market review uses daily and weekly charts to examine the dollar index, British pound, September E-mini S&P and Nasdaq futures, favoring slight near-term dollar weakness with explicit caution, continued pound upside toward buy-side liquidity, and index strength toward higher-timeframe objectives.
Read the full summary
The Inner Circle Trader’s roughly 40 minutes 24 seconds August 1, 2022 market review uses daily and weekly charts to examine the dollar index, British pound, September E-mini S&P and Nasdaq futures, favoring slight near-term dollar weakness with explicit caution, continued pound upside toward buy-side liquidity, and index strength toward higher-timeframe objectives. ICT identifies an SMT divergence in which the E-mini S&P made a higher high while Nasdaq did not, but says it was not a short signal because the broader draw remained buy-side liquidity. His framework uses daily-chart bias and PD arrays including old highs, bearish order blocks, imbalances and breakers, while the prior week’s move is described as trading below an old low to reach stops and sell-side liquidity before advancing into objectives he says were published beforehand. The recording does not verify charts, fills, levels or results and provides no evidence for his claims that bullish weeks make their low on Tuesday roughly 70% of the time when technicals align or that his directional bias is about 90% accurate. His practical August rule is to avoid pushing, seek one setup per week, use very small leverage and stop trading after taking it.
How we researched this article
BestProps used document-based research from primary firm sources, checked September 25, 2026. The complete source list, scope, limitations, and commercial-state record appear near the end of this article.
This article is a transcript-grounded summary of one recording: 2022 ICT Mentorship Market Review – August 01, 2022, published on The Inner Circle Trader channel. The watch page lists the publish timestamp as 1 August 2022 at 19:00 PDT and a length of 2,424 seconds, about 40 minutes 24 seconds, and the video as public. Because 19:00 Pacific on 1 August is 2 August in UTC, an inventory entry can legitimately carry either calendar day; this article keeps the watch-page timestamp explicit instead of treating the two as a contradiction, and the recording itself opens by calling it the Monday 1 August review (0:12).
The source behind every timestamp link is an automatic speech-to-text transcription of the recording’s own full audio, produced locally with a Whisper large-v3-turbo model. It is not a human-verified caption track. Its provenance header records that the timestamps are automated and that there is no visual chart verification, so ambiguous wording and numbers are flagged in place rather than silently corrected. The transcript is not reproduced here and stays private.
Two recognition points. The transcription renders one instrument as “your dollar” (1:27). Context in this session, where the same speaker says he is about to get into “that dollar index” (0:43), and the repeated use of “your dollar” alongside the dollar index across this series, identify it as the dollar index; it is read that way here rather than quoted as an unknown instrument. Second, the phrase rendered as “run some buy sell liquidity out” (1:39) is left as an approximate transcription instead of being sharpened into a term the recording does not clearly establish. Separately, the audio opens on what it calls the September E-mini S&P daily chart (2:25) and then quotes a “,973.75” objective (2:34); because the speaker’s separate review of 28 July attaches that same level to the Nasdaq contract, the figure is recorded as he says it here rather than reassigned to an instrument the audio does not clearly name.
One limitation shapes the whole piece. This is chart narration: the speaker describes candle opens and closes, swings and price levels that are visible only on his screens. An audio-only source can preserve what he says about them; it cannot confirm that any level printed, that any candle closed where he says it did, or that any described sequence would have produced a fill. It is not presented as verified market data, and the speaker’s own characterizations of how markets are run are marked as his interpretation where they appear.
2022 ICT Market Charts Reviewed
The review opens with a scope note rather than a forecast: before reaching the dollar index he says the session will only be working with the daily charts (0:48). That framing is worth keeping in view, because most of what follows is a retrospective explanation of a move he says already happened rather than a plan for the coming session.
On the dollar index he says price had dropped into an area the week before and that one of the levels he has an interest in is what happens if price gets below it (0:53). He names the possibility of a retracement, calls the whole read something to take with a grain of salt (1:04), and then states his lean: he is siding with it likely going a little bit lower (1:10). He adds that if price does go below that level, the area underneath may be no more than a speed bump intended to clear sell-side liquidity before anything else happens (1:18).
He then turns to the instrument the transcription renders as “your dollar”, read here as the dollar index, and takes the opposite side of that short-term view: he says this one still wants to go higher and that he favors a run up into the area he is pointing at (1:27). He acknowledges a sell-side imbalance and an old low that price could gravitate back to (1:34) but says he is more interested in the run up (1:39). Read together with the dollar-index comments a minute earlier, the two statements are not a contradiction in his framework: the first is a short-term level he is watching, the second is the direction he favors overall.
The British pound comes next. He says the previous week’s move delivered as expected (1:48), that price traded up into the area, and that there is buy-side liquidity above (1:56) alongside an older imbalance to watch (1:58). He singles out the bottom of that older imbalance as potentially noteworthy for the rest of the week (2:03) and says everything so far looks solid on the upside, so any retracement should be viewed as another run up into that area (2:13 , 2:16). That is a stated interpretation of the daily chart, not a level the audio can verify.
2022 ICT Market SMT Divergence
The index section starts on the September contract (2:25). He notes price has run above a short-term high, refers back to an objective he says he gave the week before (2:34), and calls the session itself soft with little volatility, adding that he participated in the afternoon session and that it can be seen on his Twitter feed rather than in the video (2:46 , 2:50). He then points at the fair value gap associated with an order block (2:59), defining it in his usual way as the space left between one candle’s high and another candle’s low, and describes price trading down into it before tearing off higher (3:08).
The teaching point in this block is a divergence he calls SMT (3:16). He says that on the day in question the E-mini S&P made a higher high while the Nasdaq failed to make one, a disagreement between the two instruments that he treats as a signal rather than a direction (3:35). His stated conclusion is that this particular divergence should not be read as a top or as a shorting opportunity, because his broader expectation was that price would be drawn up into buy-side liquidity above (4:02).
He is careful about what the divergence does and does not do. In his telling the divergence was temporary and price resolved it in the direction of the larger draw (3:23), which is why he pairs the signal with a higher-timeframe destination instead of acting on the signal alone. That is a statement about how he reads the two charts. It is not evidence that divergence signals behave this way in general, and the recording offers no sample or test of them.
2022 ICT Market Daily Bias
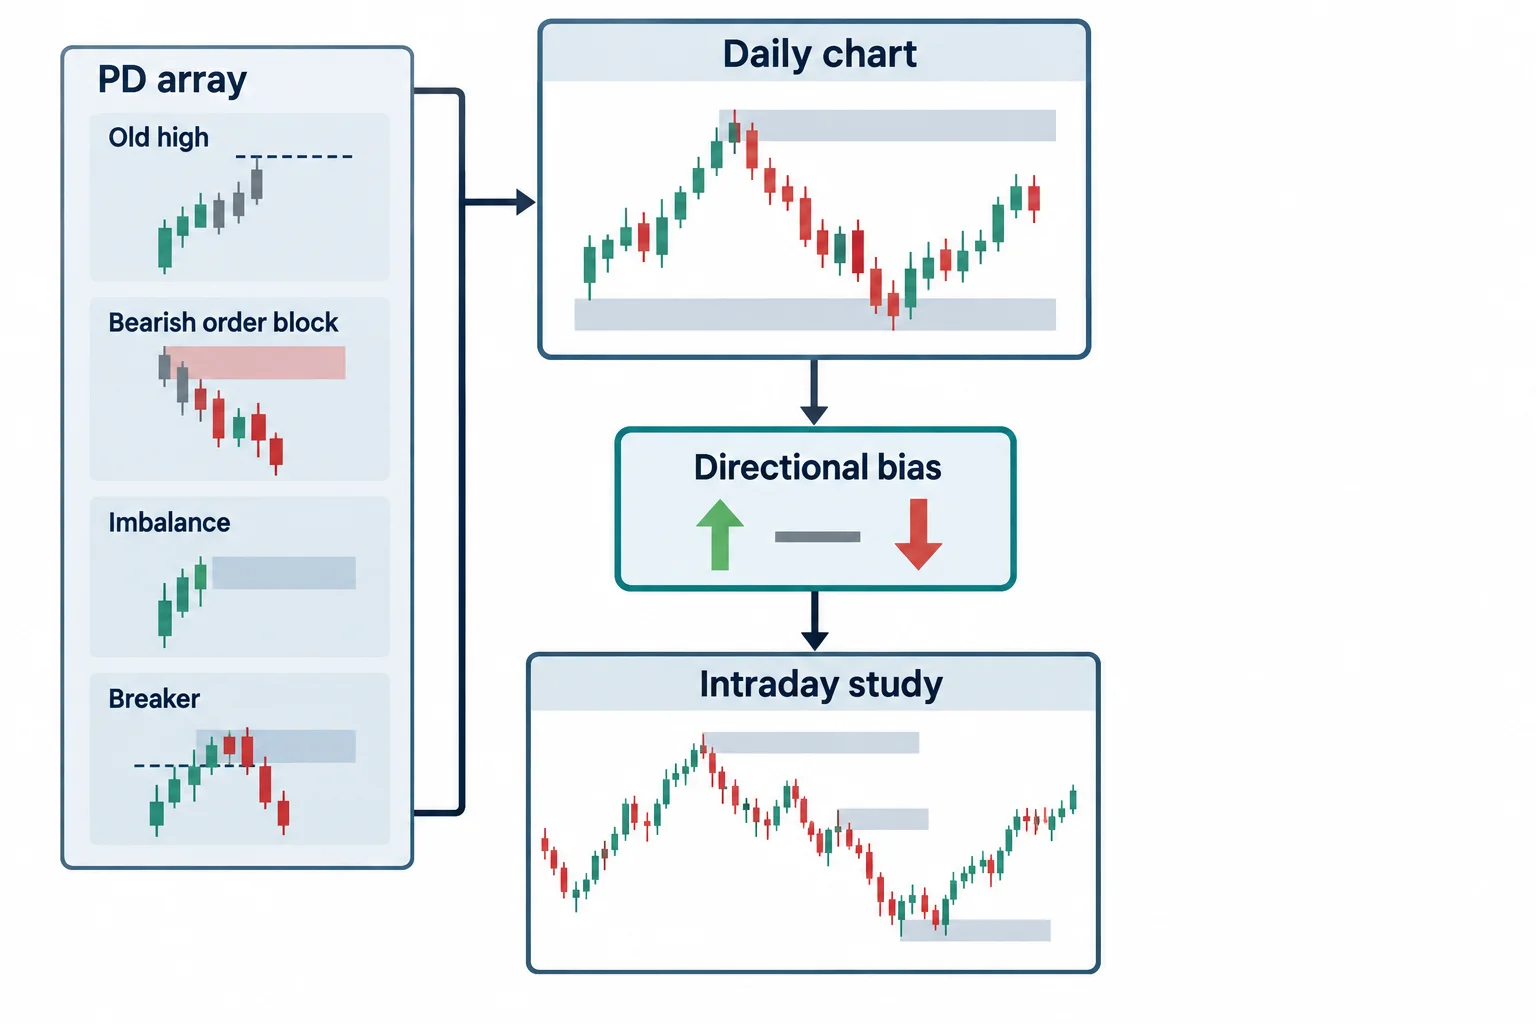
After the index review he steps into an explanation of why he leans on the slower charts at all. He lists the intraday timeframes he teaches, from sub-minute work upward through one, two, three, four, five and fifteen minute charts and then the sixty minute, four hour and daily views (9:40). The argument he makes about them is hierarchical: the algorithm he describes is not running only on the fastest charts (10:28), and the daily chart is what provides the majority of the directional bias behind the buy and sell programs he says he is reading (10:34).
He defines his terms as he goes. A buy program, in his usage, is price starting to move toward a particular higher-timeframe reference (10:47), and he gathers those references under the umbrella he calls a PD array: an old high, a bearish order block, an imbalance, or a breaker sitting above or below current price (10:53). The definitions matter for reading the rest of the session, because almost every level he points at afterwards is placed in one of those categories rather than described as support or resistance.
He also addresses, before the fact, the obvious objection to a review like this one. He says viewers who did not watch the previous week’s videos or his tweets will see him pointing at things that already happened (7:05), and he asserts that he outlined the levels and commentary in advance (11:09). The recording preserves that assertion and the objectives he repeats; it cannot demonstrate when any of them were published, so the claim is reported here as his, not as something this page has checked.
2022 ICT Market Call Reviewed
The most detailed reconstruction concerns the week before. He refers to his video of 27 July 2022 (12:30), where he says he explained that the Nasdaq would draw back down into its imbalance (12:38) and that the E-mini S&P would do the same thing (12:41). He then says he gave a specific target for the next day, the 28th (12:43), and names two objectives (12:49 , 12:52).
He uses that sequence to state a working method rather than a pattern: look for one solid higher-timeframe delivery for the week (13:05), take it if it comes, and if the move stretches over several days (13:12), day-trade small pieces of it toward the same common objective (13:16). He applies the same idea to the day of the week, saying that when he is bullish the market tends to make the low of the week on Tuesday (14:34), and he puts that at roughly seventy percent of the time (14:43).
That percentage is his own claim. He offers no dataset, sample period or method for it, and he also narrows it himself: he notes that viewers have previously applied the idea to every week that closed above its Monday open (14:51), and says it holds when the technicals are in alignment and he is calling the market higher on his concepts (15:01). The recording therefore establishes that the speaker said this; it does not establish the frequency.
From there he describes what he calls an ICT bearish breaker pattern (16:00), which he says he taught one-on-one in the late 1990s and early 2000s (16:06). In his description it involves an old low, a high, and then a lower low that trades through the earlier low (16:18), with a candle inside that structure acting as what he treats as support afterwards.
He then asks viewers to set aside conventional support and resistance for a moment (17:08), and explains the drop below the old low as the market providing an opportunity for what he calls smart money to accumulate long positions, with the resting orders beneath that low as the object of the move (23:58).
2022 ICT Market Liquidity Claims
A long stretch of the session is given over to an argument about who sets prices, and this is where the recording’s limits matter most. He distinguishes between a dealer, which he says has no control over the price feed it works from (18:15), and what he means by a market maker, which in his usage is the entity that delivers price to the marketplace (23:06 , 23:11). He says dealers are not what make these markets (20:44), argues that a large bank can reprice an instrument regardless of the quotes a dealer shows, and dismisses the idea that retail participants collectively move prices, referring to a widely reported episode from the previous year (20:56 , 21:10 , 21:24).
He returns to the point later, saying that when price drops below an old low it is doing so algorithmically so that resting sell orders below that low can be accumulated (23:53). He also ties the retail habit of placing stops under an apparent support low to that mechanism (25:51), saying the stops are exactly the liquidity being sought, which is the paradigm shift he says separates his reading from support-and-resistance theory (26:05).
These are interpretations about market structure and participant intent, and they are presented as such. The recording contains no order-book data, no named bank, and no evidence about who actually traded at any level, so nothing here should be read as an established description of how these markets are run. In the same passage he says his bias is generally right and puts the figure at about 90% (26:39). That number is also unsupported in the recording: there is no track record, no count of calls, and no method of scoring them.
Where the session is more modest is in what he claims for his own levels. On the weekly chart he argues a marked area cannot be read as supply and demand (32:42) because price did not leave that area before returning to it (32:44), and he tells viewers that applying his logic to their own past supply-and-demand trades will explain why some won and some lost (33:07 , 33:17). The first is a definitional point about how he marks a range; the second is an assertion about hindsight explanation, offered without a worked example in the recording.
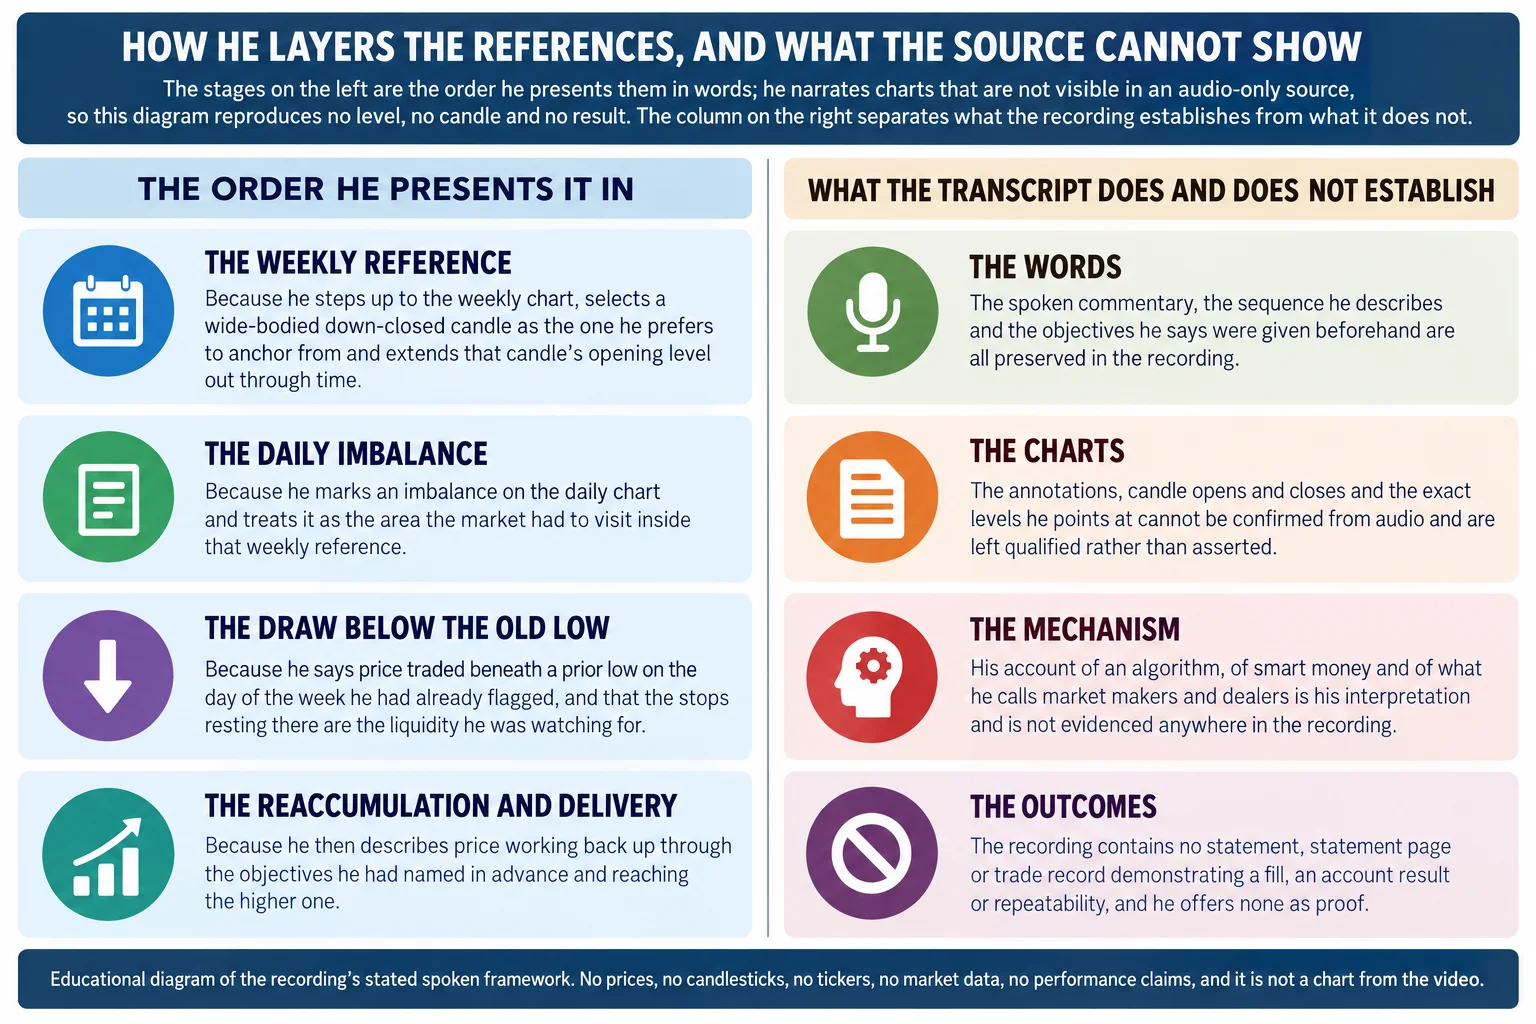
2022 ICT Market Weekly Reference
The move he reconstructs is layered rather than single-signal. In his account price rallied on Tuesday and Wednesday, formed an imbalance, and then had to draw back into that imbalance before continuing (27:30 , 27:37), with the Nasdaq and the E-mini S&P expected to do it in tandem (27:48). He says he had already told viewers the same thing about the S&P in the previous week’s videos (27:57), and he points out that conventional support-and-resistance readings failed across the same stretch, in his phrasing that support left the building (28:04 , 28:25).
He then steps all the way up to the weekly chart (31:39). What he anchors there is a specific candle: he says he prefers a wide-bodied down-closed candle to a thinner one (31:51), and he extends the opening level of that candle out through time as the reference he wants to watch (31:57). In his description the market opened the week (32:29), traded down into that level, accumulated, and then delivered higher toward the weekly objectives he says were set for the E-mini S&P (32:34). He describes price having to come down into a specific higher-timeframe array and names it as the weekly order block (32:20 , 32:25).
He closes the reconstruction with the pre-move call he says he made in public. He reads out what he says is his tweet of 26 July 2022 at 11:52 New York local time (34:00), telling traders to pay under a stated level (34:09), watching the bodies of the candles dig into a fair value gap and never close below that level (34:17). From there he says the objectives he gave for the week were reached: the lower one, then a level he justifies as five points above the midpoint of the range (34:31 , 34:38), and finally the higher one, which he says price handled (34:49).
Two cautions belong with that account. The first is that the recording is his narration of a chart the reader cannot see, so the level, the candle bodies and the eventual prints are uncorroborated here. The second is that a level being reached is not the same as a trade being executed at it: no entry, size, stop or account outcome is described anywhere in the session for this sequence. The midpoint construction he demonstrates (the midpoint between one candle’s high and its low, which he describes as off by a quarter point (35:01 , 35:05)) is offered as a teaching device, not as a tested method.
August 2022 ICT Market Restraint
The practical half of the session is a case for doing less. He describes August as a month of uncertainty (5:15), with holiday absence and reduced participation in the marketplace (5:31), and says he is planning to trade very little of it and probably next to nothing that week (5:57), with payroll data landing on the Friday (6:02). He says he is planning a two-week vacation and saving his effort for September through November (6:10 , 6:41).
His stated instruction to viewers is specific and conservative: August is not a month to push (37:01), use very small leverage rather than a lot of it (37:05), and aim for one setup a week and then stop (37:10). He says the worst thing a viewer can do is push because they think they are ready (37:32), calls August a sloppy month in which his own precision may be off (38:02), says a trader may see something that is not really there (38:16), and attributes that to live streamers expecting something to be present when it was not (38:27).
Two things are worth separating in that advice. The caution itself (that a trader should have conditions under which they stand aside, and should not size up to compensate for unclear conditions) does not depend on any proprietary terminology. The seasonal claim that a particular month is generally poor does depend on evidence this recording does not provide, and he presents it as experience rather than measurement.
What the 2022 ICT Market Session Establishes
He ends on the same theme, with a warning that conditions are going to get harder (39:44) and that employment income is not guaranteed, and he frames the purpose of trading as having an alternative source of income rather than getting rich (40:13). Earlier in the session he had offered to demonst