
Key takeaways
In this July 28, 2022 market commentary, published on the watch page at 28 July 2022 16:38 PDT and listed at 1,142 seconds, the speaker reviews the September-delivery S&P and Nasdaq futures side by side before turning to the US Dollar Index, the British pound and the euro.
Read the full summary
In this July 28, 2022 market commentary, published on the watch page at 28 July 2022 16:38 PDT and listed at 1,142 seconds, the speaker reviews the September-delivery S&P and Nasdaq futures side by side before turning to the US Dollar Index, the British pound and the euro. He says the two index contracts generally move together, with one leading and one weaker, and he says he favoured the S&P because the area he had marked looked more precise to him, while the Nasdaq reached the lower of the two objectives he had given and fell short of the higher one ( 1:00 , 2:22 ). The sequence he walks through is what he calls a Judas swing inside his Power of Three framing: price digs into a previous imbalance, runs the stops beneath relative equal lows, makes the low of the day, then rallies to a high for what he calls a classic open-low-high-close day ( 4:02 ). On the five-minute chart he points to an optimal trade entry, a fair value gap and a run of down-closed candles before the move ( 6:14 ). He says he avoids the Dow and the other index CFDs because he says he is not legally permitted to trade them where he is and finds the Dow too spotty, and that he keeps it only as an SMT comparison ( 7:15 ). On the dollar index he calls the action sloppy and short of where he was aiming, and on the hourly view he points to what he calls a bearish breaker; for the pound he ties his expectation to anticipated dollar weakness and a fair value gap, and for the euro he works between daily imbalances and a short-term shift in market structure ( 13:21 , 17:34 ). He closes by saying his analysis is rooted in New York local time and that he believes the market operates on it, without offering evidence ( 18:10 ). Every level, price and outcome below is what he says about charts that are not visible in an audio-only source; nothing here is a verified fill, a tested edge or investment advice.
How we researched this article
BestProps used document-based research from primary firm sources, checked September 25, 2026. The complete source list, scope, limitations, and commercial-state record appear near the end of this article.
In the July 28, 2022 ICT market commentary, the speaker reviews intraday movement in September S&P and Nasdaq futures before turning to the US Dollar Index, the British pound and the euro. His stated lesson is that related markets can move broadly together while offering different levels of clarity. He says he preferred the S&P setup because its imbalance and the path to his upside area looked more precise to him.
On the source. The watch page lists the publish timestamp as 28 July 2022 at 16:38 PDT and a length of 1,142 seconds, about 19 minutes 2 seconds, and the video as public. The source behind every timestamp link here is an automatic speech-to-text transcription of the recording’s own audio, produced locally with a Whisper large-v3-turbo model. It is not a human-verified caption track, its timestamps are automated, and no visual chart verification was possible. The transcript is not reproduced here and stays private. Every claim below is attributed to what the speaker is transcribed as saying, and the figures he reads out are his narration of charts rather than audited price data.
One limitation shapes the whole piece. This is chart narration: the speaker describes candle opens and closes, levels and timeframe comparisons that are visible only on his screens, and he refers to his own social posts as the record of an example he says he gave. An audio-only source can preserve what he says about those charts; it cannot confirm that any level printed, that any objective was reached, or that any described sequence produced a fill. It is not presented as verified performance data.
ICT Market Commentary on S&P and Nasdaq Clarity
At 1:00 he explains that the S&P and Nasdaq generally move in tandem, with one leading while the other is comparatively weak, and he says that relationship informed his reading after both markets pulled back into the prior day’s range. He reports that the Nasdaq reached the lower of the two objectives he had given and fell short of the higher one, and that the S&P high moved beyond the area he had marked. These figures are statements from his narration; the transcript alone cannot independently verify the chart values, the fills or any trading result ( 0:32 , 0:38 , 1:22 ).
Beginning at 2:22 he compares the two contracts in more detail. His stated reason for focusing on the S&P was a clearly defined area he describes as an imbalance. In his framework an imbalance, or fair value gap, is a portion of price delivery that may later attract a revisit. He says the S&P offered the more precise path toward the upside area he had identified, even though the Nasdaq shared the broader directional expectation ( 2:22 , 3:31 ).
ICT Market Commentary on Sell-Side Liquidity
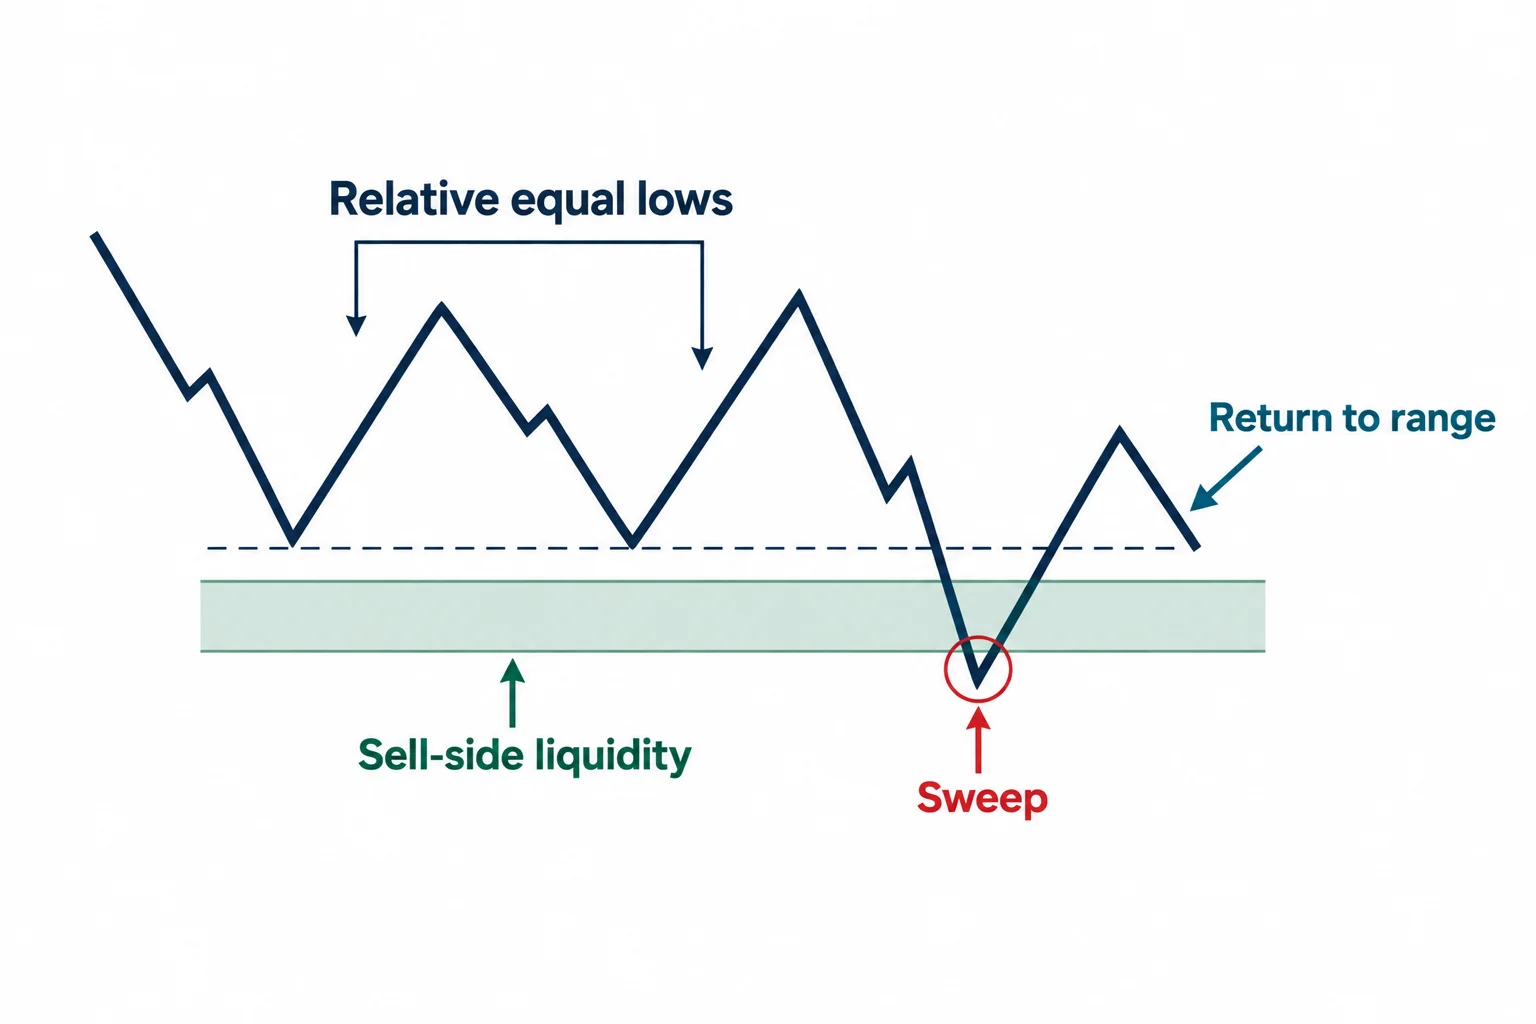
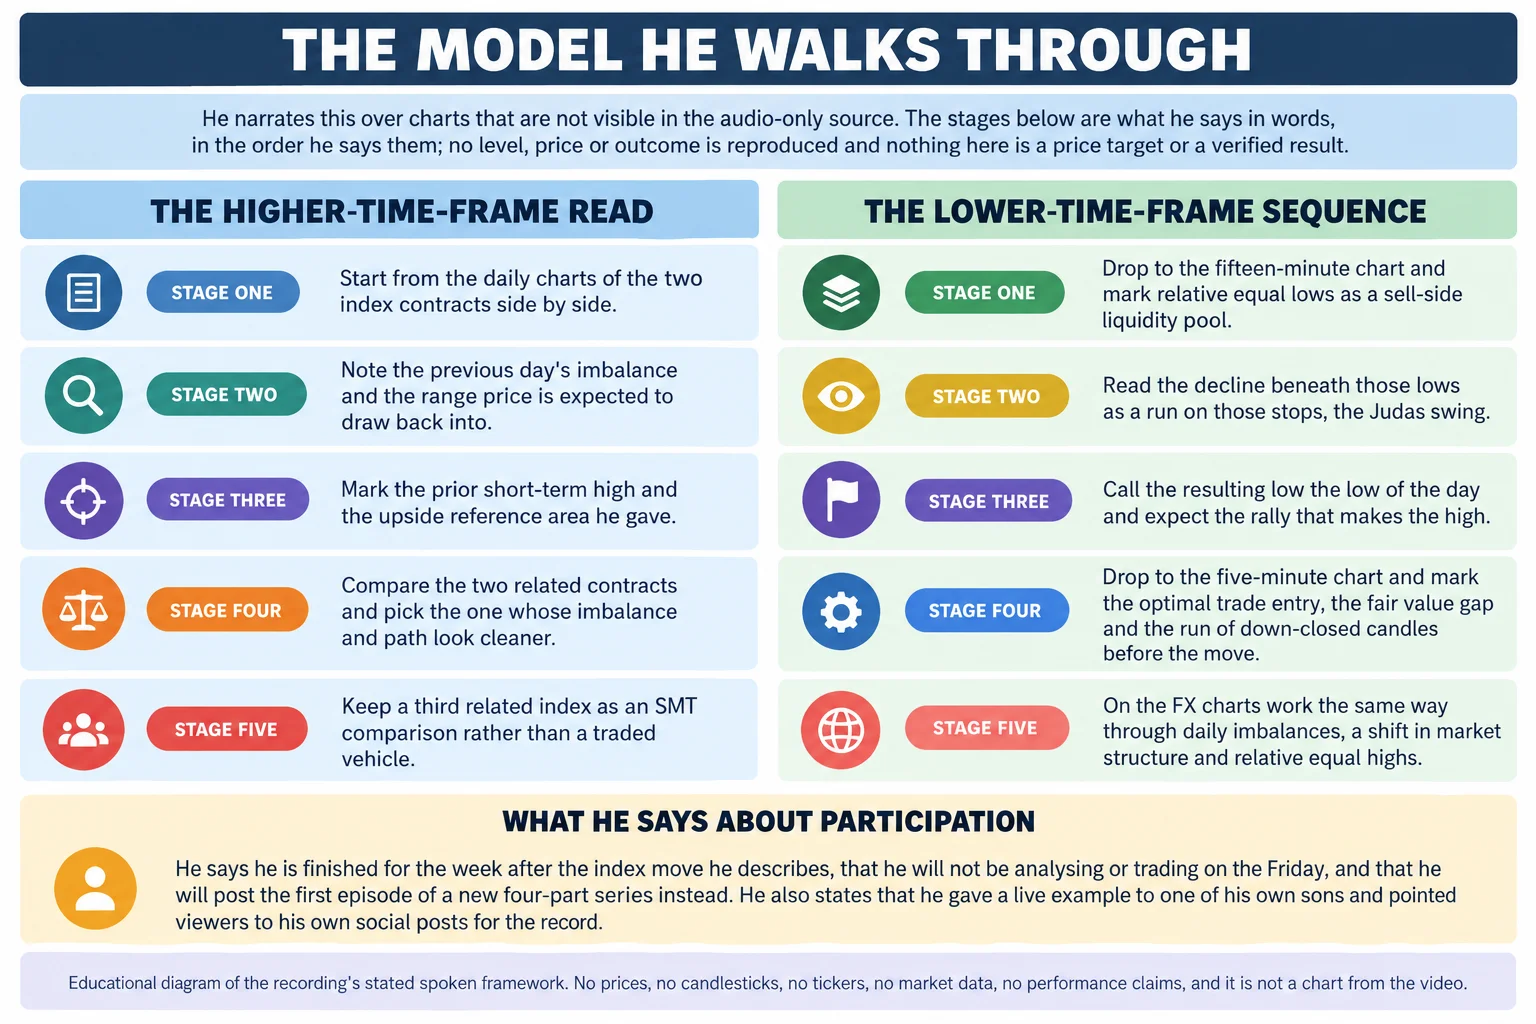
On the 15-minute discussion at 4:02 he identifies relative equal lows and describes the decline beneath them as a run on sell-side liquidity. In his terminology the stops resting beneath visible lows are treated as liquidity. He attributes the drop-in to the previous day’s imbalance, then labels the initial decline a Judas swing inside his Power of Three concept, and lays the sequence out as: price opens and initially trades lower, that move establishes what he calls the low of the day, price subsequently rallies to a high, and a later retreat produces the classic open-low-high-close daily sequence ( 4:02 , 4:48 ).
He applies the same narrative to the Nasdaq, describing a sweep beneath relative equal lows, interaction with an imbalance and a later rally, and saying it reached the lower objective while stopping short of the higher one. By contrast he considered the S&P delivery cleaner. At 6:14 the review drops to a five-minute chart, where he points to what he calls an optimal trade entry, a fair value gap and a group of three down-closed candles before the rally ( 5:31 , 6:14 ).
The teaching point is not merely that price rose. It is that he organised the setup through a higher-time-frame directional idea, a sweep of liquidity and lower-time-frame entry references. Whether that organisation has predictive value is not something the recording or this article establishes.
ICT Market Commentary on Correlated Index Confirmation
He addresses index selection at 7:15. He says he does not trade the Dow or the other index CFDs, giving two stated reasons: he says they are not legally tradeable where he is, and he says he finds the Dow too spotty to be symmetrical. His stated use for it is as an SMT comparison — watching whether one related index fails to make the low that the other makes — rather than as his trading vehicle, and he says one of the two other contracts can be traded while the other serves as a barometer ( 7:15 , 7:58 ).
A general educational takeaway is that correlated instruments do not have to be traded simultaneously: one can be the primary market under study while another acts as a comparison tool. That is his analytical approach. The recording does not demonstrate that divergence or correlation analysis provides a proven edge, and his own reason for preferring one contract over another is a matter of how the chart looked to him.
ICT Market Commentary on Dollar, Sterling and Euro
The cross-market review begins at 13:21. He calls the dollar index action sloppy and says it fell short of the area he was actually aiming for, and on the hourly view he identifies what he calls a bearish breaker and reads the move back into it as supporting another decline ( 13:21 , 14:03 , 14:33 ).
For the British pound he links his bullish expectation to anticipated dollar weakness and highlights a return into a fair value gap before a possible continuation higher, framing it for the following New York session. For the euro he describes price moving between daily imbalances rather than relying on conventional horizontal support and resistance ( 14:55 , 15:18 ).
The euro example becomes more granular at 17:34. On a five-minute chart he describes price digging into a daily fair value gap, a short-term high being taken and a return to a lower-time-frame fair value gap, and he interprets the broken short-term high as a bullish shift in market structure, with relative equal highs and an imbalance left as the subsequent objectives ( 17:34 ).
2022 ICT Mentorship Study Notes
The study notes he implicitly leaves behind are these. Start with a directional thesis on the higher time frame. Compare related indices for leadership, weakness or non-confirmation. Mark prior ranges, visible highs and lows, and the areas he defines as imbalances. Use the lower time frames to study the proposed sequence rather than assuming that every sweep of liquidity will reverse.
He closes by returning to his time convention. At 18:10 he says he will post the first episode of a new four-part series at ten o’clock his local time on the Friday, and that anyone keeping a clock set to New York local time will know what time that is. He states that all of his analysis is rooted in eastern time, that everything in the markets operates on New York local time, and that he is not going to argue the point: he says viewers will have to study it and decide for themselves whether there is any validity to it ( 18:10 , 18:31 ).
This session is best understood as a walkthrough of his own market model and terminology. It does not establish that fair value gaps, liquidity sweeps, SMT divergence or time-based windows are reliably predictive. The recording is educational market commentary, not investment advice or a promise of performance.
Watch the source recording
2022 ICT Mentorship Market Commentary – July 28, 2022
The Inner Circle Trader · watch page lists publish 28 July 2022 16:38 PDT, which is 28 July 2022 in UTC · 1,142 seconds, about 19 minutes 2 seconds · public, not unlisted. This recording is the primary source for every timestamp link on this page.
The recording is not embedded here. An embedded player was tested directly on 16 September 2026 from a BestProps page origin: the frame loads and then reports “Playback on other websites has been disabled by the video owner”, with no playable stream and no duration reported. The link above opens the recording on YouTube itself.
Resources
These are the sources checked while preparing this article. The CFTC page is the regulator’s fraud advisory on commodity trading systems sold online, which notes that hypothetical trading results are typically simulations over historical data rather than real fills. The Investor.gov pages are the SEC’s investor-education entries on technical analysis and on day trading. None of them evaluates this speaker, tests any of the concepts named in the commentary, verifies a level or a result, or endorses anything said in the recording. Any ICT, smart-money or third-party indicator, script, note set or re-upload circulating outside the publishing channel’s own page is unofficial and untested here.
- [1] 2022 ICT Mentorship Market Commentary – July 28, 2022 — The Inner Circle Trader (primary source; watch page read 16 September 2026, published 28 July 2022 16:38 PDT, listed at 1,142 seconds).
- [2] The Inner Circle Trader — official YouTube channel (read 16 September 2026) — the publishing channel for the 2022 mentorship market commentaries this recording belongs to.
- [3] U.S. Commodity Futures Trading Commission — Fraud Advisory: Commodity Trading Systems Sold on the Internet (read 16 September 2026) — the standard applied here to unverified trading claims.
- [4] U.S. Securities and Exchange Commission, Investor.gov — Glossary: Technical Analysis (read 16 September 2026) — the regulator’s plain-language entry for the category of chart-based analysis used in this commentary.
- [5] U.S. Securities and Exchange Commission, Investor.gov — Day Trading (read 16 September 2026) — warns that day trading is extremely risky and that most day traders lose money.
Primary source: ICT, “2022 ICT Mentorship Market Commentary – July 28, 2022”, The Inner Circle Trader; watch page publish 28 July 2022 16:38 PDT, listed at 1,142 seconds. The transcript used was local automatic speech recognition of the recording’s full original audio and is not human-verified captions, so ambiguous wording is qualified rather than corrected silently. The recording’s charts are not reproduced anywhere on this page.
This commentary is for education only and is not investment advice. Trading involves risk, and neither the video nor this summary establishes that any model, timeframe, divergence or time-based window will be profitable.