
Key takeaways
ICT reviews the September 2022 S&P 500 futures contract across daily, hourly, 15-minute and five-minute charts, showing how price moved lower into a previously marked daily fair value gap before reacting during a choppy session that still aligned with his higher-time-frame bearish bias.
Read the full summary
ICT reviews the September 2022 S&P 500 futures contract across daily, hourly, 15-minute and five-minute charts, showing how price moved lower into a previously marked daily fair value gap before reacting during a choppy session that still aligned with his higher-time-frame bearish bias. He publicly flagged 3920 as a reasonable paper or demo profit-taking area and identified only two primary morning setups, both shorts built around gap opening levels, buy-stop runs, broken swing lows, market structure shifts, fair value gaps and bearish order blocks. A later bullish sequence targeted relative equal highs and a potential gap opening but apparently fell just short. ICT defines a draw on liquidity as an area price is likely to gravitate toward, not a guaranteed or static target, and says setups need not reach it to be profitable. He assigns homework comparing hourly ES and Nasdaq charts for SMT divergence, closes his existing trade, enters the next day’s FOMC announcement flat with no bias, calls announcement trading casino time, may avoid trading afterward and explicitly says his conditional scenario is not a buy or sell signal. The public YouTube recording was published July 26, 2022, runs about 12 minutes 46 seconds and relies here on automated Whisper large-v3-turbo transcription without human caption or chart verification.
How we researched this article
BestProps used document-based research from primary firm sources, checked September 25, 2026. The complete source list, scope, limitations, and commercial-state record appear near the end of this article.
In the 2022 ICT Mentorship Index Market Review for July 26, 2022, ICT examines intraday price action in the September 2022 S&P 500 futures contract. His central observation is that the market moved toward a higher-time-frame area he had identified, but that the morning session was irregular and difficult to read. The review is less a presentation of one ideal setup than a demonstration of how he organised a complicated session, moving from the daily and hourly charts down to the 15-minute and five-minute charts.
On the source. The watch page lists this recording as public, titled “2022 ICT Mentorship Index Market Review – July 26, 2022”, published 26 July 2022 at 16:55 PDT, and listed at 766 seconds, about 12 minutes 46 seconds. The source behind every timestamp link on this page is an automatic speech-to-text transcription of the recording’s own audio, produced locally with a Whisper large-v3-turbo model, not human-verified captions and not YouTube’s caption track. Its timestamps are automated and no visual verification of the charts was possible. The transcript is not reproduced here and stays private. Every statement below is attributed to what the speaker is transcribed as saying, and the price levels he reads out are his narration of charts rather than audited market data.
July 26 ICT Index Market Review
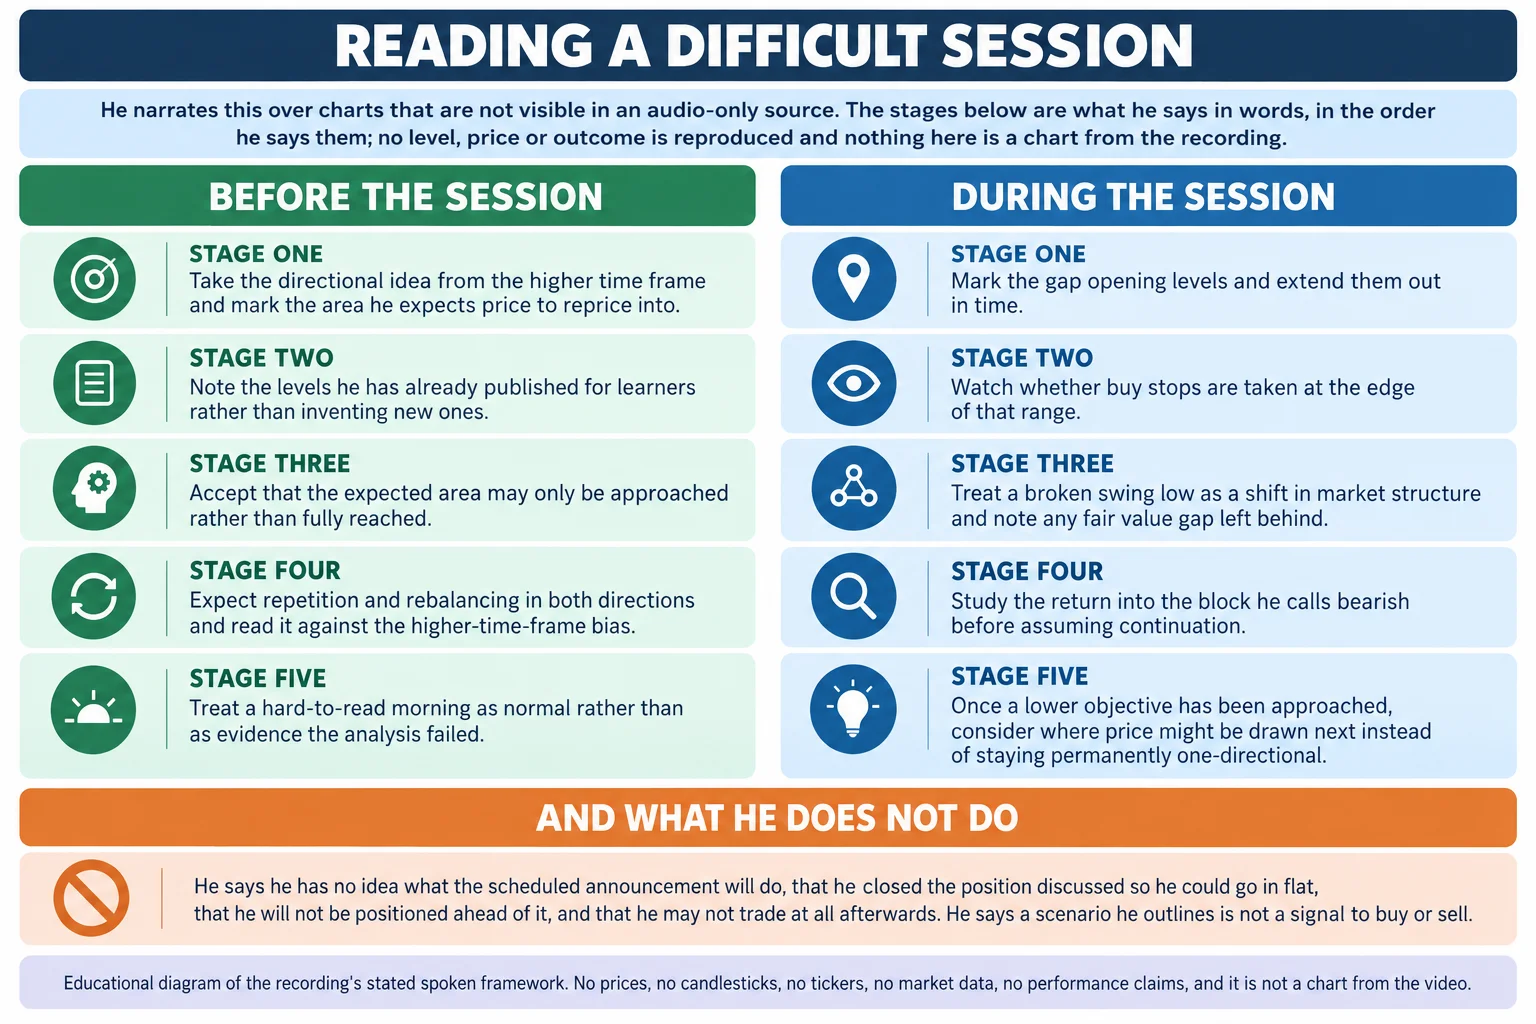
He opens on the daily chart, saying he had expected price to work lower and reprice into a daily fair value gap he had identified in the previous week’s review. In his account the day delivered broadly in that direction and then reacted from the area. He adds that he was trading that reaction late in the prior afternoon, which is the position he later says he closed (0:26, 0:49, 0:57). Before going further he states that he has no idea what the FOMC announcement will do, and that his students sit still and wait for the release rather than positioning in advance (1:13, 1:18).
He describes the review as a walk through fair value gaps, gap opening levels, relative equal lows, market structure shifts and possible liquidity objectives across several time frames. That framing matters for reading what follows: it is explanatory chart narration, and the recording does not present independently verified price data.
ICT Market Context and the Morning Decline
He characterises the morning as brutal because it contained substantial back-and-forth movement rather than one-sided delivery. He says that repetition (price moving down, rebalancing, coming back up and rebalancing again) can wear a student down, that it causes new traders to second-guess the things he teaches, and that this is normal rather than evidence the analysis was wrong. For contrast he says he prefers sessions with clean, symmetrical price action where the imbalances and the buy-side or sell-side stops are obvious (3:37, 4:17).
On the 15-minute chart he points to the daily fair value gap as the shaded level, then walks through a gap opening level extended out in time, another fair value gap being closed in, and a shift in market structure after a stop run, before price began to work lower (2:49, 3:10). His stated practical lesson is that choppy delivery should be read against the higher-time-frame bias (in this case what he calls the bearish bias and the daily fair value gap below price) instead of being treated as a series of fresh signals (6:40).
The ICT Market Level Flagged Publicly
He says he had been posting that day and had outlined a level he refers to as “3920”, telling readers that expecting profit taking there was a reasonable idea, and that learners should be taking profits on paper and demo trades while they study. He then points to the candle bodies clustering near what he calls “that 20 level”, noting that a couple of wicks traded below it before price accumulated and went higher (2:10, 2:16, 2:31). The transcript also records him referring to trading below relative equal lows before that discussion (2:10).
Two qualifications apply. First, automatic transcription renders spoken numbers imperfectly, so the exact figure he read out is transcribed with uncertainty and is presented here as his stated level rather than as verified price data. Second, this is session commentary about a level he had published, not evidence that such levels behave the same way in other markets or periods. The source does not provide the chart images needed to independently verify the markings, the exact candles or any execution detail.
Five-Minute ICT Market Setups and Structure
Dropping to the five-minute chart, he marks the gap opening level and extends it out in time, saying he is not working from supply-and-demand or wave-count methods. He describes buy stops being taken at the low end of that gap, a swing low being broken, and that break representing a shift in market structure, with a fair value gap left behind. He notes that where two small gaps appear close together he expects price to run into them, and that price then comes back up into what he calls a bearish order block before continuing lower, with the underlying fair value gap as what it has to “submit” to (4:59, 5:24, 5:39).
He states that the morning produced only two primary setups, both shorts: the one traced above following the stop run and structure shift, and a second shortly before lunch that again showed a fair value gap with a shift in market structure. He points viewers to the two places on the chart rather than claiming a high number of opportunities (7:01, 7:08).
After price dug below that low, he shifts to a possible bullish sequence rather than staying one-directional: he says he would rather look for strength than fight that type of movement, referencing an optimal trade entry, buying strength into running relative equal highs, and price digging back up toward a potential gap opening. Reviewing it, he says it looks like the move fell just short of that level (7:40, 7:47, 8:01).
Why ICT Market Liquidity Draws Are Not Guaranteed Targets
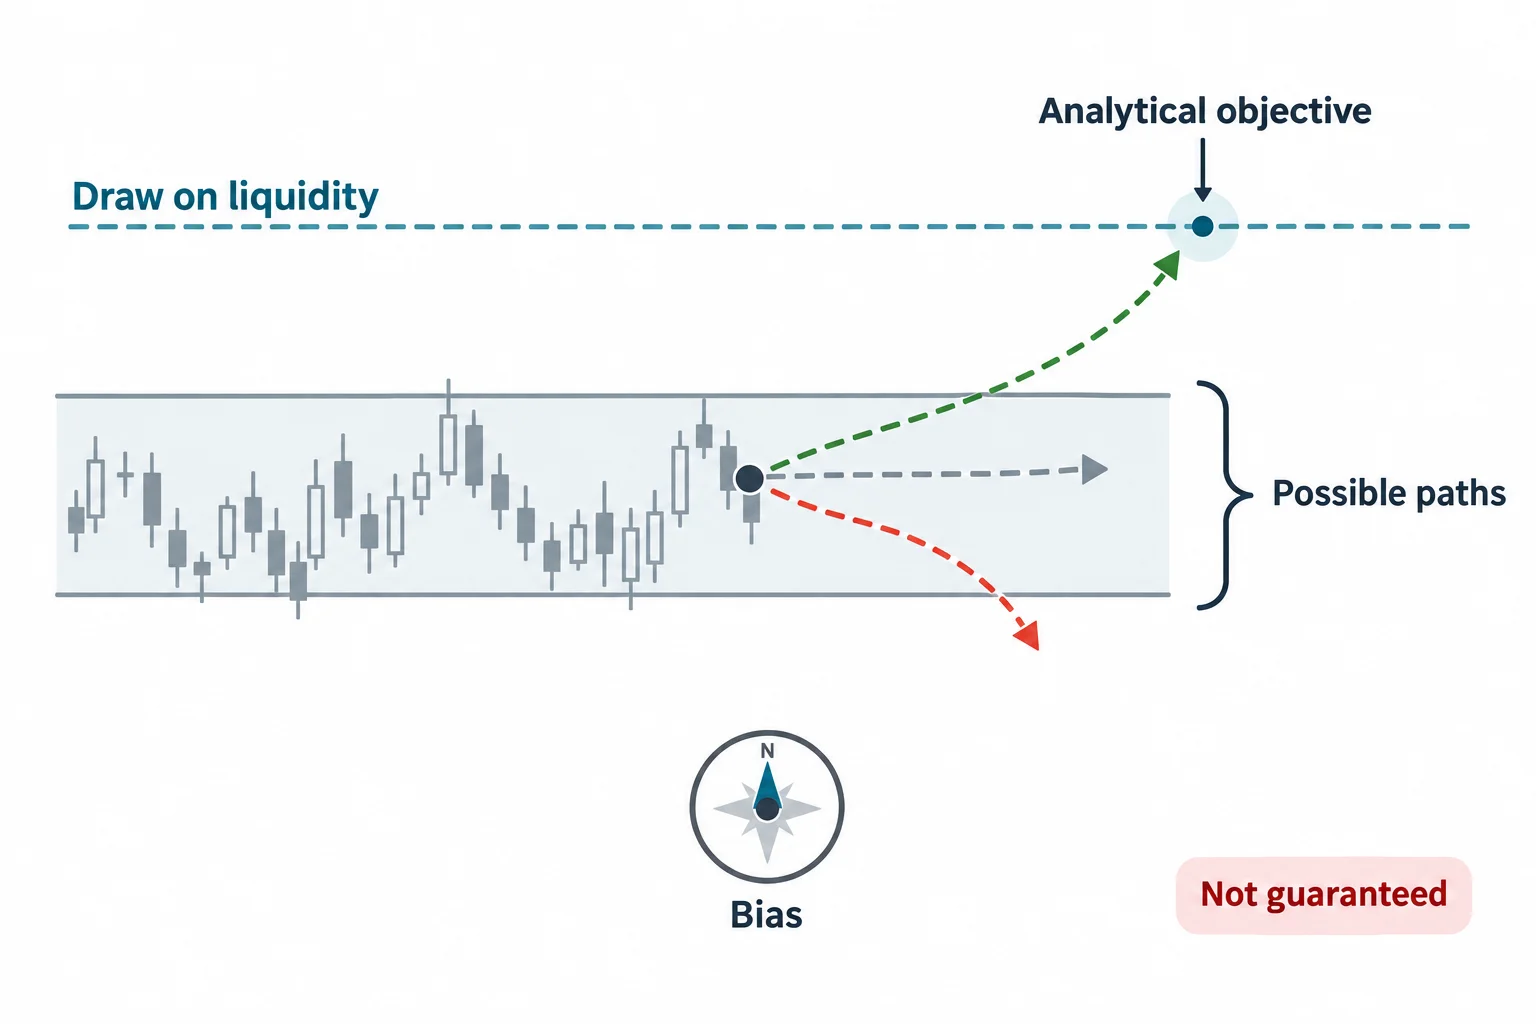
One of the clearest conceptual qualifications in the recording comes at the point where he has just reviewed how close price came to the gap opening level. He then explains the phrase he uses: a draw on liquidity is not a definitive target, not a static target, and not cast in stone, but simply where price is likely to gravitate. He adds that the actual draw does not have to be hit, traded to or repriced to for his setups to produce what he calls profitability. The concept is there to frame the bias, and logical levels for taking profits are considered if and when price arrives (8:03, 8:12, 8:26).
The distinction matters because an analytical objective is easily mistaken for an assurance about where the market must go. The general reading (which is interpretation, not a claim that his terminology provides a tested edge) separates three questions:
- What higher-time-frame area provides directional context?
- What lower-time-frame behaviour would support that interpretation?
- Where would the interpretation become less useful or no longer apply?
ES and Nasdaq Divergence in the ICT Market
Back on the 60-minute chart he identifies the level he says he had in mind initially as the draw on liquidity, then assigns homework rather than walking through it: compare the hourly Nasdaq chart with ES. He notes that where this fair value gap formed on ES, the Nasdaq was able to move down into its own fair value gap, that it then failed to go lower, and that price extrapolated to the upside and returned into the gap. He calls this a bit of an SMT divergence (9:31, 9:52, 9:55).
He is explicit that this is left as an exercise. Because the source is an automatically transcribed recording without chart images, the precise contracts, comparative swing points and plotted zones cannot be independently reconstructed from the narration alone, and the recording does not establish that divergence between related markets has predictive value.
Why ICT Avoided the Market Before FOMC
He explains that he is marking a level for his own use overnight to watch how price reacts to it, and that he will extend it only if necessary. He then says it may not reach that level at all, which is why he closed the trade seen at the opening of the video, and that he wants to be flat with a clean slate going into the FOMC the next day (10:25, 10:33, 10:37). He states that he has no real bias, does not know what the market will do, and has to wait and see what happens at the announcement, which he describes as very volatile and painful if you find yourself offside. He calls trying to capitalise on it “casino time” trading and says it is not what he promotes (10:45, 10:54, 11:18).
He summarises the day as a sloppy morning that ultimately delivered with his bias, and repeats that he has no bias for the next session. He then offers one conditional scenario: that price could run up, reject and come down into an area he marks after the announcement. He immediately attaches conditions to it, that he will not be positioned to participate if it happens, that such an outcome would be a moral victory rather than anything more, that he will not be positioned ahead of FOMC, and that he may not trade at all afterwards depending on how the market looks. He tells viewers not to treat the scenario as a secret or subliminal instruction to buy or sell, but to keep their hands off, study price and see how it behaves (11:32, 11:44, 12:09, 12:21).
The broader educational takeaway is restraint rather than prediction. He presents a bearish reading of the reviewed session, acknowledges that the morning was difficult, and declines to convert a possible FOMC scenario into a trade instruction. Historical chart commentary is not investment advice, and the recording alone does not establish fills, profitability or subsequent results.
Watch the July 26 ICT Session Recording
2022 ICT Mentorship Index Market Review – July 26, 2022
The Inner Circle Trader · watch page lists publish 26 July 2022 16:55 PDT · 766 seconds, about 12 minutes 46 seconds · public, not unlisted. This recording is the primary source for every timestamp link on this page.
The recording is not embedded here. An embedded player was tested directly on 16 September 2026 from a BestProps page origin at both desktop and mobile widths: the frame loads and then reports “Playback on other websites has been disabled by the video owner”, with no playable stream and no duration reported. The link above opens the recording on YouTube itself.
2022 ICT Mentorship Resources
These are the sources checked while preparing this article. [3] is the regulator’s fraud advisory on commodity trading systems sold online, which notes that hypothetical trading results are typically simulations using historical data rather than real fills. [4] is the SEC’s investor-education entry on day trading, which warns that it is extremely risky. None of them evaluates this speaker, tests any of the concepts named in the review, verifies a level or a result, or endorses anything said in the recording. Any ICT, smart-money or third-party indicator, script, note set or re-upload circulating outside the publishing channel’s own page is unofficial and untested here.
- [1] 2022 ICT Mentorship Index Market Review – July 26, 2022 The Inner Circle Trader (primary source; watch page read 16 September 2026, published 26 July 2022 16:55 PDT, listed at 766 seconds).
- [2] The Inner Circle Trader (official YouTube channel) (read 16 September 2026), the publishing channel for the 2022 mentorship index market reviews this recording belongs to.
- [3] U.S. Commodity Futures Trading Commission, Fraud Advisory: Commodity Trading Systems Sold on the Internet (read 16 September 2026), the standard applied here to unverified trading claims and hypothetical results.
- [4] U.S. Securities and Exchange Commission, Investor.gov, Day Trading (read 16 September 2026), warns that day trading is extremely risky and can result in substantial financial losses in a very short period of time.
Primary source: ICT, “2022 ICT Mentorship Index Market Review – July 26, 2022”, The Inner Circle Trader; watch page publish 26 July 2022 16:55 PDT, listed at 766 seconds. The transcript used was local automatic speech recognition of the recording’s full original audio and is not human-verified captions, so spoken numbers and ambiguous wording are qualified rather than corrected silently. The recording’s charts are not reproduced anywhere on this page.
This commentary is for education only and is not investment advice. Trading involves risk, and neither the recording nor this summary establishes that any described model, level, gap or timeframe produced a profitable outcome.