
Key takeaways
This 2022 ICT Mentorship index market review for July 19, 2022 covers one market only, the S&P 500 (0:11), and the speaker opens by sending viewers back to his separate video of 18 July 2022 for the context (0:17 , 0:24), saying that otherwise the review will look like hindsight (0:45).
Read the full summary
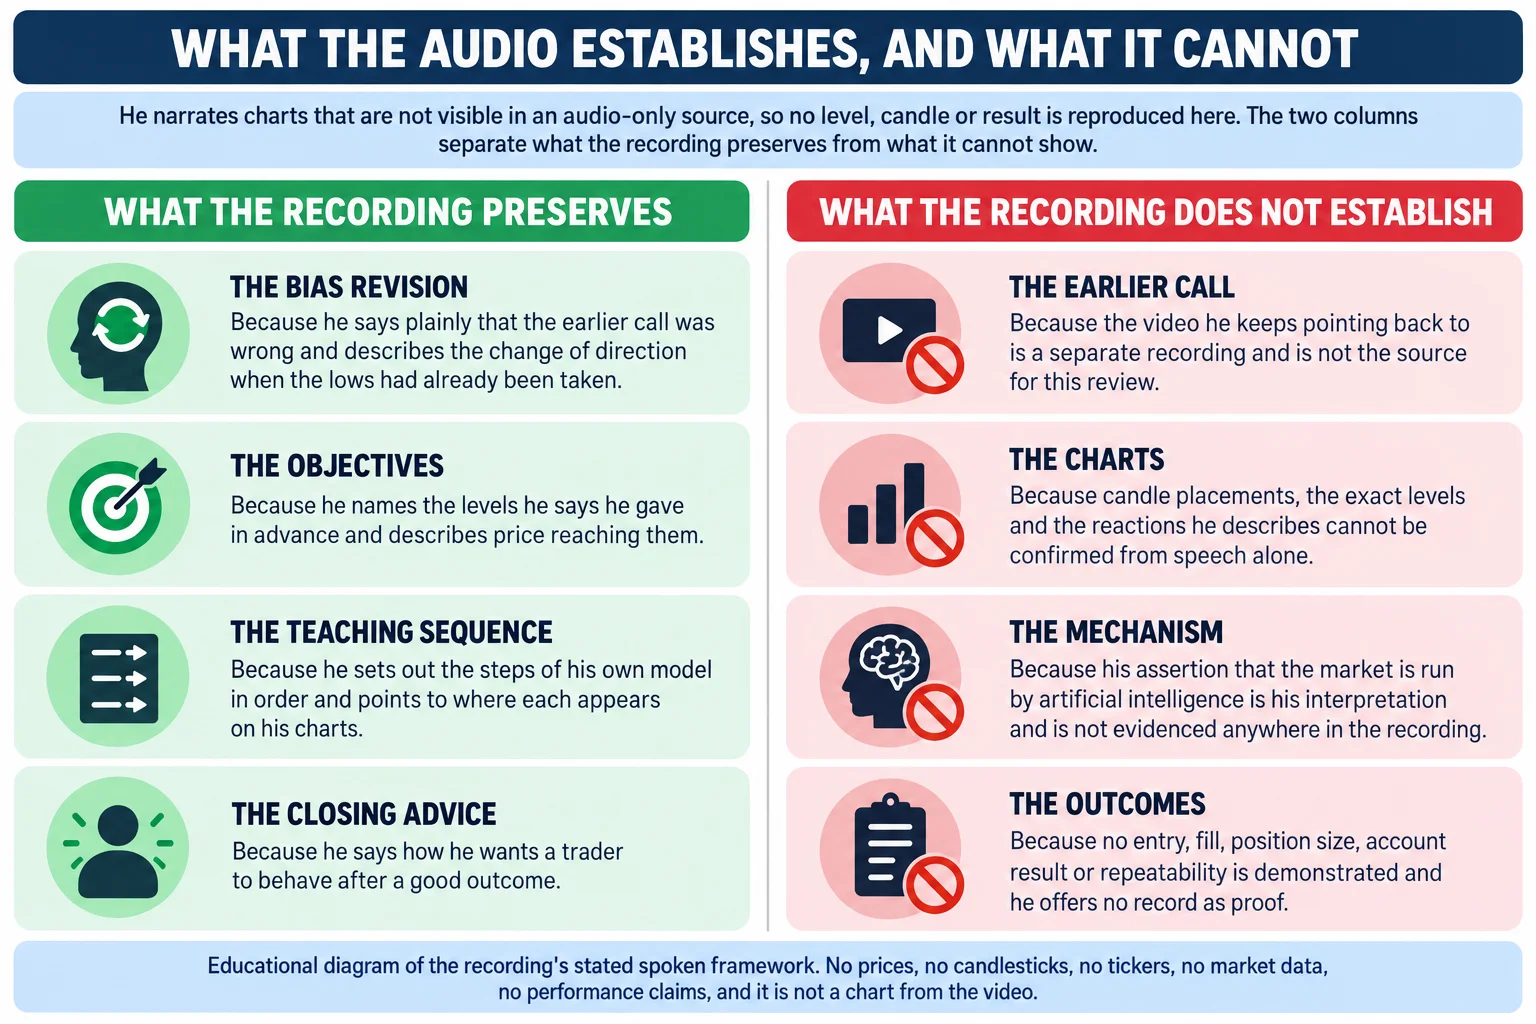
This 2022 ICT Mentorship index market review for July 19, 2022 covers one market only, the S&P 500 (0:11), and the speaker opens by sending viewers back to his separate video of 18 July 2022 for the context (0:17 , 0:24), saying that otherwise the review will look like hindsight (0:45). On the daily chart he describes lows already swept and price pulled back into its range (2:59), and says his earlier call had been wrong before he turned his attention to the liquidity resting above the prior highs (3:05 , 3:12). He names three objectives and reports price trading up into each of them (4:02 , 4:12 , 13:56), then walks the session through the 15-minute and five-minute charts, calling a post-midnight sweep of relative equal lows a Judas swing (4:29 , 4:41) and a retracement into an extended weekly opening gap the support he was watching for (5:21 , 5:38). He reduces the session to the sequence he teaches: sell-side liquidity taken, a rally with displacement, a short-term high broken, the imbalance that move left behind, and a retracement into it as the entry area (12:45 , 13:15). He closes by saying the setup is not something to expect every day, that the bias should follow the draw on liquidity, and that once a good opportunity is taken the trader is done for the week (14:56 , 14:56 , 14:56). The recording is his narration of charts an audio-only source cannot show, contains no verified entry, fill or account result, and includes an assertion that the market is run by artificial intelligence that the recording does not evidence (10:21).
How we researched this article
BestProps used document-based research from primary firm sources, checked September 25, 2026. The complete source list, scope, limitations, and commercial-state record appear near the end of this article.
This article is a transcript-grounded summary of one recording: 2022 ICT Mentorship Index Market Review – July 19, 2022, published on The Inner Circle Trader channel. The watch page lists the publish timestamp as 19 July 2022 at 19:44 PDT and a length of 992 seconds, about 16 minutes 32 seconds, and the video as public. Because 19:44 Pacific on 19 July is 20 July in UTC, an inventory entry can legitimately carry either calendar day; the speaker opens by calling it the July 19, 2022 review and refers viewers to a separate video dated July 18 (0:11 , 0:24). This article keeps the watch-page timestamp explicit rather than treating the two calendar days as a contradiction.
The source behind every timestamp link is an automatic speech-to-text transcription of the recording’s own full audio, produced locally with a Whisper large-v3-turbo model. It is not a human-verified caption track. Its provenance header records that the timestamps are automated and that there is no visual chart verification, so ambiguous wording and numbers are flagged in place rather than silently corrected. The transcript is not reproduced here and stays private.
Numbers stated in the review. The speaker lists his upside objectives as 3,950, 3,922 and 3,909 and a half (4:12), and later gives the lowest of those as 3,909 and three quarters (13:56). Both renderings of that final figure come from the same automated transcription, which is why this article records both instead of silently choosing one. He also refers to partial exits above 3,922 and at 3,950 (6:21). None of these levels is presented here as verified market data: the recording is his narration of a chart the reader cannot see.
One limitation shapes the whole piece. The review is retrospective: it points back to an analysis given the previous evening and to his posts during the session, neither of which is part of this source. An audio-only transcript can preserve what he says he published and what he says he saw; it cannot confirm when any call was published, that any level printed, or that any described sequence produced a fill.
2022 ICT Mentorship Index Market Review July 19: Scope and Context
He starts by narrowing the scope: this is a short review, he will not cover any additional markets, and it will be the S&P 500 only (0:11). He then asks viewers to go back and watch the video prior to this one (0:17), and explains why: the analysis he is about to reconstruct came from that earlier material, so without it this recording will look like hindsight (0:45).
He also asks a favour with a stated reason. He says that if viewers watched his analysis the night before and followed his tweets through the session, he would appreciate them saying so, and he explains that he is asking for the sake of a viewer who has no access to Twitter and has been told by critics that he deletes his tweets or hides calls he got wrong (1:15). He says he has never deleted a tweet (2:05). The recording preserves that statement; it cannot verify his posting history, and the earlier video and the tweets themselves are not part of this source.
The Daily and Hourly Read, and the Objectives He Names
The market discussion begins on the daily chart (2:53). In his account the preceding lows had already been swept and price had pulled back up and retraced (2:59), and he states plainly that he got the call wrong initially on Monday (3:05). What he was then interested in was the liquidity sitting at the prior highs, which he identifies as where the buy-side pools were (3:12).
His reasoning, as he gives it, is that sell-side liquidity had already been taken and price had returned into its range, so the more likely draw was upward (3:25 , 3:19). On the hourly chart he says price had dropped into a discount relative to a selected low-to-high range (3:32 , 3:40), that a further attempt below the relative equal lows was not needed for his scenario (3:46), and that he was pointing attention at higher prices rather than calling for lower ones (3:57).
He then names the objectives he says he gave in advance (4:02) and reports price trading into each: the highest first in his recap, then the second, then the lowest, which he reads as 3,909 and a half (4:12). Later in the session, reviewing the same run, he gives that lowest level as 3,909 and three quarters and describes it as his next objective (13:56), and he reports the highest level being hit (14:12). Because both renderings of the lowest figure come from the same automated transcription, the exact value is left qualified rather than resolved. Nothing here establishes that these levels printed as he describes.
The 15-Minute Session, the Judas Swing and the Weekly Opening Gap
He drops to the 15-minute chart for the session itself (4:24). His account is that price consolidated and formed relative equal lows, and that after midnight New York local time a relatively equal low printed with only a small rally first (4:29). He calls that construction a Judas swing, notes that it took out the relative equal lows (4:41), and says price then moved meaningfully higher with energy (4:45). On that chart he calls the result a shift in market structure (4:53).
The weekly opening gap is the other half of that section. He says he had already raised it the night before and had said to extend the gap forward in time (5:21), that he wanted to see price trade above it and then come back down into it to find support (5:27 , 5:38), and he contrasts that with supply-and-demand teaching, saying he does not teach that approach (5:38), because what he is marking are the levels he believes the algorithm refers back to (5:53). He points to the old low of the gap made on Sunday as the level price revisited (5:58).
He also describes how he manages a partial-exit sequence, naming a fair value gap as one partial (6:08), then a second fair value gap, then the pools above, with further partials above 3,922 and at 3,950 (6:21). He acknowledges that a trader without enough equity to hold more than one contract has to manage the position with the stop instead (6:21 , 6:41), and frames that as something experience resolves (6:55). That is his description of how he handled this session; it is not personalised position-sizing guidance and no fill, size or account outcome is described.
Candle Bodies, the Five-Minute Gap, and the Objection He Anticipates
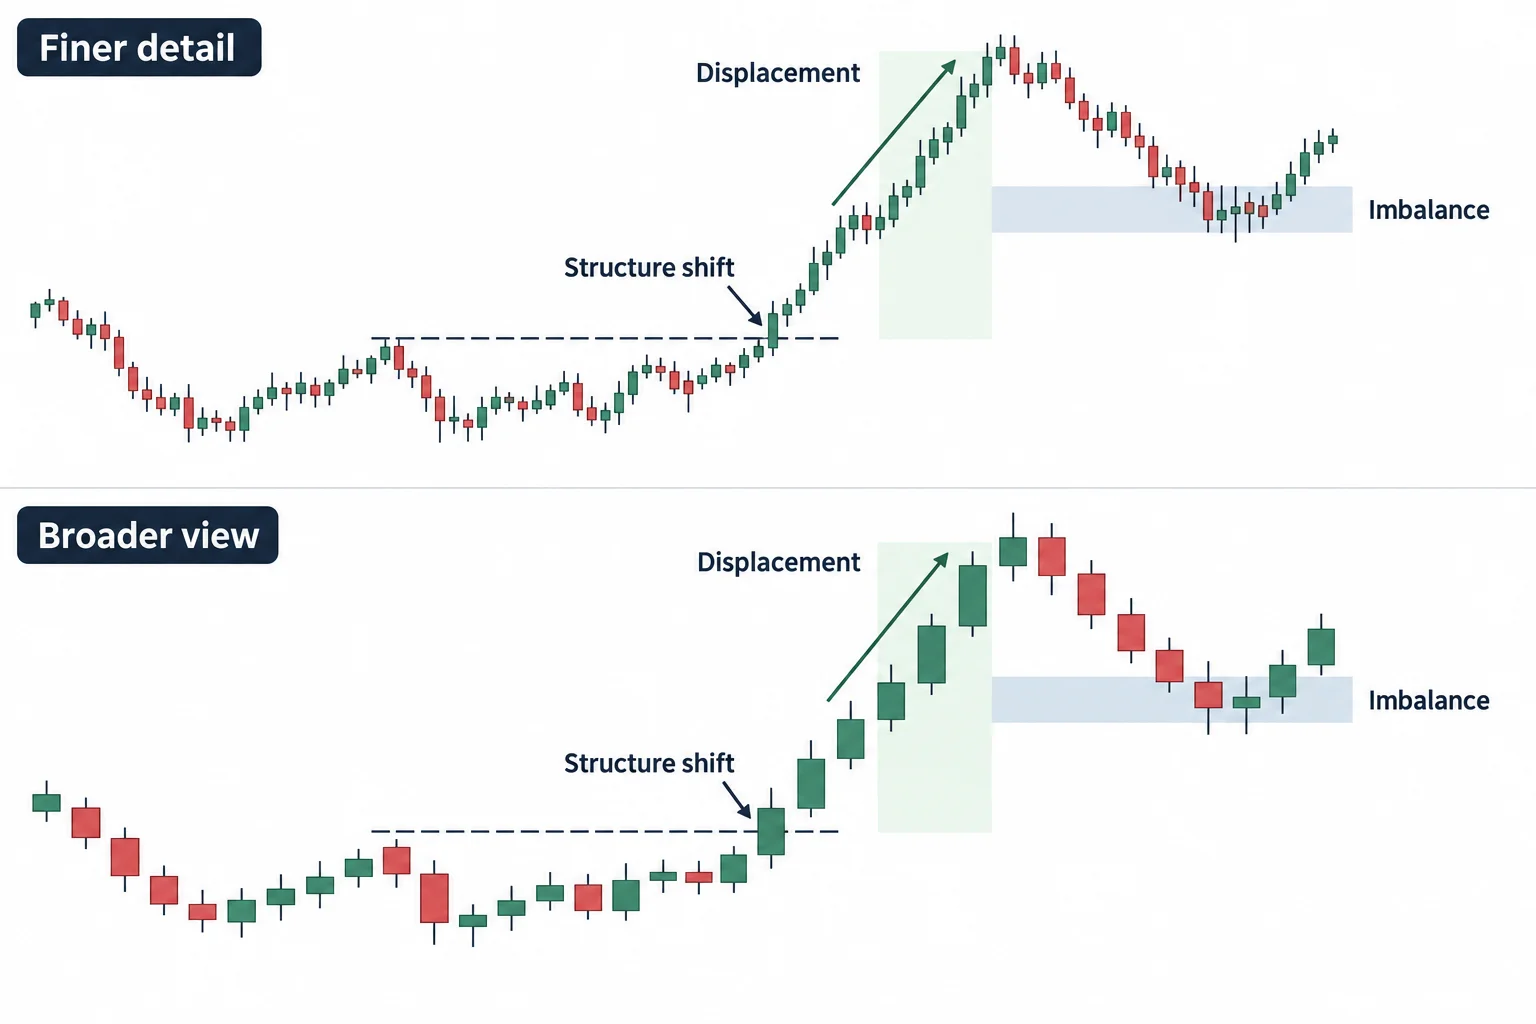
He then zooms into the same area on the 15-minute chart again (7:19) and, working down to the five-minute view, asks whether price dropped into the imbalance after a shift in market structure and whether there was displacement, answering yes to both (7:47). His point about the charts is about readability: he says students following along were calling the action sloppy and messy (8:12) because they were working from one- and five-minute charts (8:16), and that he told them to step up to the 15-minute view where the same delivery was clearer (8:29).
What he calls delivery is the sequence he had outlined the night before: price trading down into the level he had named, repricing higher, and forcing traders who were short either to cut or to get stopped, which in his description induces buying and feeds itself toward the buy-side pool (8:41 , 9:00 , 9:02). On the five-minute chart he points at the fair value gap he had flagged as the key one for the morning (9:15), and draws attention to the candle bodies respecting it (9:26), describing the result as pristine delivery and noting that he still sees small tails at the edges (9:30). All of that is his reading of a chart this source cannot show.
He adds a practical note about checking his calls rather than taking them on trust: he says viewers can paste the TradingView link he posted into a chart of the S&P and see for themselves when he was saying what (11:07). He also frames the period he is discussing as the New York morning session for index trading, dropping into the gap, making the low and then sending price higher (11:26), and he anticipates the objection that an opening gap is not something a trader would use, replying that he had outlined it in advance and given his reasoning for it (11:39). He does describe such levels as a real form of support and resistance, with the caveat that this is if those terms are used at all (12:06).
The 2022 ICT Mentorship Entry Model, Stripped Back
He then strips the session back to the model itself (12:32). In his telling, what viewers are used to seeing on his channel is sell-side taken, a rally, displacement, a drop into the opening period, sell-side taken again, a short-term high taken out, displacement, and the fair value gap that follows (12:45). That gap, he says, is the entry the 2022 free mentorship teaches, after which price runs to the objectives (13:15 , 13:21).
On the 15-minute chart he points to a down-close candle whose high he extends forward and to the candle touching the order block as price dropped into the low of the gap (13:33 , 13:39), then walks the levels he says price reached in order: his next objective, then 3,922, then 3,950, which he says was nailed handsomely (13:56 , 14:07 , 14:12). He uses the specificity of that list to argue that he is not offering multiple-choice calls, saying what he teaches and what the algorithm repeats are specific (14:44 , 14:26).
One claim in this section is different in kind from the rest. He says the move had nothing to do with supply and demand or buying and selling pressure, and that it is artificial intelligence running these markets, with traders either in alignment with it or not (10:21). That is an assertion about market mechanics. The recording offers no evidence for it, so it is recorded here as his interpretation rather than as an established fact.
Discipline After a Good Opportunity
The closing section is the part that does not depend on his terminology. He says it is not important to see this every day or to expect it every day (14:56), and that what a trader should be doing is identifying where the draw on liquidity is and sticking to that bias (14:56). He points to the previous day as an example of the opposite outcome, saying viewers watched him get it wrong and that he had to compensate for it (14:56).
His instruction at the end is about stopping: when a setup of this kind is taken, he says, the trader is done and does not go back in for the rest of the week (14:56), and he anticipates the resistance to that, arguing the answer is to be content with enough (15:38). He signs off by mentioning the work he has to do for a new series titled “Ends” (15:44).
Read as education rather than as a market call, the transferable content is the discipline rather than the levels. A trader is told to identify the draw, hold the corresponding bias only while its premise is valid, and treat one satisfactory opportunity as the objective for the week. What the recording does not supply is any evidence that the sequence has an edge, that the objectives were published when he says they were, or that the outcomes he describes were achieved.
Watch the source recording
2022 ICT Mentorship Index Market Review – July 19, 2022
The Inner Circle Trader · watch page lists publish 19 July 2022 at 19:44 PDT, which is 20 July 2022 in UTC · 992 seconds, about 16 minutes 32 seconds · public, not unlisted. This recording is the primary source for every timestamp link on this page.
The recording is not embedded here. An embedded player was tested directly on 16 September 2026 from a BestProps page origin: the frame loads and then reports “Playback on other websites has been disabled by the video owner”, with no playable stream and no duration reported. The link above opens the recording on YouTube itself.
Resources
These are the sources checked while preparing this article. The two CFTC pages are the regulator’s fraud advisories on forex and on commodity trading systems sold online, and the Investor.gov page is the SEC investor-education entry on day trading. None of them evaluates this speaker, tests any of the concepts named in the review, verifies a level or a result, or endorses anything said in the recording. Any ICT, smart-money or third-party indicator, script, note set, chart annotation or re-upload circulating outside the publishing channel’s own page is unofficial and untested here.
- [1] 2022 ICT Mentorship Index Market Review – July 19, 2022 — The Inner Circle Trader (primary source; watch page read 16 September 2026, published 19 July 2022 at 19:44 PDT, listed at 992 seconds).
- [2] The Inner Circle Trader — official YouTube channel (read 16 September 2026) — the publishing channel for the 2022 mentorship market reviews this recording belongs to.
- [3] U.S. Commodity Futures Trading Commission — Fraud Advisory: Foreign Currency (Forex) Fraud (read 16 September 2026) — warns that the forex market is volatile and carries substantial risk, and that promises of profit are a common scam marker.
- [4] U.S. Commodity Futures Trading Commission — Fraud Advisory: Commodity Trading Systems Sold on the Internet (read 16 September 2026) — notes that hypothetical trading results are typically simulations over historical data rather than real fills.
- [5] U.S. Securities and Exchange Commission, Investor.gov — Day Trading (read 16 September 2026) — the regulator’s plain-language warning that day trading is extremely risky and can result in substantial losses in a very short period. Background only; it does not address this lesson.
Primary source: ICT, “2022 ICT Mentorship Index Market Review – July 19, 2022”, The Inner Circle Trader; watch page publish 19 July 2022 at 19:44 PDT (20 July 2022 UTC), listed at 992 seconds. The transcript used was local automatic speech recognition of the recording’s full original audio and is not human-verified captions, so ambiguous wording is qualified rather than corrected silently. The recording’s charts are not reproduced anywhere on this page.
This commentary is for education only and is not investment advice. Futures and index trading involve substantial risk, and neither the video nor this summary establishes that any pattern, level or model will be profitable.