
Key takeaways
2022 ICT Mentorship Episode 5 at https://www.youtube.com/watch?v=N29ZJ-o31xs presents ICT’s educational framework for organizing E-mini S&P 500 and Nasdaq futures trading around New York session timing, liquidity, displacement, fair value gaps, and daily directional expectations.
Read the full summary
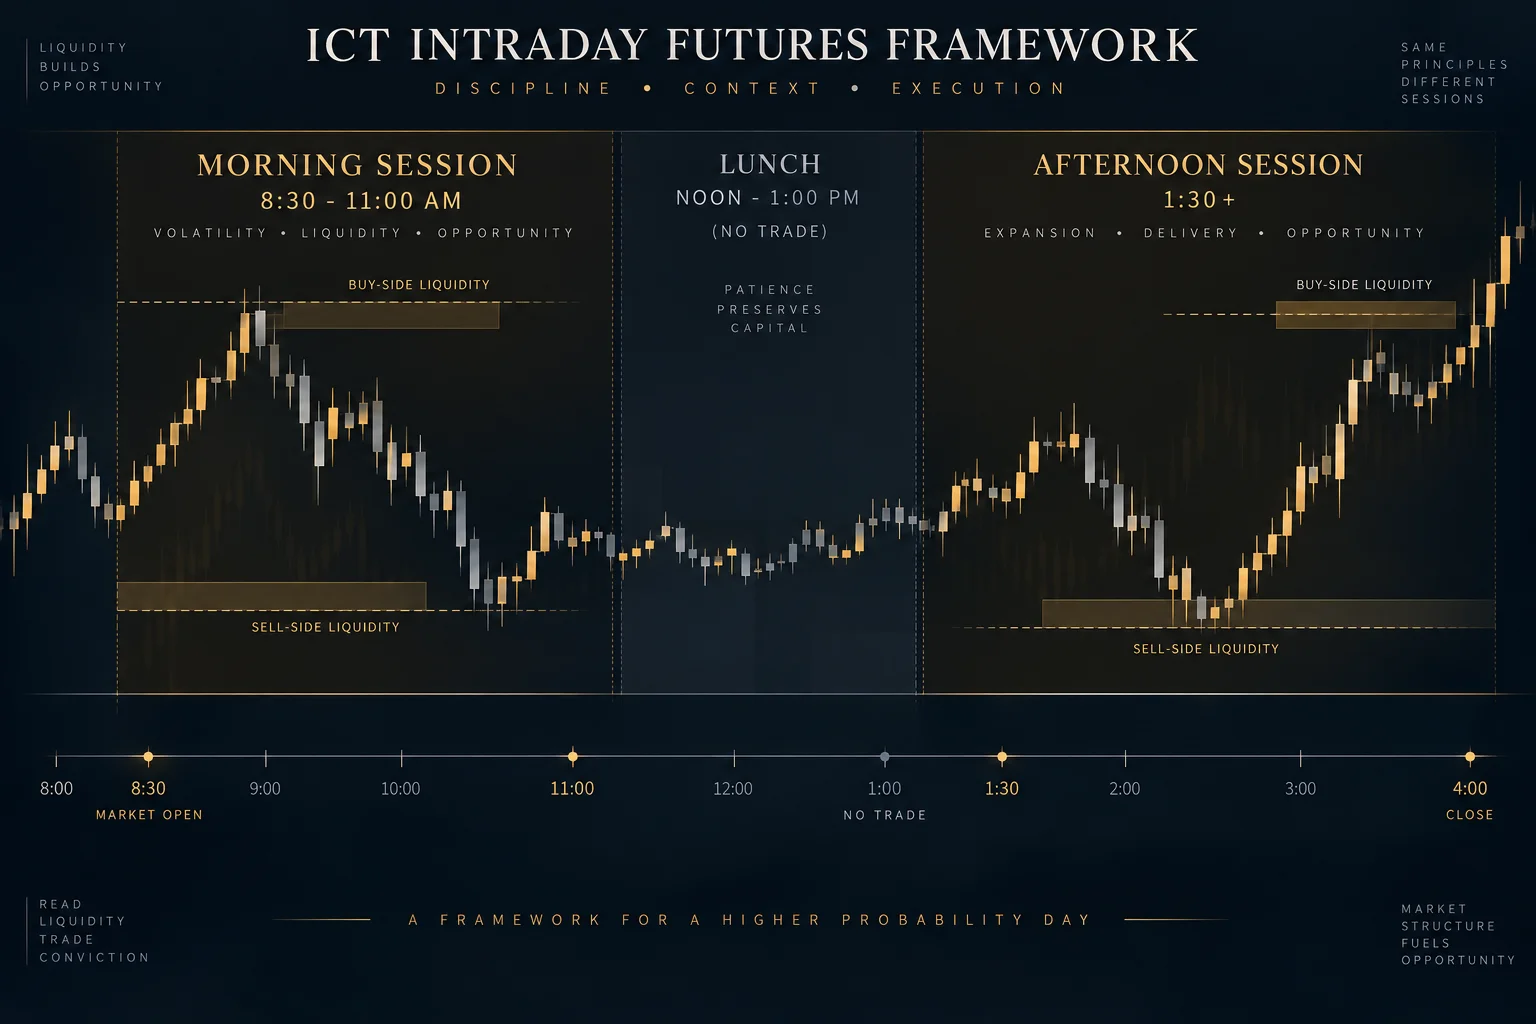
2022 ICT Mentorship Episode 5 at https://www.youtube.com/watch?v=N29ZJ-o31xs presents ICT’s educational framework for organizing E-mini S&P 500 and Nasdaq futures trading around New York session timing, liquidity, displacement, fair value gaps, and daily directional expectations. Quarterly futures codes are H for March, M for June, U for September, and Z for December, with traders instructed to monitor open interest near expiration and roll from the front month when the next contract becomes more active. The 15-minute chart is the primary reference for significant highs, lows, and imbalances, while the five-minute chart is used for lower-time-frame behavior. The morning window starts at eight thirty a.m. and runs toward noon, with positioning generally preferred before eleven a.m. Lunch from noon to one p.m. is a no-trade period, and one thirty p.m. is the earliest preferred afternoon setup time. Before eight thirty a.m., students mark obvious three-candle swing highs and lows, treating stops above highs as buy-side liquidity and stops below lows as sell-side liquidity. A bearish model sweeps a prior high, displaces sharply lower, leaves a fair value gap, retraces into that gap for a potential short reference, and targets the marked low. Under bullish afternoon expectations, price may sweep a newly formed swing low and rally or move abruptly higher, create a fair value gap, and retrace into it. Homework is to classify historical morning and afternoon sessions as bullish, bearish, or consolidating and compare them with the preceding daily chart. ICT warns that patterns can fail, stresses controlled risk, discourages overleverage and frequent micro-scalping, and stresses that simulated demonstrations are not verified live performance.
How we researched this article
BestProps used document-based research from primary firm sources, checked September 25, 2026. The complete source list, scope, limitations, and commercial-state record appear near the end of this article.
2022 ICT Mentorship Episode 5 (Intraday Overflow and Understanding the Daily Range)
In 2022 ICT Mentorship Episode 5, ICT presents a framework for organizing the index-futures trading day. The lesson covers futures contract selection, New York session timing, pre-session swing points, liquidity terminology, displacement, fair value gaps, and a chart-review assignment.
The discussion is primarily about the E-mini S&P 500 and Nasdaq futures. It should be understood as ICT’s interpretation of price behavior, not proof that the described patterns provide a reliable trading edge. The transcript also cannot verify the chart annotations, account activity, fills, or outcomes shown visually.
ICT Intraday Futures Contract Selection
ICT begins with contract notation and expiration at 2:00. He identifies the quarterly month codes used in the lesson: H for March, M for June, U for September, and Z for December. His example combines the product, delivery month, and year into a symbol for a specific E-mini S&P contract.
Because futures expire, traders must distinguish the current or “front” month from the next listed month. ICT says he monitors open interest around the week before expiration and moves to the contract with greater open interest. The practical lesson is that chart study should use the actively traded contract rather than continuing to analyze an expired one. The numerical open-interest examples in the recording were time-specific and should not be treated as current data.
ICT Intraday Flow Through the New York Session
At 7:07, ICT calls the 15-minute chart his main reference for identifying significant highs, lows, and imbalances. He asks viewers to set their charts to New York local time so that session markings remain consistent.
His intraday framework has three broad sections:
- Morning window: beginning at 8:30 a.m. New York time and extending toward noon, al