
How we researched this article
BestProps used document-based research from primary firm sources, checked September 25, 2026. The complete source list, scope, limitations, and commercial-state record appear near the end of this article.
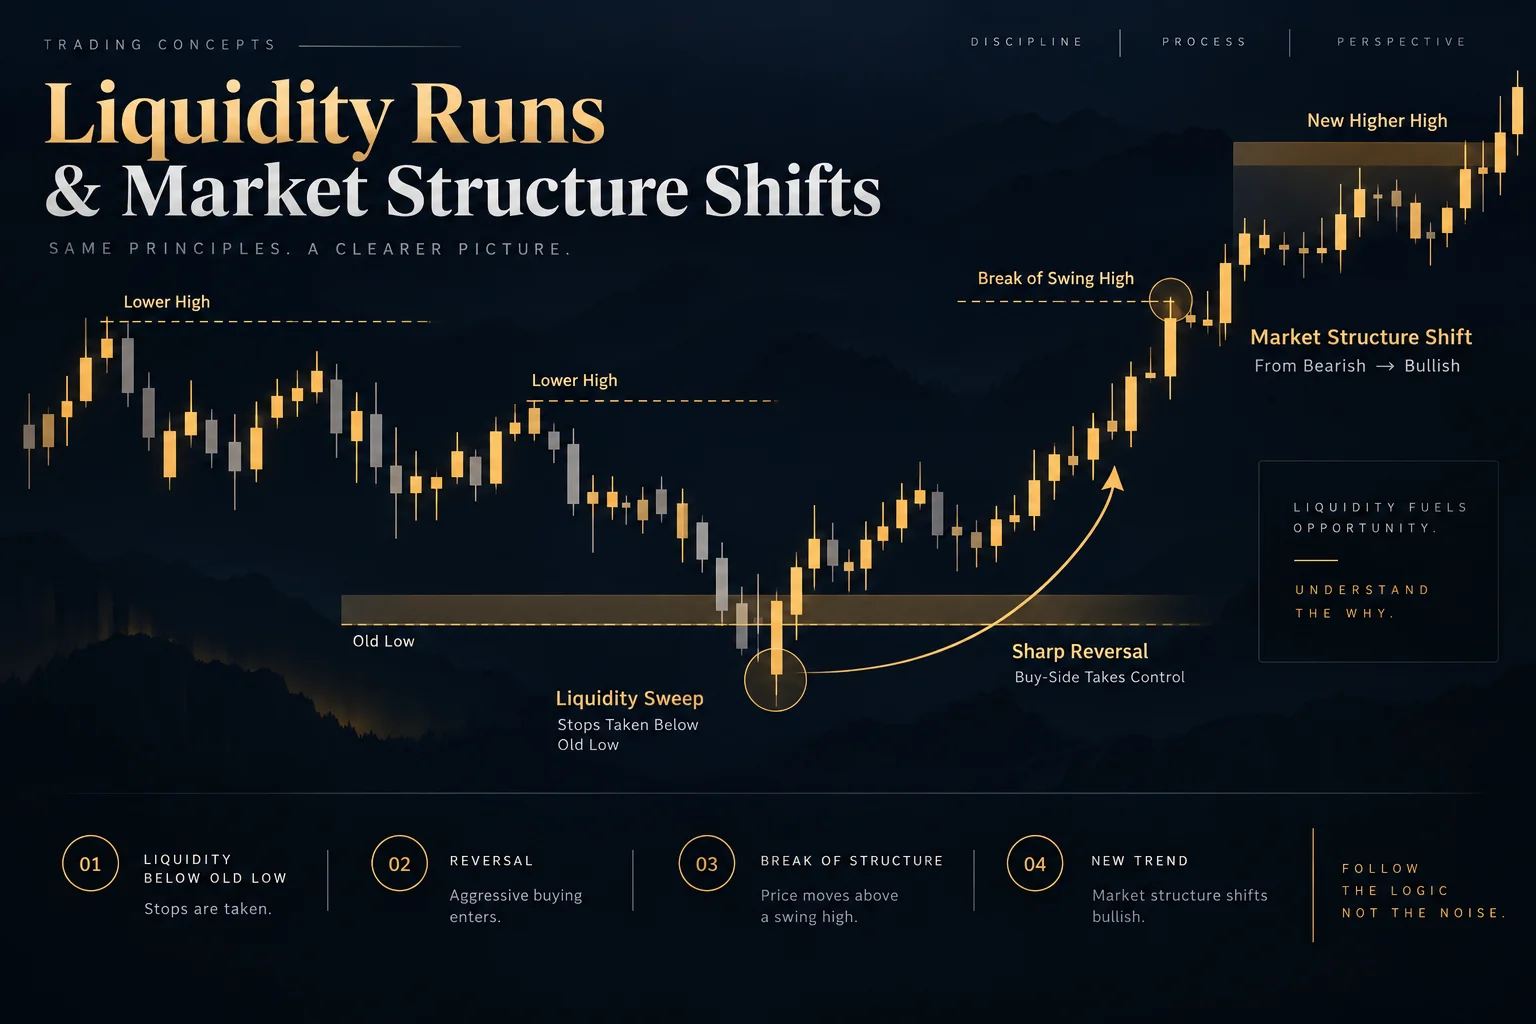
2022 ICT Mentorship Episode 3 — Liquidity Runs and Market Structure Shifts
In 2022 ICT Mentorship Episode 3, ICT explains his framework for connecting liquidity runs with intraday market structure shifts. Using an E-mini Nasdaq 100 futures example, he moves from a 15-minute chart to two-minute and one-minute views to show how he interprets old highs, old lows, short-term structure, fair value gaps, and order blocks.
The central lesson is not to treat every broken swing as a meaningful signal. In ICT’s interpretation, a short-term structural shift becomes significant only after price has first traded through an identifiable pool of liquidity. This is a market framework presented by ICT, not proof of a repeatable trading edge.
ICT Episode 3 Higher Timeframe Liquidity
At 1:11, ICT introduces a 15-minute chart of the March 2022 E-mini Nasdaq 100 futures contract. He identifies an old low as a location where sell stops may be resting and relative equal highs as a possible pool of buy stops.
His process begins by marking these external reference points before examining lower-timeframe price action. In the example, price first moves below the old low and later above the relative equal highs. ICT treats those liquidity runs as the context in which to watch for a change in short-term structure.
He also distinguishes an intraday market structure shift from a broader break in market structure at 2:21. In his terminology, a shift may indicate only an intraday draw toward higher or lower liquidity; it does not necessarily imply a sustained move lasting several days.
What Confirms an ICT Market Structure Shift
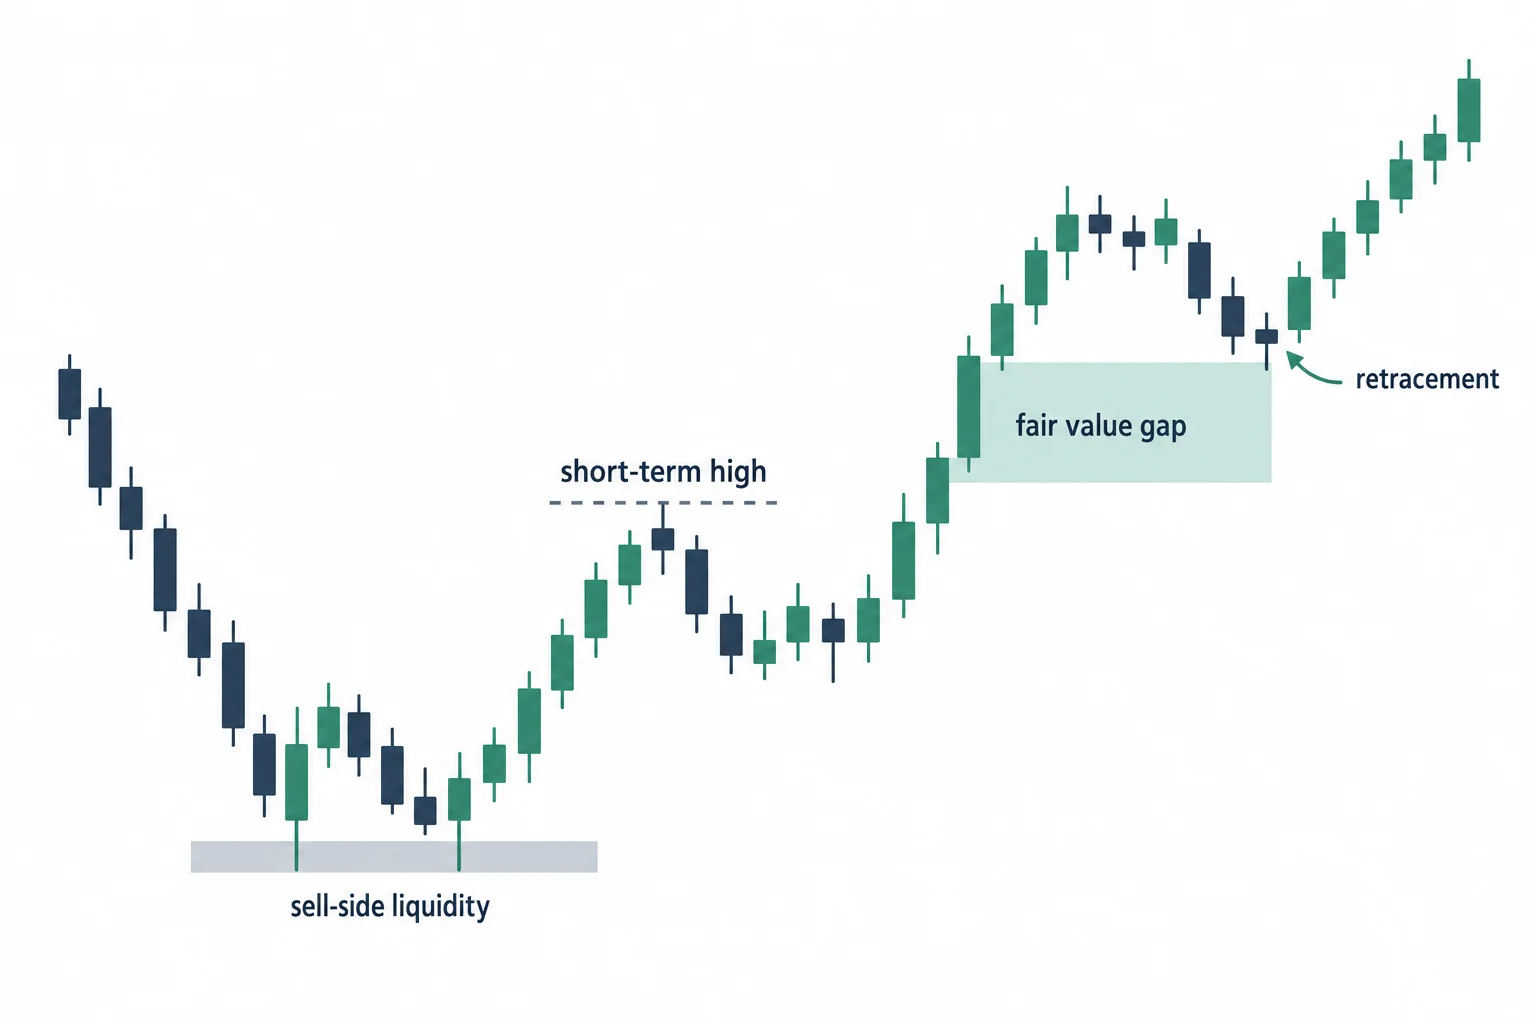
ICT’s basic bullish sequence is:
- Price trades below an old or relatively equal low, where he expects sell-side liquidity.
- A short-term swing high forms immediately before or around the low.
- Price subsequently trades above that short-term high.
- The trader then checks for an imbalance or fair value gap that may provide a retracement area.
He explains the importance of context at 6:34. Merely crossing a small swing high is not sufficient under this model; the move matters to him because it follows a trade below an earlier low. The bearish version reverses the logic: price first runs above old highs, then falls through a nearby short-term swing low.
At 17:56, he applies that bearish sequence after a run above buy-side liquidity. Once the short-term low is violated, he labels the structure bearish and looks toward lower lows, sell stops, and imbalances as possible objectives.
ICT Episode 3 Fair Value Gaps and Order Blocks
After a structure shift, ICT looks for additional evidence rather than entering solely because a swing was crossed. At 13:53, he describes a three-candle fair value gap: the surrounding candles do not fully overlap the range created during a strong displacement move. In his framework, a later retracement into tha