
Key takeaways
The best prop firm calculator depends on the job: remaining drawdown, stop-based position size or conditional strategy forecasting.
Read the full summary
The best prop firm calculator depends on the job: remaining drawdown, stop-based position size or conditional strategy forecasting. TradeReign matched six finite drawdown components across five separate groups, but it does not model payout resets. OneTradeJournal matched the same generic end-of-day component yet overstated FTMO 2-Step $50K daily room by up to $100. Myfxbook displayed 0.5 lots against a $99 cost-free EURUSD budget while separately showing 49,500 units, a $1 excess if you trade the displayed lots. ETF’s cost-free sizing gave two MES contracts; adding the illustrative costs makes that $106.50 against $100. No route passed the complete cost-inclusive futures or forex examples. Compare each tool’s scope before using a quantity, check your current floor after withdrawals, and use the copyable worksheet below rather than a generic firm preset.

This guide considers twelve prop firms and six independent calculator providers. They are not eighteen funding companies, and the fourteen documented tool routes are not fourteen fully tested calculators. The evidence includes downloaded original vendor code executed locally, product documentation, inaccessible account tools and simplified forecast models. Those categories remain separate throughout the comparisons.
Tool and current account-rule pages were read on October 8, 2026. Review and video dates retain their original dates, including older tutorials. We did not buy accounts, place trades, connect a brokerage account, install licensed software or obtain a payout to produce these comparisons. A public tool can be useful without being accurate for your funded account, and a firm can offer a usable account without describing a relevant calculator in the sources checked.
Prop firm calculator quick picks by task
For a manually entered futures floor snapshot, TradeReign is the clearest evidenced option here. Its original calculation matched the finite generic end-of-day and uncapped intraday components, the selected Topstep Combine example, two pre-payout XFA examples and a static equality boundary. That is a narrow arithmetic finding. It does not mean every futures account, floor lock, daily limit or withdrawal is supported.
For generic forex stop sizing, Myfxbook provides public dollar-risk and percentage-risk inputs with separate units and lots outputs. The displayed lot rounding deserves attention: the $99 example below is not conservative when acted on as 0.5 lots. Recheck the quantity against the platform’s increment, include costs externally, and do not mistake the selected account balance for the available funded-account risk budget.
For cost-free futures quantity arithmetic, ETF’s sizing calculator showed a useful whole-micro result and a zero-risk boundary. Its drawdown field is context, not a demonstrated clamp on the requested trade budget. Costs and the selected firm’s position cap must be checked separately. A correct two-micro result without costs does not remain correct when you add costs to the same $100 limit.
For a native desktop workflow, TradingDiary Pro documents fixed-size, fixed-dollar and percentage-risk methods alongside stop and target prices. We did not exercise the application, so this is a documented option, not a measured accuracy pick. Its $149 licence and optional $49 annual update/support fee are software prices, unlike the challenge fees printed in the firm calibrations.
For conditional strategy comparisons, TradeZella’s public model offers Monte Carlo forecasts, payout estimates and fee ROI. Use it to ask how a changed strategy assumption changes a modeled distribution, not whether a current account is clear of a breach. FinSeeds is a simpler timeline projection with a confirmed long-horizon bug; do not use its achievable label as a remaining-room check.
For FTMO daily loss, no apparent convenience outweighs the wrong percentage base. OneTradeJournal’s manually configured FTMO 2-Step $50K examples reported $50 and $100 too much daily room. FundedFast’s existing-account daily examples overstated room by $50. These findings do not make either provider a universal failure; they do make those specific outputs unsuitable as the final boundary for those accounts.
If your priority is a live rule meter, that is a different purchase from an offline calculator. The guide to built-in journals and analytics dashboards separates account meters, trade review and analytics. A tool that accepts one manually entered snapshot does not acquire a live equity feed because its marketing uses the words risk management.
Prop firm drawdown calculators and measured room
| Tool and task | Access and fee | Product and stage | Room or error | Exact cases | Main limitation |
|---|---|---|---|---|---|
| TradeReign manual drawdown | Public; fee unpublished | Generic EOD; no lock | $1,800 room; U $0 | 1 of 1 component | No daily or payout model |
| OneTradeJournal manual drawdown | Public; fee unpublished | Same generic EOD | $1,800 room; U $0 | 1 of 1 component | Whole-tool status fails |
| TradeReign manual intraday | Public; fee unpublished | Generic uncapped | $0 available; U $0 | 1 of 1 component | Signed room is -$200 |
| TradeReign Topstep Combine $50K | Public; fee unpublished | Evaluation EOD | $1,800 room; U $0 | 1 of 1 component | Manually entered equity |
| TradeReign Topstep XFA $50K | Public; fee unpublished | Before first payout | U $0 | 2 of 2 components | Payout reset unsupported |
| TradeReign static equality | Public; fee unpublished | Generic static | $0 room; U $0 | 1 of 1 component | Touch is a breach |
| OneTradeJournal FTMO 2-Step $50K | Public; fee unpublished | Daily compatibility | Maximum U $100 | 0 of 2 correct | Wrong percentage base |
| FundedFast existing 2-Phase $50K | Public; fee unpublished | Daily compatibility | Maximum U $50 | 0 of 2 correct | New sales stopped |
| FundedFast existing 2-Phase $50K | Public; fee unpublished | Overall static | U $0 | 1 of 1 component | No withdrawal model |
| ETF DTF $50K drawdown | Public; fee unpublished | Sim-funded lock | U not measured | Floor agrees in 1 case | Room derived externally |
| Tool | Equity input | High-water input | Lock | Payout effect |
|---|---|---|---|---|
| TradeReign | Manual current value | EOD or intraday high | Starting balance only | Not modeled |
| OneTradeJournal | Manual balance field | Single manual peak | Hardwired initial cap | Not modeled |
| FundedFast | Manual balance mapped | Static route tested | Not verified | Not published |
| ETF drawdown | Daily path; not live | Close or open spike | Selected plan safety net | Not modeled |
The measured-error column asks a specific question: how many dollars of remaining room did the original code overstate compared with the applicable expected calculation? For each supported group, unsafe error is the positive excess of reported room over expected room, taking the largest excess across its distinct cases. Understatement can still be inconvenient, so maximum absolute error and correct-case counts are also retained in the evidence. An unsupported case is not a zero-dollar error.
OneTradeJournal and TradeReign show the same $1,800 overall component in the generic end-of-day example. Their comparison fees are unpublished for the complete ordering used here, so there is no claimed overall price winner. OneTradeJournal’s page also describes the calculator as free, but its whole-tool result in that snapshot says the account failed because entering zero daily loss does not disable its daily check. Equal overall arithmetic is not equal full-tool behavior.
Singleton product groups do not deserve first-place badges. TradeReign’s two pre-payout XFA components tell you more about those inputs than a single example would, but neither tests a first withdrawal. FundedFast’s correct overall static result does not cancel its daily mismatch. ETF reports floors and day status rather than the numerical remaining-room output used by this metric, so its unsafe-room error stays unmeasured even when balance minus floor can be computed outside the tool.
The table deliberately does not compare a generic intraday snapshot with a CFD daily allowance or a funded withdrawal as if they were interchangeable products. Different high-water rules can produce different correct floors from the same visible balance. Before comparing results, hold the function, product, stage, cohort, currency and relevant prior state constant. Otherwise a smaller number may simply come from a stricter or different rule.
Prop firm position size calculators and observed quantities
| Tool and market | Risk basis | Fees and slippage | Rounding and cap | Observed result | Access and fee | Main limitation |
|---|---|---|---|---|---|---|
| ETF ES/MES sizing | Dollar or percent | No separate costs | Whole micros; no cap | 2 MES; cost-free | Public; fee unpublished | Full cost test unsupported |
| Myfxbook EURUSD sizing | Dollar or percent | No separate costs | Display rounding | 0.5 lots; 49,500 units | Public; free | Displayed lots exceed $99 |
| FTMO Client Area sizing | Documented stop risk | Not exercised | Not exercised | No observed quantity | Login; fee unpublished | No accuracy result |
| TradingDiary Pro desktop | Fixed size, dollar, % | Not exercised | Stock example only | No observed quantity | $149; $49 update/year | Native app not exercised |
| FundedNext lot sizing | Documented lot sizing | Not exercised | Not exercised | No observed quantity | Public; fee unpublished | No tested output |
| The5ers MT5 max lot | Margin and leverage | Not exercised | Not exercised | No observed quantity | Download; free access | Not verified stop sizing |
| FundingPips internal sizing | Documented stop risk | Not exercised | Not exercised | No observed quantity | Login; fee unpublished | No tested output |
| E8 perpetual Terminal setup | Integrated SL and TP | Not exercised | Not exercised | No observed quantity | Login; fee unpublished | Not Pro Classic CFD tool |
Sizing starts with a chosen risk budget and a stop, then asks how much of the instrument fits that budget. It does not establish the budget itself, the right stop, an approved strategy or sufficient margin. None of the routes in this table passed the entire futures example with costs and cap or the entire forex example with costs and lot increment. Public access is not a substitute for those missing inputs.
ETF’s cost-free ES/MES result and Myfxbook’s cost-free EURUSD result are different supplementary groups. Comparing them as a single accuracy ranking would mix instrument units, contract rounding, pip conventions and cost assumptions. A zero excess on whole micro contracts does not demonstrate safe forex display rounding. A forex rounding issue does not tell you whether a futures multiplier is correct.
A good sizing workflow lets you see the difference between raw theoretical quantity, displayed rounded quantity and executable quantity. It also makes minimum size and cap failures obvious. If the risk budget buys less than one minimum increment at the chosen stop, a calculator should not turn that into permission to round up. The practical answer can be no trade, a different permitted instrument or a legitimately different trade setup, not a forced minimum order.
Documented routes are included because they may fit an existing account or workflow, not because their inaccessible outputs were assumed correct. FTMO’s Client Area, FundingPips’ internal calculator and E8 Terminal require appropriate access; The5ers’ indicator requires a platform download; TradingDiary Pro requires its native application. We did not bypass those boundaries. FundedNext’s public tool is documented, but no quantity was exercised under this review’s constraints.
Prop firm risk calculators and forecast assumptions
| Tool | Method | Sample size | Payout model | Main limitation |
|---|---|---|---|---|
| TradeZella public ROI | Conditional Monte Carlo | 1,000 funded; 500 challenge | Resets balance and peak | Not live survival or two-step path |
| FinSeeds target timeline | Fixed rounded win mix | No random sample | No payout model | Over-1,000-day horizon bug |
A deterministic headroom calculator answers a state question: given the correct current floor and equity, what room remains? A sizing calculator answers a proposed-order question: given budget, instrument and stop, what quantity fits? A probabilistic model answers a conditional distribution question: if the strategy and modeled rules behave as assumed, how often do simulated paths reach particular outcomes? All three can be useful, but their outputs are not substitutes.
A percentage labeled pass rate is especially easy to overread. It can be the share of simulated paths reaching a simplified target before a simplified boundary, not the share of paying customers who pass a firm’s actual process. It may omit verification phases, minimum days, consistency, review, execution costs and payout conditions. A forecast can appear precise to one decimal place while still leaving those larger modeling questions unanswered.
Likewise, average modeled payout and median take-home answer different questions. A small share of large simulated winners can raise the mean while the median remains a loss of the entry fee. A fee ROI that divides by challenge fee alone can differ from a break-even calculation that includes activation. Identify both numerator and denominator before comparing charts or using the result to justify another purchase.
Prop firm calculator selection method and evidence limits
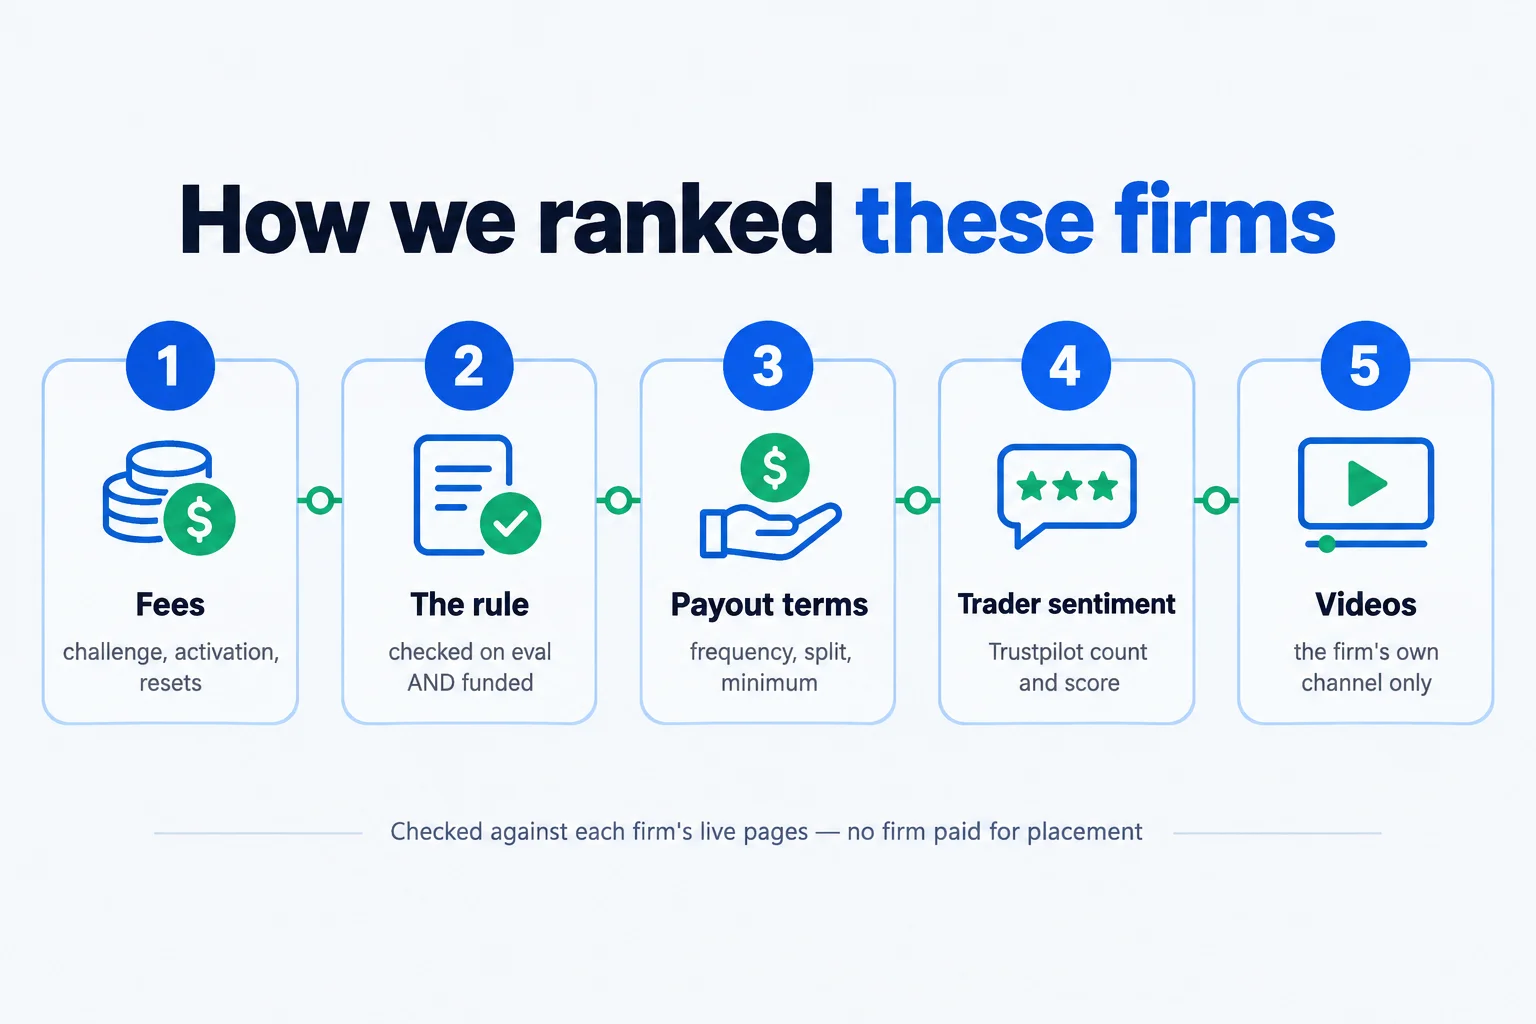
We started with the vendor’s own calculator, help, price and privacy pages, then matched any named account to its firm’s current rules. Where original implementations were accessible, they were executed locally with their calculation logic unchanged. Rendering surroundings were handled locally where needed. This is code execution, not a claim that a live browser form, account feed, order or payout was tested.
Seven vendors’ original implementations, covering eight routes, have saved execution evidence. Six deterministic vendor reruns matched their saved outputs; TradeZella reruns are separate random forecast snapshots, not equality checks. Every full entry retains the six drawdown and two sizing scenarios, even when the answer is unsupported or inaccessible. Supplemental tests remain supplemental and do not replace a missing required result.
A source quote proves the documented rule, not the calculator’s adherence to it. A screenshot of an input form proves that a field exists, not that its implementation applies the intended base. A correct floor output proves that finite component, not minimum intraday equity, a reset clock or a payout transition. The distinctions matter most when a reassuring green status accompanies a number that is only partially applicable.
Within genuinely comparable groups, the intended order is unsafe excess first, then distinct correct applicable cases, then known list utility fee. Equal findings remain equal when the fee comparison is incomplete. We do not fill an unknown fee with zero, use a challenge fee as a software fee or call an inaccessible calculator wrong solely because we could not observe it. The guide is a selection comparison, not a prop-firm trust or cheapest-account leaderboard.
A current product conflict stays visible. For example, The5ers’ exact $50K table and generic FAQ differ on loss percentages; My Funded Futures’ product wording and open-loss wording differ on enforcement. A conservative interpretation can help a trader avoid assuming extra room, but it does not resolve the contradiction. Confirm the actual account agreement and obtain product-specific clarification before relying on a disputed boundary.
Prop firm calculator eight-case evidence
| Case | Scenario | Expected result |
|---|---|---|
| D1 | Static and open loss | $48,000 floor; $1,000 room |
| D2 | EOD ignores open peak | $49,000 floor; $1,800 room |
| D3 | Intraday peak giveback | $51,000 floor; -$200 signed room |
| D4 | Explicit floor lock | $50,100 floor; $1,400 room |
| D5 | Initial daily percentage | $48,500 daily floor; $300 room |
| D6 | Payout with supplied floor | $50,300 equity; $200 room |
| S1 | Futures costs and cap | 1 MES; $53.25 modeled stop risk |
| S2 | Forex costs and lot step | 0.47 lots; $98.70 modeled stop risk |
| Tool | D1 | D2 | D3 | D4 |
|---|---|---|---|---|
| E8 Terminal | Unsupported | Unsupported | Unsupported | Unsupported |
| ETF drawdown | Unsupported | Code result | Code result | Code result |
| ETF sizing | Unsupported | Unsupported | Unsupported | Unsupported |
| FinSeeds | Unsupported | Unsupported | Unsupported | Unsupported |
| FTMO | Unsupported | Unsupported | Unsupported | Unsupported |
| FundedFast | Code result | Unsupported | Unsupported | Unsupported |
| FundedNext | Unsupported | Unsupported | Unsupported | Unsupported |
| FundingPips | Unsupported | Unsupported | Unsupported | Unsupported |
| Myfxbook | Unsupported | Unsupported | Unsupported | Unsupported |
| OneTradeJournal | Unsupported | Code result | Unsupported | Unsupported |
| The5ers | Unsupported | Unsupported | Unsupported | Unsupported |
| TradeReign | Unsupported | Code result | Code result | Unsupported |
| TradeZella | Unsupported | Unsupported | Unsupported | Unsupported |
| TradingDiary Pro | Unsupported | Unsupported | Unsupported | Unsupported |
| Tool | D5 | D6 | S1 | S2 |
|---|---|---|---|---|
| E8 Terminal | Unsupported | Unsupported | Access limited | Access limited |
| ETF drawdown | Unsupported | Unsupported | Unsupported | Unsupported |
| ETF sizing | Unsupported | Unsupported | Unsupported | Unsupported |
| FinSeeds | Unsupported | Unsupported | Unsupported | Unsupported |
| FTMO | Unsupported | Unsupported | Access limited | Access limited |
| FundedFast | Code result | Unsupported | Unsupported | Unsupported |
| FundedNext | Unsupported | Unsupported | Unsupported | Documentation only |
| FundingPips | Unsupported | Unsupported | Unsupported | Access limited |
| Myfxbook | Unsupported | Unsupported | Unsupported | Unsupported |
| OneTradeJournal | Code result | Unsupported | Unsupported | Unsupported |
| The5ers | Unsupported | Unsupported | Unsupported | Access limited |
| TradeReign | Unsupported | Unsupported | Unsupported | Unsupported |
| TradeZella | Unsupported | Unsupported | Unsupported | Unsupported |
| TradingDiary Pro | Unsupported | Unsupported | Documentation only | Documentation only |
The expected figures above are illustrative arithmetic calculated separately from vendor outputs. They are not all one firm’s rules and are not measured results simply because they are exact dollars. Each example changes a specific mechanic so you can diagnose which input a tool is missing. Keep the floor, equity and signed room separate, especially once a position has already crossed a boundary.
Code result means an original vendor calculation was executed for the relevant component. It does not mean the entire example passed or the calculator supports every included input. Documentation only means the vendor describes the function without an exercised output. Access limited means the required interface or native route was not available under the no-signup, no-install constraints. Unsupported means the full scenario cannot be represented by that function.
For OneTradeJournal, the initial-capital daily example duplicates the exact evaluation inputs and counts only once in its two-case FTMO daily group. FundedFast likewise keeps its duplicated illustrative daily input without treating it as another distinct test. Counting repeated inputs would exaggerate how much of a product has been checked. For ETF, a matching floor and an incorrect daily status can coexist in the same lock example.
The six drawdown examples remain useful even for a sizing-only tool, because they establish what that tool does not calculate. The two cost-inclusive sizing examples remain useful even when a tool provides no cost field, because that unsupported status is the reader’s warning. Removing costs or payout changes until every tool looks accurate would answer an easier question than funded-account traders actually face.
Prop firm drawdown fundamentals and current loss room
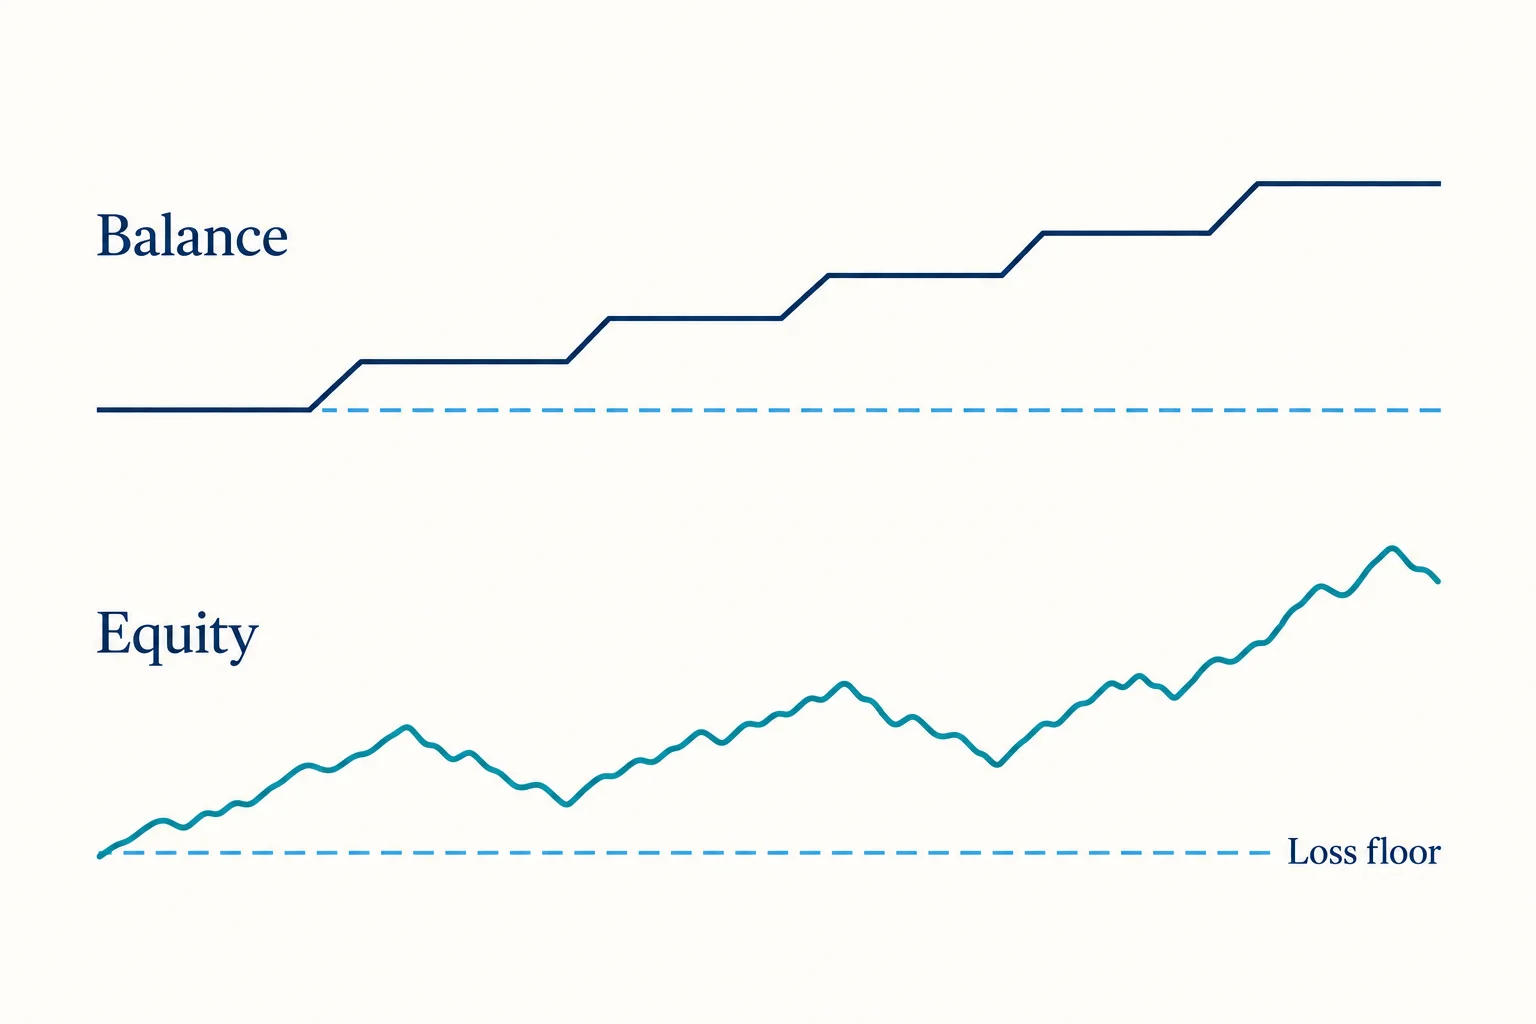
Face capital is the advertised account label or nominal buying power. Balance is the closed-account value under the platform’s convention. Equity includes the current marked result of open trades and applicable charges. The loss floor is the lowest permitted account value under the specific rule. Remaining room is the relevant monitored value minus that floor, not a percentage of the name on the account card.
A $50,000 account with a $48,000 floor does not provide $50,000 of loss capacity. If equity is $49,000, the illustrative remaining overall room is $1,000. The closed balance could still show $49,500 because an open position has lost another $500. Entering that closed balance into a tool that expects equity overstates usable room even if its subtraction is perfect.
Keep signed room as well as the nonnegative available amount. In the intraday example, equity of $50,800 against a $51,000 floor gives signed room of -$200 and available room of zero. Replacing -$200 with a green-looking zero can conceal an already crossed boundary. Once breached, reducing the next order is not a cure for the account status; follow the firm’s actual process rather than calculating a recovery trade.
The usable budget for a proposed order is smaller than or equal to every applicable limit after reserves. Consider overall room, daily room, existing and pending exposure, per-position restrictions, caps and your own risk policy. A conservative worksheet can reserve execution uncertainty separately. Do not spend the entire theoretical floor distance just because a calculator returns a positive value; the next fill, commission or server update can remove that margin.
A balance field is not inherently wrong if the user is deliberately entering net equity into a manual-value field and documenting the mapping. The problem is hidden semantics: the tool may reconstruct daily profit from the same value, substitute a default when it is zero or use a balance-only high-water definition. Trace every field’s role, not just its name. An apparently harmless workaround can change more than the final subtraction.
Prop firm static drawdown and open-loss example
Static drawdown holds the overall floor to an initial-capital reference rather than chasing every new profit peak. In the illustrative static example, $50,000 initial capital less $2,000 allowance gives a $48,000 floor. Equity of $49,000 leaves $1,000. Balance of $49,500 is not the correct breach measure when the rule watches equity, so a balance-only result would conceal $500 of open loss.
Profit above a static floor can increase the buffer, but that does not erase a daily loss rule. The smaller daily room can bind before the overall floor is close. Nor does the word static guarantee that a first payout leaves the floor unchanged. E8’s selected Classic calibration is a clear counterexample: its pre-payout static floor changes at the first request under the conservative current wording.
The static drawdown guide is helpful when choosing accounts, but calculate your existing product from its actual current terms. Do not select static merely because the account is CFD-based or a generic preset uses that label. Product variants, add-ons and funded stages can change the rule without changing the vendor name.
For a static tool check, confirm initial capital, overall percentage, breach measure and equality language. Add current equity and any daily boundary separately. Then ask what happens at a withdrawal, account rollover or scaling event. If a tool has only account size and current balance, it may model the basic floor but leave those state changes to you. Treat that as a manual obligation, not an automatic feature.
Prop firm EOD drawdown and continuous enforcement
End-of-day drawdown distinguishes floor movement from breach monitoring. In the illustrative example, the highest relevant completed-day balance is $51,000 and the distance is $2,000, so the floor is $49,000. An open intraday