Understand how static, trailing, and EOD drawdown rules work and how “locks” and rule timing can make or break your funding challenge.
The financial concept of drawdown represents the most critical measure of risk for market participants, serving as the ultimate boundary between capital preservation and account liquidation. While return on investment often captures the focus of retail participants, professional institutional analysis prioritizes the management of peak-to-trough declines as the primary indicator of a strategy’s viability. In the contemporary financial environment, drawdown is not a singular definition but a complex architecture of rules, specifically in the proprietary (prop) trading sector, where firms utilize dynamic thresholds to safeguard firm capital. This report provides an exhaustive examination of these mechanisms, ranging from the technical intricacies of intraday trailing drawdowns to the life-cycle management of pension income drawdowns, offering a unified framework for understanding risk across the trading and investment spectrum.
What Every Trader Needs to Know About How Drawdown Rules Work
A drawdown is universally defined as the percentage or dollar decline from a portfolio’s peak value to its subsequent lowest point before a new peak is achieved. It serves as a more practical measure of risk than volatility; while volatility quantifies the frequency and magnitude of price movement, drawdown measures the actual capital erosion an investor must endure. The identification of drawdown involves three specific markers: the peak (highest historical balance), the trough (lowest balance following that peak), and the recovery (the return to a new high water mark).
The mathematical reality of drawdown is governed by a non-linear recovery requirement known as the recovery paradox. Because losses are calculated relative to a shrinking base, the gain required to return to the breakeven point increases exponentially as the drawdown deepens. A 10% decline necessitates an 11.1% gain for recovery, whereas a 50% decline requires a 100% gain, effectively doubling the difficulty of the task. This relationship dictates the risk-to-reward parameters of all professional investment strategies.
| Drawdown Level (%) | Required Recovery Gain (%) | Risk Impact Classification |
|---|---|---|
| 5% | 5.26% | Nominal Volatility |
| 10% | 11.11% | Standard Correction |
| 20% | 25.00% | Bear Market Minimum |
| 30% | 42.86% | Severe Portfolio Stress |
| 40% | 66.67% | Critical Capital Impairment |
| 50% | 100.00% | Strategy Failure Threshold |
| 75% | 300.00% | Terminal Capital Loss |
| 90% | 900.00% | Irrecoverable Ruin |
In institutional banking and stock portfolios, a “market min” or minimum threshold for a bear market is often defined as a 20% drawdown. This systemic decline triggers a shift in investor sentiment and risk appetite, often requiring fiscal or monetary intervention to restore liquidity. Conversely, in the proprietary trading industry, drawdown rules are significantly more stringent, often capped at 4% to 10% of total capital to protect the firm’s assets.
How Prop Firms Use Drawdown Rules to Control Trader Risk
Proprietary trading firms provide traders with access to large-scale capital, yet this access is contingent upon strict adherence to risk management protocols. These protocols are codified as drawdown rules, which act as automated “circuit breakers” for trading accounts. Breaching these limits typically results in immediate account termination, a non-negotiable hard stop designed to prevent catastrophic losses.
Balance-Based versus Equity-Based Drawdown Rules
The fundamental distinction in prop firm drawdown rules lies in the reference point used for calculation: account balance versus account equity. This distinction changes the entire trading dynamic and risk profile of the participant.
Balance-based drawdown utilizes the closed-trade value as the reference point, typically recorded at the start of the trading day or at midnight server time. This method is generally considered more “trader-friendly” because it ignores floating profits or losses, allowing a trader to experience significant intraday swings without breaching the overall limit, provided the trades are not closed at a loss.
Equity-based drawdown, however, tracks the real-time value of the account, including all open positions and floating P&L. Under this regime, the account is in constant jeopardy. If a trade moves into a significant floating loss that touches the drawdown threshold (even for a millisecond), the account is breached and permanently disabled. Firms like Breakout utilize equity-based limits across both their 1-Step and 2-Step evaluation models to ensure real-time capital protection.
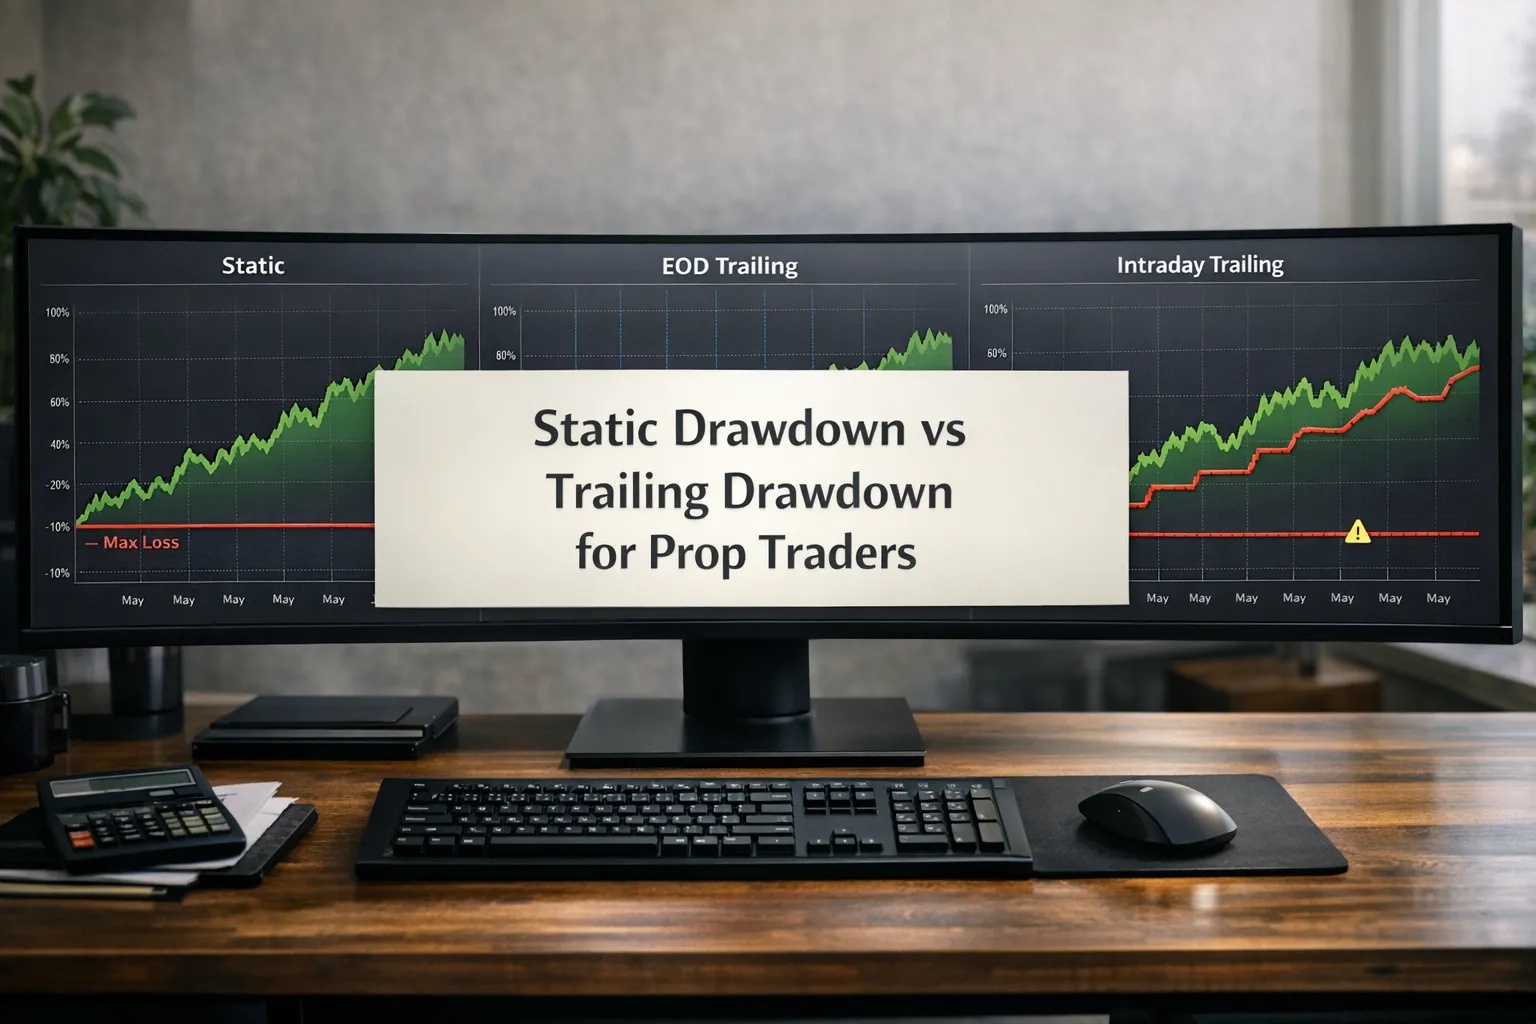
Static versus Trailing Drawdown Thresholds
The movement of the drawdown “floor” further categorizes prop firm risk models into static and trailing architectures.
- Static Drawdown: The loss limit is fixed from the account’s inception and never moves. For a $100,000 account with a 10% static drawdown, the floor is $90,000 for the life of the account. As the trader generates profit, the “buffer” or “cushion” between the current balance and the floor expands, effectively allowing for higher risk-taking as the account grows. Breakout’s 1-Step Classic accounts utilize this model, maintaining a static floor at 6% below the initial balance.
- Trailing Drawdown: The loss limit moves upward as the account balance or equity reaches new highs (High Water Marks). Once the threshold moves up, it never moves back down, even if the account balance subsequently declines. This mechanism is designed to “lock in” profits for the firm and force the trader to maintain consistent discipline.
Intraday Trailing Drawdown Rules and Why Traders Call This Hard Mode
Among all risk protocols, the intraday trailing drawdown is regarded as the most challenging for traders to manage. This rule dictates that the maximum loss limit trails the highest unrealized profit reached during the trading session in real-time.
How Intraday Trailing Drawdown Rules Create Trap Dynamics
The primary hazard of the intraday trailing drawdown is its punishment of normal market pullbacks. Markets do not move in linear paths; they ebb and flow. A trade that is currently $2,000 in profit might pull back to $1,000 before reaching its final target of $3,000. Under an intraday trailing rule with a $2,000 limit, that $2,000 peak profit would move the drawdown floor upward by $2,000. If the trade pulls back significantly, the account can be failed while the trade is still technically in profit relative to the entry price.
This creates what industry analysts call the “trading scared” phenomenon. Traders, aware that any intraday peak raises their floor, may begin cutting winning trades prematurely to avoid the risk of a pullback-induced breach. This behavior leads to a degradation of the strategy’s expectancy, as the trader is no longer following their technical plan but is instead managing the “trap” of the firm’s risk engine.
Real-Time versus End-of-Day Drawdown Rules and Their Impact on Trading
The distinction between real-time and end-of-day (EOD) calculation is critical for strategy selection. EOD drawdown firms, such as Topstep, only adjust the drawdown threshold at the close of the trading day. This allows traders to experience pullbacks throughout the session without penalty, provided they finish the day above the required threshold.
| Rule Feature | Intraday Trailing Drawdown | End-of-Day Trailing Drawdown |
|---|---|---|
| Adjustment Timing | Instantaneous (per tick/second) | Daily close (settlement) |
| Profit Basis | Highest Unrealized (Floating) | Closing Balance (Realized) |
| Pullback Tolerance | None (Immediate floor adjustment) | High (During the session) |
| Trader Longevity | Low (High failure rate) | High (Supports growth) |
| Strategy Alignment | Ultra-scalping | Day/Swing trading |
How Topstep Structures Its Prop Firm Drawdown Rules
Topstep Brokerage and its associated “Trading Combine” have established a professional standard by utilizing EOD drawdown rules to foster trader consistency. The Maximum Loss Limit (MLL) is the primary governing rule of the Topstep ecosystem.
Drawdown Rules in the Trading Combine and Express Funded Account Parameters
The MLL trails the account balance high, but adjustments are only set at the end of the trading day. For a $50,000 account, the MLL is $2,000. If a trader earns $500 on day one, the account balance is $50,500, and the MLL moves from $48,000 to $48,500. If the trader loses $500 on day two, the balance returns to $50,000, but the MLL remains at $48,500.
A key “trader-friendly” feature of the Topstep MLL is its ceiling. Once the MLL reaches the initial starting balance of the account (e.g., $50,000 for a $50k account), it stops trailing and becomes a static floor for the remainder of the evaluation or funded period. This ensures that once a trader has built a sufficient cushion, they can no longer lose the account due to the trailing mechanism, provided they stay above the original balance.
Daily Loss Limit Rules and Their Role in Proprietary Trading Drawdown Management
In addition to the overall MLL, Topstep utilizes a Daily Loss Limit (DLL). Unlike the MLL, the DLL is an “objective” rather than a terminal rule for many account types. If a trader hits the DLL, the account is auto-liquidated and locked for the remainder of the session to prevent “revenge trading,” but it is not failed; the trader can resume the following day.
| Account Size | Daily Loss Limit | Maximum Loss Limit | Profit Target |
|---|---|---|---|
| $50,000 | $1,000 | $2,000 | $3,000 |
| $100,000 | $2,000 | $3,000 | $6,000 |
| $150,000 | $3,000 | $4,500 | $9,000 |
Note: As of August 2024, TopstepX accounts removed the Daily Loss Limit for Trading Combines and Express Funded Accounts to provide more flexibility.
The Three-Tier Framework Every Trader Needs for Managing Drawdown Rules
To work within the constraints of prop firm drawdown rules, professional traders utilize a “Three-Tier Framework” for risk scaling. This approach dynamicizes position sizing based on the current “distance to breach,” ensuring that a trader never reaches a terminal state due to a single bad day.
Scaling Down Position Sizes to Protect Your Drawdown Rule Buffer
The framework divides the account’s daily or maximum drawdown allowance into three operational zones. The goal is to reduce the risk-per-trade as the account equity approaches the drawdown floor, effectively “stretching” the remaining capital.
| Operational Zone | Drawdown Usage | Risk Strategy |
|---|---|---|
| Green Zone | 0% – 30% of Limit | Full position sizing (0.5% – 1% risk) |
| Yellow Zone | 30% – 60% of Limit | Half position sizing (0.25% risk) |
| Red Zone | 60% – 80% of Limit | Micro-position sizing (0.1% risk) |
| Hard Stop | 80%+ of Limit | Cease trading for the session/week |
By implementing a walk-away threshold at 80% of the daily limit, a trader leaves a 20% buffer to account for slippage or late execution during volatile market events. This “80% over 100%” philosophy is critical because it prevents the permanent loss of the account, allowing for recovery in subsequent sessions when market conditions may be more favorable.
Practical Lot Sizing Formulas for Proprietary Trading Drawdown Rules
Traders must calculate their maximum lot exposure to ensure they do not accidentally trigger a breach. For major currency pairs and indices, the following lot sizing benchmarks are standard across $50k, $100k, and $200k accounts.
| Account Size | Max Daily Risk ($) | Recommended Lot Size (FX) | Max Position Size (Lots) |
|---|---|---|---|
| $50,000 | $1,200 | 1.0 – 2.0 | 20 |
| $100,000 | $2,400 | 2.0 – 5.0 | 40 |
| $200,000 | $4,800 | 5.0 – 10.0 | 80 |
The formula used for these calculations is:
For instance, on a $100,000 account risking 0.5% ($500) with a 20-pip stop loss on EUR/USD:
How Slippage and Latency Can Breach Your Prop Firm Drawdown Rules
Even a perfect strategy can fail due to the mechanics of order execution. Slippage (the difference between the expected price of a trade and the price at which the trade is executed) can be a primary cause of drawdown breaches.
Market Microstructure and What Triggers a Proprietary Trading Drawdown Breach
During high-impact news events (e.g., Non-Farm Payrolls, CPI), liquidity can thin out, causing spreads to widen and price to “gap” over stop-loss orders. If a trader’s stop loss is set exactly at the drawdown limit, a gapping market can result in a fill that is significantly below the limit, causing an immediate hard breach.
Firms often warn that “proper stop losses” do not guarantee protection against breaches during extreme volatility. Consequently, maintaining a “drawdown buffer” (unencumbered capital that serves as a safety net) is essential. Success in prop trading often depends on withdrawing only a portion of profits and keeping the remainder in the account to widen the gap between the current balance and the trailing threshold.
Pension Income Drawdown Rules and What Traders Need to Know About Them
While drawdown in trading is a measure of risk, in the context of retirement planning, “income drawdown” (or flexi-access drawdown) is a sophisticated mechanism for capital distribution. Introduced in the UK via the 2015 pension freedoms, this allows retirees to keep their pension fund invested while withdrawing cash as needed, rather than purchasing a fixed annuity.
Mechanics of Flexi-Access Drawdown
Income drawdown offers flexibility that traditional banking or insurance products lack. Retirees can typically take up to 25% of their total pension pot as a tax-free lump sum. The remaining 75% stays invested in a mix of stocks, bonds, and cash, with withdrawals taxed as regular income.
This creates a different form of drawdown risk: longevity risk. If a retiree withdraws too much too early (a “sequencing of returns” risk), or if the market experiences a significant drawdown early in retirement, the pension fund may be depleted before the end of the retiree’s life.
The “Age 75” Death Rule in Institutional Wealth Management Drawdown
A critical informational point for wealth management is the treatment of the pension fund upon the death of the holder. Unlike an annuity, which often ceases payments upon death, a drawdown pension can be inherited.
- Death Before 75: Beneficiaries can inherit the remaining fund entirely tax-free.
- Death After 75: Beneficiaries must pay income tax at their marginal rate on any withdrawals from the inherited pot.
| Feature | Prop Trading Drawdown | Pension Income Drawdown |
|---|---|---|
| Objective | Loss limitation/Capital protection | Income generation/Wealth transfer |
| Risk Bearer | The Trader/The Firm | The Retiree |
| Investment | High-frequency/Speculative | Long-term/Diversified |
| End State | Breach (Termination) | Depletion (Longevity risk) |
| Tax Impact | Capital Gains/Income | 25% Tax-Free/Marginal Rate |
Comparing Prop Firm Drawdown Rules Across the Leading Funded Accounts
Traders choosing a partner must look past flashy marketing offers and analyze the underlying rulebook. The “fairness” of a firm is determined by how its drawdown rules interact with market volatility.
Comparative Analysis of Proprietary Trading Drawdown Rules: Topstep vs. Breakout vs. Maven
Firms like Topstep and Breakout represent two different ends of the risk management spectrum. Topstep focuses on EOD trailing drawdowns to support long-term trader growth. Breakout, conversely, utilizes a more automated, equity-based model that enforces real-time discipline.
Maven Trading utilizes an intraday trailing drawdown based on equity, making its instant-funded accounts more difficult to manage during periods of high volatility. However, Maven’s model is designed to “weed out gamblers” and reward those who can maintain steady equity curves without deep floating drawdowns.
| Firm | Daily Limit Logic | Max Drawdown Logic | Key Advantage |
|---|---|---|---|
| Topstep | Optional/Objective | EOD Trailing to Balance | High tolerance for intraday noise |
| Breakout | 3% – 5% (Equity) | Static (1-Step) / Trailing (2-Step) | Transparency via dashboard |
| Maven | Equity-based | Intraday Trailing (Equity) | Encourages extreme discipline |
| The5ers | Balance-based | Static | Trader-friendly for swing traders |
| FundingPips | Equity-based (5%) | Static (10%) | High margin capacity and fast payouts |
Prop Firm Drawdown Rules, Frequently Asked Questions
To provide a nuanced understanding for professional peers, we address the critical operational questions that define the daily reality of trading under drawdown constraints.
Is drawdown the same as a loss?
Drawdown and loss are related but distinct. A loss is realized when a position is closed at a value lower than the entry. A drawdown is a measure of the decline from a peak value, which can include both realized losses and unrealized (floating) paper losses. A drawdown is a temporary state until it either recovers to a new peak or results in an account breach.
Does the trailing threshold reset each day?
In an EOD model, the threshold is updated at the close of the day, effectively “resetting” its distance from the new balance high. However, in an intraday model, the threshold moves in real-time and does not reset; it stays at the highest level reached until a new peak is achieved. It never moves downward.
What is a “good” drawdown level?
In institutional investing, a maximum drawdown of 10% to 20% is often acceptable for long-term equity portfolios. In the proprietary trading space, professional traders aim to keep their daily drawdowns under 1% to 2% and their overall maximum drawdown under 5%, allowing for a substantial “buffer” before hitting firm-mandated limits.
Can slippage cause a breach despite a stop loss?
Yes. A stop-loss is an order to sell at the “next available price” once a threshold is hit. In fast-moving markets or during news events, the next available price may be significantly lower than the stop-loss trigger, causing the realized loss to exceed the drawdown limit and triggering an automatic account breach.
Should a trader choose static or trailing drawdown?
Static drawdown is objectively superior for the trader, as it provides a widening cushion of safety as the account grows. Trailing drawdown is more restrictive and is primarily designed to protect the firm’s capital. Traders should prioritize firms with static drawdowns or EOD trailing drawdowns that cease trailing once the starting balance is reached.
How Drawdown Rules Differ Across Prop Firm Trading Instruments
Drawdown management varies significantly across different asset classes due to differences in volatility and liquidity. BestProps categorizes these instruments to help traders align their strategies with the appropriate risk rules.
Forex and CFD Proprietary Trading Drawdown Rules
Forex pairs (e.g., EUR/USD, GBP/JPY) and CFDs offer high margin ratios, which can be a “double-edged sword” regarding drawdowns. Large lot sizes in volatile pairs like GBP/JPY can consume a daily drawdown limit in minutes. Prop firms typically cap FX position multipliers at 1:30 or 1:50 to mitigate this risk.
Drawdown Rules for Indices and Futures in Proprietary Trading
Trading indices like the NASDAQ (NQ) or S&P 500 (ES) involves high “point value” volatility. A 100-point move in the NQ can represent a significant percentage of a $50k account’s drawdown limit. Futures traders at firms like Topstep must be acutely aware of “permitted trading hours,” as holding positions through the daily settlement can expose them to gap-risk drawdowns.
Drawdown Rules for Commodities and Energies in Proprietary Trading
Commodities such as Gold (XAU) and Oil (WTI) are subject to sudden “market min” fluctuations driven by geopolitical events. These instruments often have higher margin requirements and tighter lot size limits (e.g., 1:9 position multipliers for metals) to prevent rapid drawdown breaches.
What Every Trader Should Know Before Choosing a Prop Firm Drawdown Rule
The management of drawdown is the defining characteristic of professional financial conduct. In the proprietary trading sector, the trend is moving toward more sophisticated, platform-integrated risk monitoring, as seen with the TopstepX ecosystem. The acquisition of firms like Breakout by major exchanges like Kraken suggests a future where prop trading rules become more aligned with institutional exchange standards.
For the trader, the path to a consistent payout requires an shift in focus from “profit targets” to “drawdown buffers.” Success is not measured by the speed at which one hits a target, but by the discipline with which one defends the equity curve. By utilizing the Three-Tier Framework, maintaining a 20% safety buffer for slippage, and selecting firms with EOD or static drawdown architectures, traders can transform drawdown from a terminal threat into a manageable operational cost.
The bridging of these concepts with traditional income drawdown reveals a universal truth: capital is most vulnerable during its distribution or speculative phases. Whether navigating a Trading Combine or a PensionBee retirement pot, the preservation of the “High Water Mark” remains the most effective strategy for long-term financial survival. Participants must look past the “flashy offers” of cheap evaluations and ask a singular, vital question: Do the rules of this environment provide a fair mathematical path to success? The answer lies in the technical details of the drawdown rulebook.